 Open Access Article
Effect of nitrogen co-doping with ruthenium on the catalytic performance of Ba/Ru–N-MC catalysts for ammonia synthesis†
Yongcheng Ma,
Guojun Lan,
Xiaolong Wang,
Geshan Zhang,
Wenfeng Han,
Haodong Tang,
Huazhang Liu and
Ying Li *
*
Institute of Industrial Catalysis, Zhejiang University of Technology, Chaowang Road 18, Hangzhou, China. E-mail: liying@zjut.edu.cn
First published on 16th July 2019
Abstract
Nitrogen co-doping with ruthenium mesoporous carbons (Ru–N-MC) was prepared by co-impregnation of sucrose and urea on a RuCl3/SiO2 template followed by a thermal carbonization process. The turnover frequency (TOF) of the Ba/Ru–N-MC catalyst in ammonia synthesis is 0.16 s−1 under reaction conditions of 400 °C, pressure of 10 MPa and space velocity of 10![[thin space (1/6-em)]](https://www.rsc.org/images/entities/char_2009.gif) 000 h−1. The superior catalytic performance of the Ba/Ru–N-MC is proposed to originate from the strong metal-support interaction between Ru nanoparticles (NPs) and carbon support. In addition to the activity, the Ba/Ru–N-MC catalyst exhibits a long-term stability for 35 h without significant deactivation.
000 h−1. The superior catalytic performance of the Ba/Ru–N-MC is proposed to originate from the strong metal-support interaction between Ru nanoparticles (NPs) and carbon support. In addition to the activity, the Ba/Ru–N-MC catalyst exhibits a long-term stability for 35 h without significant deactivation.
Introduction
Ammonia is one of the most highly produced chemicals in the chemical industry, which is mainly used as a fertilizer for nitrogen fixation and a precursor to nitrogenous compounds.1 At the same time, ammonia can also serve as a carrier for new energy hydrogen storage, and plays an important role in the development of the new energy industry.2,3 Mechanistically, the dissociative adsorption of N2 is the rate-determining step of ammonia synthesis because of the strong N![[triple bond, length as m-dash]](https://www.rsc.org/images/entities/char_e002.gif) N bond (945 kJ mol−1).4,5 Therefore, industrial ammonia synthesis (Haber–Bosch process) needs to be carried out under high temperature and high pressure in order to maintain the reaction and dissociate N2.6,7 Ruthenium-based catalysts have been intensively studied because they can work under milder conditions than promoted iron catalysts.8,9 Therefore, extensive efforts have been focused on the development of effective Ru-based catalysts.10,11
N bond (945 kJ mol−1).4,5 Therefore, industrial ammonia synthesis (Haber–Bosch process) needs to be carried out under high temperature and high pressure in order to maintain the reaction and dissociate N2.6,7 Ruthenium-based catalysts have been intensively studied because they can work under milder conditions than promoted iron catalysts.8,9 Therefore, extensive efforts have been focused on the development of effective Ru-based catalysts.10,11
Carbon materials, due to its various structures and facile modification, have been intensively investigated as supports for metal-based catalysts. However, electronic effect of a support is generally the most important factor of the activation of N2 over a Ru surface, and the dissociation of N2 can be promoted by electropositive elements.5,12,13 According to this, alkali metal is commonly used as the promoter of the reaction, due to their low work function and strong electron-donating power.14 However, alkali metal as an electron donor has the disadvantages of low melting point and large fluidity which causes instability at the reaction temperature.15 What's more, the handling of potassium nitrate with carbon support is unsafe due to the strong oxidation nature of nitrate for batch production of catalysts during enlargement. On the other hand, the introduction of nitrogen heteroatom atoms can increase the charge density of the carbon support, thus the rich-electron in the nitrogen-doped carbon material is transferred to the metal atom.16–19 In addition, nitrogen species in nitrogen-doped carbon materials play an important role in dispersing and stabilizing metal NPs.20 However, Ru supported on nitrogen-doped carbon nanotubes (N-CNTs) exhibited an obviously enhanced activity in ammonia synthesis under mild reaction conditions as compared with the CNTs supported Ru catalyst, which was attributed to the electron-donating nitrogen and the graphitization of carbon nanotubes.16 Shao et al. also confirmed that the electron donation of N atoms in N-CNTs promoted the dispersion of metal particles and catalytic performance.21 Hosono et al. reported that electrides are excellent supports for Ru catalysts, and demonstrating the importance of electron-rich supports, because the electrides can donate electrons to Ru, thus increased electron density of Ru metal which facilitates the dissociation of N2 and reduced the activation energy of the reaction.22,23
Recently, we reported a Ba–K/Ru-MC catalyst prepared via sucrose assisted in situ carbonization method double prompted with Ba and K promoters, which show high stability and performance in ammonia synthesis.24 We also found that the co-incorporation of N with Ru in carbon matrix can greatly improve the catalytic performance in acetylene hydrochlorination.25 In the present study, the effect of nitrogen on the catalytic performances of Ba/Ru–N-MC catalysts prepared by a nitrogen and ruthenium co-incorporation method is studied. The N-MC supported Ba–Ru/N-MC and Ba/Ru-MC are used as a comparison.
Experimental
Chemical and reagents
Nano-silica with particle size of 15 ± 5 nm and surface area of 250 ± 30 m2 g−1 provided by Hangzhou Wanjing New Material Co., Ltd., RuCl3·xH2O was obtained from Sino-Platinum Metals (SPM) Co., Ltd. and Ba(NO3)2 was obtained from Sinopharm Chemical Reagent Co. Ltd. Other reagents were obtained from Shanghai Chemical Reagent Inc. of Chinese Medicine Group. All materials were analytical grade and used without any further purification.Preparation of various catalysts
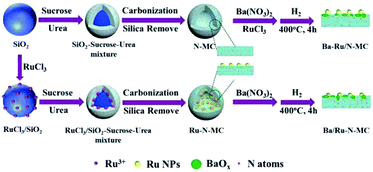
The preparation of Ru–N-MC is similar with the Ru–N-OMC reported in our previous work25 except that the nano-silica instead of SBA-15 was used. In brief, a solution containing RuCl3·xH2O (0.6 g) and distilled water (17.0 mL) was used to infiltrate 6.0 g of silica, which was dried at 100 °C for 3 h to get RuCl3/SiO2. A precursor solution contained sucrose (7.5 g), urea (0.66 g) and oxalic acid (0.6 g) into distilled water (8 mL), and the solution could infiltrate the mesopores of the RuCl3/SiO2 and then pre-carbonized at 100 °C for 6 h and at 160 °C for 6 h. Then the composite was heated from 30 °C to 850 °C at a ramp rate of 3 °C min−1 in N2 flow and carbonization at 850 °C for 3 h. The composite was then washed with sodium hydroxide solution at 70 °C to remove the silica template completely. The template-free product was thus obtained and denoted as Ru–N-MC. The preparation procedure of N-MC is similar to Ru–N-MC but without the impregnation of RuCl3. The preparation of Ru-MC is similar to that of Ru–N-MC without urea.24Measurement of catalytic activities in ammonia synthesis
Ammonia synthesis was carried out in a fixed-bed reactor with an inside diameter of 14 mm at 400–450 °C, space velocity of 10![[thin space (1/6-em)]](https://www.rsc.org/images/entities/char_2009.gif) 000 h−1 and pressure of 10 MPa. The catalysts (2 mL, 0.90–1.43 mm) were loaded in the isothermal zone of the reactor and activated by a mixture of N2 and H2 (N2
000 h−1 and pressure of 10 MPa. The catalysts (2 mL, 0.90–1.43 mm) were loaded in the isothermal zone of the reactor and activated by a mixture of N2 and H2 (N2![[thin space (1/6-em)]](https://www.rsc.org/images/entities/char_2009.gif) :
:![[thin space (1/6-em)]](https://www.rsc.org/images/entities/char_2009.gif) H2 = 1
H2 = 1![[thin space (1/6-em)]](https://www.rsc.org/images/entities/char_2009.gif) :
:![[thin space (1/6-em)]](https://www.rsc.org/images/entities/char_2009.gif) 3) at a pressure of 5 MPa and a space velocity of 30
3) at a pressure of 5 MPa and a space velocity of 30![[thin space (1/6-em)]](https://www.rsc.org/images/entities/char_2009.gif) 000 h−1 at 400 °C for 4 h, 425 °C for 8 h, 450 °C for 8 h, and 475 °C for 4 h. Under these conditions, the concentration of ammonia in the exit gas of the reactor was measured by sulfuric acid neutralization, the diluted sulfuric acid concentration was 0.25 mol L−1, the volume was 10 mL and the methyl red as an indicator. The synthesis gas was derived from the decomposition of ammonia with deep removal of H2O, CO, CO2 and residual NH3 over Pd, 13X, and 5A molecular sieves.
000 h−1 at 400 °C for 4 h, 425 °C for 8 h, 450 °C for 8 h, and 475 °C for 4 h. Under these conditions, the concentration of ammonia in the exit gas of the reactor was measured by sulfuric acid neutralization, the diluted sulfuric acid concentration was 0.25 mol L−1, the volume was 10 mL and the methyl red as an indicator. The synthesis gas was derived from the decomposition of ammonia with deep removal of H2O, CO, CO2 and residual NH3 over Pd, 13X, and 5A molecular sieves.
Characterizations
Powder X-ray diffraction (XRD) patterns were recorded on a Rigaku D/Max-2500/pc powder diffraction system using Cu Kα radiation (40 kV and 100 mA) over the range 10° ≤ 2θ ≤ 80°.Nitrogen sorption isotherms were determined at −196 °C by a Quantachrome Autosorb-IQ instrument in the static measurement mode. Before the measurement, the samples were degassed at 200 °C for 10 h. The pore size distribution of the supports was determined by the BJH method based on desorption branch.
X-ray photoelectron measurements (XPS) were conducted on a Kratos AXIS Ultra DLD instruments using 300 W Al Kα radiation and C 1s peak at 284.6 eV as the internal standard. The nitrogen content of the catalysts was determined on a vario MACRO cube Elemental Analyzer.
The dispersion of Ru was obtained by CO chemisorption method, which was carried out at 40 °C on Quantachrome Autosorb-1/C chemisorb apparatus. Prior to measurements, the pre-reduced catalysts were reduced in situ for 2 h at 400 °C in H2, and then vacuum for 2 h. The Ru dispersion and particle size were estimated based on assumption of a spherical geometry of the particles and an adsorption stoichiometry of one CO molecule on one Ru surface atom.
High resolution transmission electron microscopy (HRTEM) was performed on a TECNAI G2 F30 S-TWIN FEI Tecnai electron microscope with a field emission gun as the source of electrons operated at 300 kV.
Hydrogen-temperature-programmed reduction analyses (H2-TPR-MS) were carried out using a self-made TPD/TPR instrument. The mass spectra were collected by an on-line Hiden gas analyzer (QIC 20). Prior to analysis, the sample (ca. 50 mg) was placed in a fixed bed of U-shaped quartz tubular located inside an electrical furnace and dehydrated at 110 °C for 1 h under flowing Ar. Then, the temperature was raised at a rate of 10 °C min−1 from 50 °C up to 850 °C, under a flow of 5% H2/Ar (30 mL min−1). The following mass signals were monitored simultaneously by a quadrupole mass spectrometer: m/z = 2, 15, 16, 17, 18, 28, and 44 amu.
Results and discussion
For clarity, preparation procedures of various catalysts are given in Scheme 1. The Ba–Ru/N-MC was prepared by impregnation of barium nitrate and RuCl3·xH2O on the N-MC followed by H2 reduction process. The Ba/Ru–N-MC catalyst was prepared by impregnation of barium nitrate on the as-prepared Ru–N-MC. The as-prepared Ba/Ru–N-MC and Ba–Ru/N-MC catalysts were reduced by H2 before all the characterizations and catalytic tests.The porosities of N-MC, Ru/N-MC, Ru–N-MC, Ba/Ru–N-MC and Ba–Ru/N-MC were measured by N2 sorption, which are given in Fig. 1. All of them have type-IV adsorption isotherm with an H1 hysteresis loop, which was reasonably associated with the presence of mesoporous structure, and the textural properties are summarized in Table 1. The specific surface area of N-MC and Ru/N-MC are 768 and 752 m2 g−1, respectively, and pore size of N-MC and Ru/N-MC calculated based on the desorption branch of isotherm according to the BJH method are both 11.2 nm. Correspondingly, the specific surfaces area of Ru–N-MC is 656 m2 g−1 and pore size is 9.2 nm, indicating that the existence of Ru affects the formation of the mesoporous carbon structure. Moreover, the surface area, pore volume, and pore size of Ba–Ru/N-MC and Ba/Ru–N-MC are almost the same with Ru/N-MC and Ru–N-MC, suggesting that Ba promoter did not block or alter the pore structure. Fig. S1† gives the N2 adsorption–desorption isotherms and pore size distributions of Ru-MC and Ba/Ru-MC, and corresponding texture structure parameters are summarized in Table S1.† The specific surface area of Ru-MC and Ba/Ru-MC are 928 and 920 m2 g−1, respectively, and pore size of those catalysts are 9.2 nm. Spectrophotometric method was used to determine the ruthenium loading in the Ba–Ru/N-MC, Ba/Ru-MC and Ba/Ru–N-MC catalysts and the actual Ru content are 4.07, 4.21 and 3.75 wt%, respectively (Table 1).
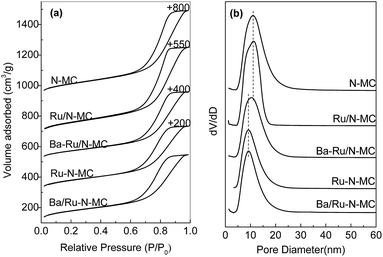 | ||
| Fig. 1 (a) N2 adsorption–desorption isotherms and (b) pore size distribution curves of the different catalysts. | ||
| Samples | Rua (wt%) | S. A.b (m2 g−1) | P. V.c (cm3 g−1) | P. D.d (nm) | CO chemisorption | TEM | rf (mmol g−1 h−1) | TOFg (s−1) | Ea (kJ mol−1) | |||
|---|---|---|---|---|---|---|---|---|---|---|---|---|
| CO uptake (μmol g−1) | Dispersion (%) | Particle size (nm) | Dispersione (%) | Particle size (nm) | ||||||||
a Ru wt% was measured by the spectrophotometric method.b The specific surface area.c The total pore volume.d Pore diameter calculated by the desorption branches of the isotherms using the BJH method.e Ru dispersion was obtained using the equation DRu = 1.33/dRu.f Reaction rates were measured at 10 MPa, 400 °C, 10![[thin space (1/6-em)]](https://www.rsc.org/images/entities/char_2009.gif) 000 h−1.g TOF was calculated based on the amount of CO uptake. 000 h−1.g TOF was calculated based on the amount of CO uptake. |
||||||||||||
| N-MC | — | 768 | 1.07 | 11.2 | — | — | — | — | — | — | — | — |
| Ru/N-MC | 4.33 | 752 | 1.06 | 11.2 | 228.9 | 53.4 | 2.5 | 70.0 | 1.9 | — | — | — |
| Ba–Ru/N-MC | 4.07 | 724 | 1.03 | 11.2 | 220.2 | 56.0 | 2.4 | 70.0 | 1.9 | 27 | 0.03 | 82.5 |
| Ru–N-MC | 4.16 | 656 | 0.83 | 9.2 | 125.7 | 30.8 | 4.4 | 66.5 | 2.0 | — | — | — |
| Ba/Ru–N-MC | 3.75 | 647 | 0.85 | 9.2 | 136.0 | 36.9 | 3.7 | 66.5 | 2.0 | 79 | 0.16 | 64.2 |
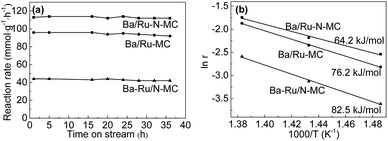
The catalytic performance of Ru/N-MC, Ba–Ru/N-MC, Ru–N-MC and Ba/Ru–N-MC catalysts for ammonia synthesis was evaluated at 400–450 °C, pressure of 10 MPa and space velocity of 10![[thin space (1/6-em)]](https://www.rsc.org/images/entities/char_2009.gif) 000 h−1. The results are given in Table 1. Ru/N-MC and Ru–N-MC without barium promoter shows negligible activity. And the ammonia synthesis rates of Ba–Ru/N-MC and Ba/Ru–N-MC are 27 and 79 mmol g−1 h−1, respectively. This suggests that the barium promoter is important to carbon supported ruthenium catalysts.26,27 The results are the same with previous reported work.28–31 Fig. 2a shows ammonia synthesis reaction rate with time on stream over Ba/Ru–N-MC, Ba–Ru/N-MC and Ba/Ru-MC catalysts under pressure of 10 MPa at 425 °C. The ammonia synthesis rate remains unchanged over approximately 35 h, which implying a good stability of the Ba/Ru–N-MC, Ba–Ru/N-MC and Ba/Ru-MC catalysts. The Ba/Ru–N-MC catalyst shows high reaction rate of ammonia synthesis, which is much higher than Ba–Ru/N-MC and higher than Ba/Ru-MC catalyst. From the slopes of the Arrhenius plots, the apparent activation energies were calculated and are summarized in Fig. 2b. The thermodynamic equilibrium ammonia concentration at outlet under 425 °C, 10 MPa is approximately 20.4%, while the ammonia concentration conversion is 3.7%, which is far from the equilibrium. Therefore, the apparent activation energy obtained can reflect the real performance of the catalyst. The activation energy of Ba/Ru–N-MC for ammonia synthesis is 64.2 kJ mol−1, which is much lower than Ba–Ru/N-MC (82.5 kJ mol−1) and lower than the activation energy 76.2 kJ mol−1 of Ba/Ru-MC. The low activation energy indicates that Ba/Ru–N-MC catalyst is more active than that of the Ba–Ru/N-MC and Ba/Ru-MC. Moreover, the catalytic performance of various catalysts with similar composition in ammonia synthesis reaction was summarized and given in Table S2.† The Ba/Ru–N-MC catalyst also shows much higher activity than those of similar catalysts reported in literatures. To identify the specific structure of the highly active Ba/Ru–N-MC catalyst prepared by the nitrogen co-doping with ruthenium, the detailed characterizations have been carried out and discussed in the following parts.
000 h−1. The results are given in Table 1. Ru/N-MC and Ru–N-MC without barium promoter shows negligible activity. And the ammonia synthesis rates of Ba–Ru/N-MC and Ba/Ru–N-MC are 27 and 79 mmol g−1 h−1, respectively. This suggests that the barium promoter is important to carbon supported ruthenium catalysts.26,27 The results are the same with previous reported work.28–31 Fig. 2a shows ammonia synthesis reaction rate with time on stream over Ba/Ru–N-MC, Ba–Ru/N-MC and Ba/Ru-MC catalysts under pressure of 10 MPa at 425 °C. The ammonia synthesis rate remains unchanged over approximately 35 h, which implying a good stability of the Ba/Ru–N-MC, Ba–Ru/N-MC and Ba/Ru-MC catalysts. The Ba/Ru–N-MC catalyst shows high reaction rate of ammonia synthesis, which is much higher than Ba–Ru/N-MC and higher than Ba/Ru-MC catalyst. From the slopes of the Arrhenius plots, the apparent activation energies were calculated and are summarized in Fig. 2b. The thermodynamic equilibrium ammonia concentration at outlet under 425 °C, 10 MPa is approximately 20.4%, while the ammonia concentration conversion is 3.7%, which is far from the equilibrium. Therefore, the apparent activation energy obtained can reflect the real performance of the catalyst. The activation energy of Ba/Ru–N-MC for ammonia synthesis is 64.2 kJ mol−1, which is much lower than Ba–Ru/N-MC (82.5 kJ mol−1) and lower than the activation energy 76.2 kJ mol−1 of Ba/Ru-MC. The low activation energy indicates that Ba/Ru–N-MC catalyst is more active than that of the Ba–Ru/N-MC and Ba/Ru-MC. Moreover, the catalytic performance of various catalysts with similar composition in ammonia synthesis reaction was summarized and given in Table S2.† The Ba/Ru–N-MC catalyst also shows much higher activity than those of similar catalysts reported in literatures. To identify the specific structure of the highly active Ba/Ru–N-MC catalyst prepared by the nitrogen co-doping with ruthenium, the detailed characterizations have been carried out and discussed in the following parts.
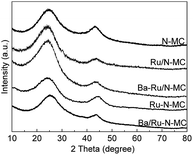
The XRD patterns of the N-MC, Ru/N-MC, Ba–Ru/N-MC, Ru–N-MC and Ba/Ru–N-MC are presented in Fig. 3. Two broad peaks appear at 25° and 44°, which corresponded to the characteristic diffractions of (002) and (101) crystal planes of graphitic carbon structure. And no diffraction peaks attributed to the bulk metallic Ru phase probably due to the high dispersion of Ru NPs. The HRTEM images and Ru particle size distributions of the Ru–N-MC and Ru/N-MC catalysts are provided in Fig. 4a and b. It can be observed that the Ru NPs are uniformly distributed among the support and particle aggregation was not observed for Ru–N-MC and Ru/N-MC catalysts. The average Ru particle size of Ru–N-MC is estimated to be 2.0 nm, and the value is ca. 1.9 nm for the Ru/N-MC (Table 1), which was calculated based on more than 100 particles. The HRTEM images and Ru NPs size distributions of Ba/Ru–N-MC and Ba–Ru/N-MC catalysts are also provide in Fig. 4c and d. The average particle size of Ba/Ru–N-MC and Ba–Ru/N-MC were 2.0 and 1.9 nm, respectively (Table 1), which are not changed after loading with barium promoter. This result is consistent with our previous report,24 indicating that the addition of Ba promoter does not affect the particle size of Ru NPs of carbon supported ruthenium catalysts.
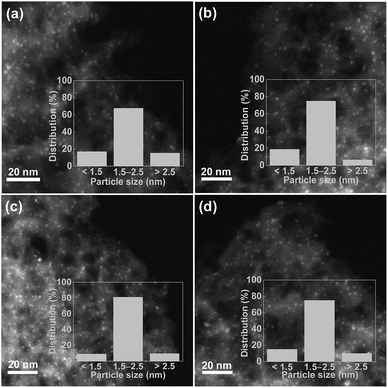 | ||
| Fig. 4 Representative HRTEM image and particle size distributions of (a) Ru–N-MC, (b) Ru/N-MC, (c) Ba/Ru–N-MC and (d) Ba–Ru/N-MC. | ||
CO chemisorption is reliable method to detect the surface exposed active sites for supported noble metal catalysts. The dispersion of Ru NPs measured by CO chemisorption is also provided in Table 1. The amount of CO uptake for Ru/N-MC and Ba–Ru/N-MC are 228.9 and 220.2 μmol g−1, respectively. And the average size of Ru NPs based on CO chemisorption for Ru/N-MC and Ba–Ru/N-MC samples are 2.5 and 2.4 nm, respectively. This value is higher than the value obtained from the HRTEM measurement, this may be caused by the experimental error and also suggesting that the presence of residual chlorine or other impurities may lead to the blockage of the Ru sites for CO adsorption.32 From a comparison of Ru/N-MC and Ba–Ru/N-MC, the addition of barium salt doesn't change the adsorption data much, this further indicates that the addition of barium nitrate will not affect the dispersion of Ru NPs and barium compounds do not cover the surface of Ru NPs. Furthermore, the CO uptake value are 125.7 and 136 μmol g−1 for Ru–N-MC and Ba/Ru–N-MC, respectively, this value is much lower than the supported counterparts, but combined with the characterization results of HRTEM, shows that the co-doping of ruthenium and nitrogen will not affect the dispersion of Ru NPs on carbon support, but will affect the existence of Ru NPs on carbon. In addition, the CO uptake value of Ru-MC and Ba/Ru-MC are 154.2 and 140.8 μmol g−1, respectively, which is similar to those of co-doping of ruthenium and nitrogen. Based on the special structure caused by nitrogen co-doping with ruthenium, we have fully discussed in our previous papers.24
From the above characterization, the surface exposed Ru atom fraction of the Ba/Ru–N-MC is much lower than that of the Ba–Ru/N-MC, but the catalytic performance is much higher. To further identify the intrinsic activity, the TOF value of Ba–Ru/N-MC and Ba/Ru–N-MC calculated based on the surface CO adsorption data are given in Table 1, which are 0.03 and 0.16 s−1, respectively. The intrinsic activity for Ba/Ru–N-MC is almost 5 times higher than the Ba–Ru/N-MC. Although the particle size is similar as identified by HRTEM for Ba–Ru/N-MC and Ba/Ru–N-MC catalysts, and BET results also showed that their pore structures were similar. Thus, in order to further analyze the possible reasons for the difference in the activity of the two catalysts, XPS and H2-TPR were characterized in detail.
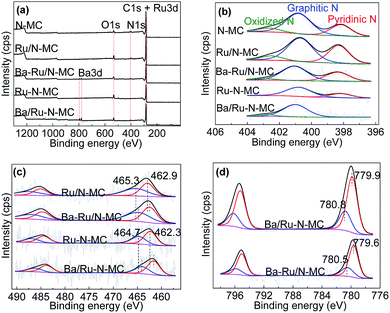
Then, the status of Ru NPs and nitrogen species was investigated by X-ray photoelectron spectroscopy (XPS) technique. Fig. 5a gives the survey spectra of all materials. C 1s, N 1s and Ba 3d peaks can be obviously observed implying the successful doping of the N atoms into the carbon framework. As can be seen in Fig. 5b, the chemical states of nitrogen can be well deconvoluted into three main peaks in the N 1s peak of N-MC sample at 398.3, 400.9 and 402.8 eV, which corresponding to pyridinic N, graphitic N and oxidized N, respectively.33,34 And the contents of various N species for N-MC, Ru/N-MC, Ba–Ru/N-MC, Ru–N-MC and Ba/Ru–N-MC are shown in Table 2. For Ru/N-MC and Ba–Ru/N-MC catalysts, the content of nitrogen species is not obvious change compare with N-MC, suggests the introduction of Ru and Ba species has little effect on the status of nitrogen in carbon framework.35 However, for Ru–N-MC sample, the oxidation N disappears and the graphitic N content increases, indicating that the in situ doping of Ru can prevent the oxidation of N.16,36 The pyridinic N disappears after barium loading for Ba/Ru–N-MC catalyst and forms a small amount of oxidized N, which indicates that an interaction between the Ba promoter and the N species.
Fig. 5c illustrates the Ru 3p results of the Ru/N-MC, Ba–Ru/N-MC, Ru–N-MC and Ba/Ru–N-MC catalysts. The binding energy values and the area ratios of the XPS peaks are also summarized in Table 3. For Ru/N-MC, the peak around 462.9 eV was attributed to Ru0, while those around 465.3 eV correspond to RuOx species.34,37 While the binding energy of Ru0 (462.3 eV) and RuOx species (464.7 eV) in Ru–N-MC were negatively shifted compared with Ru/N-MC. This result is related to the contents of graphitic N and pyridinic N in the Ru/N-MC and Ru–N-MC, because the graphitic N in the N-doped carbon material acts as an electron donor behavior and pyridinic N functioning as an electron acceptor.38,39 It can be explained that co-doping of Ru and nitrogen into the carbon material can make the stronger interaction with Ru NPs and N atoms, and thus increased electron cloud density of Ru NPs. For Ba–Ru/N-MC and Ba/Ru–N-MC catalysts, the addition of Ba promoter resulted in a negative shift in the binding energy of Ru for both catalysts, suggesting the electrons transfer from Ba promoter to Ru surface for both Ba–Ru/N-MC and Ba/Ru–N-MC catalysts. However, the binding energy of Ba/Ru–N-MC was negatively shifted compared with Ba–Ru/N-MC, suggesting the electron rich state of metallic Ru NPs in Ba/Ru–N-MC.34,35,40 The election rich structure of Ru NPs can decrease the barrier of N2 dissociative absorption. Therefore, it can greatly increase the reaction rate of ammonia synthesis and lower the activation energy of the ruthenium catalysts.
| Samples | Ru0 | Run+ | BaO | BaCO3 | ||||
|---|---|---|---|---|---|---|---|---|
| Binding energy (eV) | Area (%) | Binding energy (eV) | Area (%) | Binding energy (eV) | Area (%) | Binding energy (eV) | Area (%) | |
| Ru/N-MC | 462.9 | 49.6 | 465.3 | 50.4 | — | — | — | — |
| Ba–Ru/N-MC | 462.3 | 50.0 | 464.7 | 50.0 | 779.6 | 73.5 | 780.5 | 26.5 |
| Ru–N-MC | 462.3 | 51.8 | 464.7 | 48.2 | — | — | — | — |
| Ba/Ru–N-MC | 461.6 | 52.3 | 464.0 | 47.7 | 779.9 | 72.2 | 780.8 | 27.8 |
Fig. 5d shows Ba 3d XPS spectra for the Ba/Ru–N-MC catalyst appears ca. 779.9 and 780.8 eV, assigning to BaO and BaCO3, respectively.41,42 While the binding energy position of the Ba–Ru/N-MC catalyst is 779.6 and 780.5 eV. The binding energy of barium in the Ba/Ru–N-MC catalyst is positive shifted compared with Ba–Ru/N-MC catalyst, suggesting that the N atom has a certain effect on the electronic state of Ba for the Ba/Ru–N-MC catalyst, which leads to the strong electron donating ability of Ba promoter in Ba/Ru–N-MC catalyst. Based on above discussion, it can be concluded that the electron-rich Ru NPs plays a key role in the ammonia synthesis reaction.
To gain more insights into the interaction between Ru NPs and carbon framework, hydrogen temperature programmed reduction (H2-TPR) method was conducted, and the results are shown in Fig. 6. The H2-TPR patterns of the Ru/N-MC and Ru–N-MC sample without Ba promoter are shown in Fig. 6a and b, and the information of the TPR peaks is summarized in Table S3.† The consumption of H2 signals is obviously different for Ru/N-MC and Ru–N-MC samples, indicating a different status of Ru NPs in these samples. The first peak observed at 237 and 155 °C for Ru/N-MC and Ru–N-MC, respectively, which can be assigned to the reduction of RuOx since only the H2O signal appeared at corresponding temperature ranges. It can be concluded that the reduction of Ru NPs is easier for Ru–N-MC than for Ru/N-MC. The second peaks at 230 °C for Ru–N-MC can be assigned to the methanation of carbon species located near the Ru NPs because the Ru is a good catalyst for the methanation of carbon and with a signal of m/z = 15 been detected simultaneously. The methanation signal of Ru/N-MC appears at 282 °C with only a very small methanation signal detected. The H2 consumption peak at high temperature range (500–600 °C) can be assigned to the decomposition of oxygen-containing groups on the surface of the samples, and CO and CO2 molecules are detected by a mass spectrometer in this temperature range (Fig. S2†). Considering the above results, the carbon methanation peaks are shifted into lower temperature for Ru–N-MC compared with the Ru/N-MC, this can be explained by an easier methanation of the Ru–N-MC samples than for Ru/N-MC owing to the Ru–N-MC prepared by in situ nitrogen co-doping with ruthenium has a strong Ru–carbon interaction, and this result is accordance with our previous paper.24,43 Fig. 6c and d shows H2-TPR profiles of the Ba–Ru/N-MC and Ba/Ru–N-MC catalysts, respectively. Obviously, the addition of Ba promoter significantly affected the reduction of Ba–Ru/N-MC and Ba/Ru–N-MC catalysts. The H2 consumption peak at high temperature range (500–600 °C) for Ba/Ru–N-MC disappears, which may be due to the strong interaction of barium species with the carbon support can suppress the decomposition of oxygen-containing surface functional groups of the carbon supports.
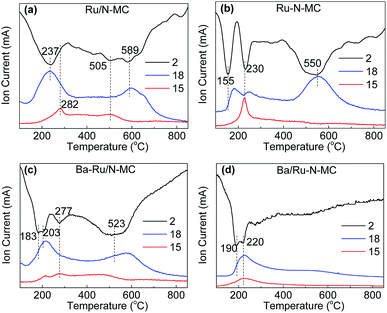 | ||
| Fig. 6 H2-temperature programmed reduction profiles for (a) Ru/N-MC, (b) Ru–N-MC, (c) Ba–Ru/N-MC and (d) Ba/Ru–N-MC catalysts. | ||
From the H2-TPR characterization of the above catalysts, the methanation of carbon support is inevitable. However, our previous paper reported24 that the methanation of carbon only occurs at the start of the reaction, and the peak value decreased significantly to zero within 4 h because the surface of the catalyst contained a small amount of unstable carbon, and is beneficial for methanation at low temperatures. Therefore, the formation of methane has a negligible influence on the stability of catalysts. To further identify with the high stability of Ru-based catalysts, the used Ba–Ru/N-MC and Ba/Ru–N-MC catalysts are characterized. Fig. S3(a) and (b)† give the N2 adsorption–desorption isotherms and pore size distributions of the Ba–Ru/N-MC-used and Ba/Ru–N-MC-used catalysts. Table S4† shows that the surface area of Ba–Ru/N-MC-used and Ba/Ru–N-MC-used catalysts were decreased by 6.4% and 2.6%, respectively, indicates the pore structure of the catalysts is maintained in the ammonia synthesis. In addition, Fig. S4† displays the typical HRTEM images and particle size distributions of the Ba–Ru/N-MC-used and Ba/Ru–N-MC-used catalysts. It is worth noting that no particle aggregation of the used catalysts was observed, suggesting that the catalyst sintering did not occur during the reaction, so the prepared catalyst was stable in ammonia synthesis.
Finally, in order to determine the stability of N element in Ba/Ru–N-MC catalyst under the condition of ammonia synthesis, the Ba/Ru–N-MC catalyst before and after the reaction was analysed, and the results are given in Table S5.† First of all, we found that the N loading is 1.44% for the Ru–N-MC, and Ba/Ru–N-MC catalyst after reduction was 1.41%, indicating that the addition of the Ba promoter did not affect the N content in Ru–N-MC sample. However, in order to remove the nitrogen species that may be adsorbed on the carbon surface under the reaction conditions, we reduced the Ba/Ru–N-MC catalyst after the reaction, and found that the nitrogen content was 1.64%. It can be explained that the nitrogen species can be stably present in the carbon material under ammonia synthesis conditions.
Conclusions
In summary, we report a facile approach to prepare ruthenium and nitrogen co-doped mesoporous carbon (Ru–N-MC) by co-impregnation and carbonization of sucrose and urea into RuCl3/SiO2 template. X-ray photoelectron spectroscopy (XPS) and CHNS analysis demonstrates that N atoms can be successfully doped into the carbon framework of Ru–N-MC, and more than 70% was incorporated into the carbon framework as graphitic nitrogen species. Ru–N-MC has uniformly Ru NPs and strong interaction between Ru NPs and carbon supports. The co-doping of ruthenium and nitrogen also changes the existence of nitrogen species in Ru–N-MC and it also affects the electronic state of the metal Ru. And thus Ba/Ru–N-MC catalyst has excellent catalytic activity for ammonia synthesis and better long-term stability. Additionally, this method is expected to expand the production of Ru–N-MC catalyst, which may have significant prospects for large-scale applications.Conflicts of interest
There are no conflicts to declare.Acknowledgements
This work was supported by the Natural Science Foundation of China (NSFC Grant No. 20803064), and the Natural Science Foundation of Zhejiang Province (LY17B030010).References
- H. Z. Liu, Chin. J. Catal., 2014, 35, 1619–1640 CrossRef CAS
.
- W. B. Gao, J. P. Guo, P. K. Wang, Q. R. Wang, F. Chang, Q. J. Pei, W. J. Zhang, L. Liu and P. Chen, Nat. Energy, 2018, 29, 1–9 Search PubMed
.
- R. Manabe, H. Nakatsubo, A. Gondo, K. Murakami, S. Ogo, H. Tsuneki, M. Ikeda, A. Ishikawa, H. Nakai and Y. Sekine, Chem. Sci., 2017, 8, 5434–5439 RSC
.
- Z. W. Ma, X. M. Xiong, C. L. Song, B. Hu and W. Q. Zhang, RSC Adv., 2016, 6, 51106–51110 RSC
.
- M. Kitano, Y. Inoue, H. Ishikawa, K. Yamagata, T. Nakao, T. Tada, S. Matsuishi, T. Yokoyama, M. Hara and H. Hosono, Chem. Sci., 2016, 7, 4036–4043 RSC
.
- S. Back and Y. Jung, Phys. Chem. Chem. Phys., 2016, 18, 9161–9166 RSC
.
- Y. Li, C. G. Pan, W. F. Han, H. F. Chai and H. Z. Liu, Catal. Today, 2011, 174, 97–105 CrossRef CAS
.
- B. Y. Lin, L. Heng, B. Y. Fang, H. Y. Yin, J. Ni, X. Y. Wang, J. X. Lin and L. L. Jiang, ACS Catal., 2019, 9, 1635–1644 CrossRef CAS
.
- M. Kitano, S. Kanbara, Y. Inoue, N. Kuganathan, P. V. Sushko, T. Yokoyama, M. Hara and H. Hosono, Nat. Commun., 2015, 6, 6731–6739 CrossRef CAS
.
- Y. P. Zhou, G. J. Lan, B. Zhou, W. Jiang, W. F. Han, H. Z. Liu and Y. Li, Chin. J. Catal., 2013, 34, 1395–1401 CrossRef CAS
.
- Y. C. Ma, G. J. Lan, W. Z. Fu, Y. Lai, W. F. Han, H. D. Tang, H. Z. Liu and Y. Li, J. Energy Chem., 2020, 41, 79–86 CrossRef
.
- W. F. Han, L. H. Li, H. Y. Yan, H. D. Tang, Z. Li, Y. Li and H. Z. Liu, ACS Sustainable Chem. Eng., 2017, 5, 7195–7202 CrossRef CAS
.
- S. J. Guo, X. L. Pan, H. L. Gao, Z. Q. Yang, J. J. Zhao and X. H. Bao, Chem.–Eur. J., 2010, 16, 5379–5384 CrossRef CAS PubMed
.
- F. R. García-García, J. Álvarez-Rodríguez, I. Rodríguez-Ramos and A. Guerrero-Ruiz, Carbon, 2010, 48, 267–276 CrossRef
.
- M. Hara, M. Kitano and H. Hosono, ACS Catal., 2017, 7, 2313–2324 CrossRef CAS
.
- W. J. Gao, S. J. Guo, H. B. Zhang, X. L. Pan and X. H. Bao, Chin. J. Catal., 2014, 32, 1418–1423 Search PubMed
.
- J. R. Wei, W. L. Shen, J. Zhao, C. W. Zhang, Y. H. Zhou and H. Y. Liu, Catal. Today, 2018, 316, 199–205 CrossRef CAS
.
- Y. Wang, J. Yao, H. R. Li, D. S. Su and M. Antonietti, J. Am. Chem. Soc., 2011, 133, 2362–2365 CrossRef CAS
.
- Y. T. Gong, P. F. Zhang, X. Xu, Y. Li, H. R. Li and Y. Wang, J. Catal., 2013, 297, 272–280 CrossRef CAS
.
- Z. W. Ma, S. L. Zhao, X. M. Xiong, B. Hu and C. L. Song, Catal. Lett., 2016, 146, 2324–2329 CrossRef CAS
.
- Y. Y. Shao, J. H. Sui, G. P. Yin and Y. Z. Gao, Appl. Catal., B, 2008, 79, 89–99 CrossRef CAS
.
- Y. F. Lu, J. Li, T. Tada, Y. Toda, S. Ueda, T. Yokoyama, M. Kitano and H. Hosono, J. Am. Chem. Soc., 2016, 138, 3970–3973 CrossRef CAS
.
- Y. Inoue, M. Kitano, S. W. Kim, T. Yokoyama, M. Hara and H. Hosono, ACS Catal., 2014, 4, 674–680 CrossRef CAS
.
- Y. P. Zhou, Y. C. Ma, G. J. Lan, H. D. Tang, W. F. Han, H. Z. Liu and Y. Li, Chin. J. Catal., 2019, 40, 114–123 CrossRef CAS
.
- G. J. Lan, Y. Yang, X. L. Wang, W. F. Han, H. D. Tang, H. Z. Liu and Y. Li, Microporous Mesoporous Mater., 2018, 264, 248–253 CrossRef CAS
.
- L. Forni, D. Molinari, I. Rossetti and N. Pernicone, Appl. Catal., A, 1999, 185, 269–275 CrossRef CAS
.
- W. F. Han, H. Z. Liu and H. Zhu, Catal. Commun., 2007, 8, 351–354 CrossRef CAS
.
- Z. Kowalczyk, S. Jodzis, W. Rarog, J. Zielinski, J. Pielaszek and A. Presz, Appl. Catal., A, 1999, 184, 95–102 CrossRef CAS
.
- C. H. Liang, Z. B. Wei, Q. Xin and C. Li, Appl. Catal., A, 2001, 208, 193–201 CrossRef CAS
.
- I. Rossetti, F. Mangiarini and L. Forni, Appl. Catal., A, 2007, 323, 219–225 CrossRef CAS
.
- E. Truszkiewicz, W. Raróg-Pilecka, K. Schmidt-Szałowski, S. Jodzis, E. Wilczkowska, D. Łomot, Z. Kaszkur, Z. Karpiński and Z. Kowalczyk, J. Catal., 2009, 265, 181–190 CrossRef CAS
.
- B. Y. Lin, K. M. Wei, J. Ni and J. X. Lin, ChemCatChem, 2013, 5, 1941–1947 CrossRef CAS
.
- S. W. Liu, H. M. Zhang, Q. Zhao, X. Zhang, R. R. Liu, X. Ge, G. Z. Wang, H. J. Zhao and W. P. Cai, Carbon, 2016, 106, 74–83 CrossRef CAS
.
- Z. Z. Wei, X. F. Li, J. Deng, J. Wang, H. R. Li and Y. Wang, Mol. Catal., 2018, 448, 100–107 CrossRef CAS
.
- W. Zhao, W. Li and J. L. Zhang, Catal. Sci. Technol., 2016, 6, 1402–1409 RSC
.
- G. H. An, E. H. Lee and H. J. Ahn, J. Alloys Compd., 2016, 682, 746–752 CrossRef CAS
.
- W. Y. Chen, D. L. Li, C. Peng, G. Qian, X. Z. Duan, D. Chen and X. G. Zhou, J. Catal., 2017, 356, 186–196 CrossRef CAS
.
- M. W. Zhao, Y. Y. Xia, J. P. Lewis and R. Q. Zhang, J. Appl. Phys., 2003, 94, 2398–2402 CrossRef CAS
.
- T. Schiros, D. Nordlund, L. Pálová, D. Prezzi, L. Zhao, K. S. Kim, U. Wurstbauer, C. Gutiérrez, D. Delongchamp, C. Jaye, D. Fischer, H. Ogasawara, L. G. M. Pettersson, D. R. Reichman, P. Kim, M. S. Hybertsen and A. N. Pasupathy, Nano Lett., 2012, 12, 4025–4031 CrossRef CAS
.
- Y. L. Cao, M. H. Tang, M. M. Li, J. Deng, F. Xu, L. Xie and Y. Wang, ACS Sustainable Chem. Eng., 2017, 5, 9894–9902 CrossRef CAS
.
- B. Y. Lin, Y. J. Guo, R. Liu, X. Y. Wang, J. Ni, J. X. Lin and L. L. Jiang, Ind. Eng. Chem. Res., 2018, 57, 2819–2828 CrossRef CAS
.
- M. Hattori, T. Mori, T. Arai, Y. Inoue, M. Sasase, T. Tada, M. Kitano, T. Yokoyama, M. Hara and H. Hosono, ACS Catal., 2018, 8, 10977–10984 CrossRef CAS
.
- G. J. Lan, H. D. Tang, Y. P. Zhou, W. F. Han, H. Z. Liu, X. N. Li and Y. Li, ChemCatChem, 2014, 6, 353–360 CrossRef CAS
.
Footnote |
| † Electronic supplementary information (ESI) available: Tables S1–S5 and Fig. S1–S4. See DOI: 10.1039/c9ra03097b |
| This journal is © The Royal Society of Chemistry 2019 |

