 Open Access Article
Controlling upconversion luminescence patterns in space with red emission enhancement from a single fluoride microcrystal by tuning the excitation mode
Qingyan Han *a,
Zhu Lua,
Wei Gaoa,
Wanting Zhoua,
Jianxia Qib,
Aihua Haoa and
Jun Dong*a
aSchool of Electronic Engineering, Xi'an University of Posts and Telecommunications, Xi'an 710121, China. E-mail: qyhan@xupt.edu.cn; dongjun@xupt.edu.cn
bSchool of Science, Xi'an University of Posts and Telecommunications, Xi'an 710121, China
First published on 4th June 2019
Abstract
The ability to control the upconversion (UC) luminescence patterns in space from lanthanide-doped UC luminescence materials is very important for many applications including three-dimensional color displays, optical waveguides and optical communication. In this work, the fascinating UC luminescence patterns could be adjusted from the blue or green flower-like emission pattern to the red flame-like irradiation pattern with a red luminescence enhancement from a single β-NaYF4:Yb3+/(Tm3+ or Er3+) microcrystal (MC) by varying the excitation position. The red-to-blue (R/B) and the red-to-green (R/G) emission intensity ratios from the single MC particle that the focal point position of excitation NIR laser is on the side lace are much stronger than that in the case of the focused laser beam on the center. We think that the physical mechanism from the changes in the luminescence pattern and the emission intensity ratio is explained by the optical waveguide effect based on the total reflection effect. These results provide a new strategy for facilitating fundamental investigations of the UC micro/nano-materials, which will lead to promising applications in three-dimensional color display, optical waveguides and optical communication.
1. Introduction
Upconversion (UC) luminescence is a process that can convert near-infrared (NIR) excitation into visible and ultraviolet emission.1,2 It shows photophysical properties such as high signal to noise ratio, long luminescence lifetime, sharp emission bands, excellent photostability, high photochemical stability, and low toxicity.3–6 Based on these advantages, lanthanide-doped UC luminescence materials have gained much attention in fundamental research and various frontier applications including photoinduced therapy, temperature sensing, solid-state lasers, photovoltaic conversion, biological imaging, and 3D displays.7–15 Although the morphology, crystal structure, and emission colors of UC luminescence materials could be accurately controlled, the high-efficiency UC emission and luminescence color or intensity manipulation of lanthanide-doped UC materials can't meet some specific applications in bioimaging and therapy.16,17 Searching for more efficient host materials, designing core–shell structures to alleviate surface-related quenching, and using surface plasmon resonance to enhance the local optical field is still explore to date.18–22As is well known, fluoride matrix is usually regarded as much more effective luminescence host materials due to the advantages of low energy phonons and transparency.23 Many micro/nano-materials with various morphologies and structures have been synthesized, including rods, prism, tubes, octahedron and some recently reports about hexagonal-phase NaYbF4 microrod with one-dimensional hollow microstructure, NaErF4@NaYF4 core–shell nanocrystals, and Yb3+–Er3+–Tm3+ tridoped hexagonal β-NaYF4 microrod.24–29 Among these lanthanide-doped fluoride materials, the brighter UC emission light could be achieved through searching for good configuration of the particle morphology, controlling optimum composition and concentration of lanthanide dopant, and introducing suitable noble metal-nanostructures. However, it is rarely reported on modulation of the UC luminescence intensity and patterns in space. The UC luminescence based on the waveguide effect may overcome these issues, in which the tight confinement of excitation light could not only be propagated along certain direction of in the media, but also effectively enhanced luminescence intensity by guiding light with increasing the optical path.30–32 Hence, this an opportunity to achieve UC luminescence patterns manipulation and irradiation intensity enhancement by controlling the excitation conditions.
In this work, two interesting UC luminescence patterns including flower-shaped emission and red flame-like irradiation from a single β-NaYF4:Yb3+/(Tm3+ or Er3+) MC with special structure are obtained via varying the excitation NIR laser position. In addition, the corresponding emission bands intensity would be also redistributed in space that results in a red emission enhancement with changing the excitation position based on the optical waveguide effect. The luminescence mechanism of the spatial control of the emission pattern and intensity were deeply investigated.
2. Experimental
2.1. Sample preparation
In all experimental processes, all the chemicals were used without further purification. The lanthanide oxides (Ln2O3 (99.99%), Ln = Y, Yb, Er, Tm) were supplied by Sigma-Aldrich. Sodium Fluoride (NaF, 98.00%) and sodium citrate (Na3C6H5O7·2H2O, 99.00%) were purchased from Sinopharm Chemical Reagent Co., Ltd. of China. Ultrapure deionized water was used throughout the experiments.The β-NaYF4:Yb3+–Er3+/Tm3+ microcrystals (MCs) were synthesized by a modified hydrothermal method.33 In a typical process, the Ln2O3 (Ln = Y, Yb, Er, and Tm) powders were dissolved in dilute nitric acid, respectively. The solution is stirred at 60 °C to evaporate the superfluous nitric acid. A colorless powder was dissolved in deionized water to form Ln(NO3)3 (Ln = Y, Yb, Er, and Tm) solutions. 0.3 mmol of Ln(NO3)3 (RE = Y, Yb, and Tm) aqueous solutions were added into 21.0 ml of deionized water and 0.5 mmol of sodium citrate. The mixture was magnetically stirred for 30 min at room temperature. Then, 6.0 ml of NaF (1.0 M) aqueous solution was added into the above solution, and the obtained solution was vigorously stirred for 25 min. Subsequently, the suspension was transferred to a Teflon-lined autoclave, and heated at 200 °C for 24 h. The resultant product was centrifugated at 4000 rpm for 5 min, washed with deionized water and ethanol three times, and dried under 60 °C for several hours.
2.2. Measurements
The morphology study of the as-prepared sample was characterized by using a scanning electron microscope (SEM, FEI-Nova NanoSEM 450). The phase purity of the samples was obtained with a Rigaku D/Max2550VB+/PC X-ray diffractometer with a graphite monochromatic Cu-Kα radiation source (λ = 0.154 06 nm). The UC luminescence property of a single MC was investigated by a confocal microscopy system. The UC luminescence spectra were recorded and analyzed by a spectrometer (SP2750i, 0.008 nm) equipped with a PIXIS 100 charge coupled device (CCD, ACTON) and a PD471 photomultiplier tube (PMT, ACTON). The wavelength of the excitation light was 980 nm. All measurements were performed at room temperature.3. Results and discussion
Hexagonal NaYF4 MCs were successfully prepared by a facile hydrothermal approach with the assistance of trisodium citrate. Fig. 1a shows the scanning electron microscope (SEM) image of NaYF4 MCs, which implies the purity and uniformity of the products. The size of MC particles has an average dimension of ≈5.0 μm and thicknesses of ≈2.0 μm. Intriguingly, the NaYF4 MC consists of an arc-shaped hexagonal plate and six petal-shaped side walls (Fig. 1b and c). The X-ray diffraction (XRD) spectrum provides an evidence that the MCs are pure hexagonal NaYF4 phase (JCPDS file no. 16-0334) as shown in Fig. 1d. It should be mentioned that there is no variation in the crystal structure of NaYF4 when Yb3+ and RE3+ (RE = Er or Tm) are co-doped to matrix lattice in the experiments.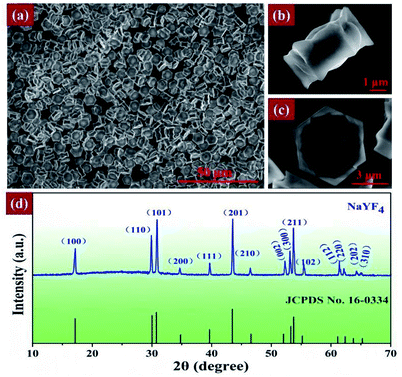 | ||
| Fig. 1 (a) SEM image of the as-synthesized NaYF4 hexagonal MCs. (b–c) SEM images of the single MC. (d) XRD pattern of the MCs and literature data for hexagonal phase NaYF4 (JCPDS file no. 16-0334). | ||
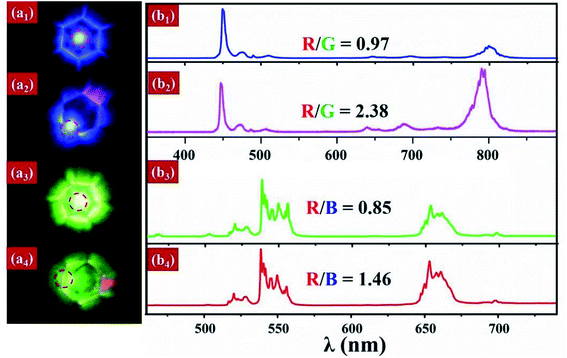
Hexagonal NaYF4 host are one of the most effective matrix materials and have been extensively investigated in the UC luminescence properties and applications. Thus, β-NaYF4:Yb3+/(Tm3+ or Er3+) MCs were chosen as a model to achieve the luminescence patterns modulation and the UC red emission enhancement via tuning the excitation positions. Fig. 2 presents excitation position-dependent UC luminescence patterns in the bright field of a single β-NaYF4:Yb3+/(Tm3+ or Er3+) MC by using a confocal microscopy system. When the NIR excitation laser beam is focused on the center of the single β-NaYF4:Yb3+/Tm3+ MC particle at a quartz substrate that is mounted on a horizontal 3D moveable platform, a beautiful blue flower-like luminescence pattern is obtained as shown in Fig. 2a1. The strong blue UC light accompanying with red emission is presented in Fig. 2b1, which is corresponding to the electronic transitions of 1D2 → 3F4 (center at 450 nm), 1G4 → 3H6 (center at 475 nm), 1G4 → 3F4 (center at 645 nm), 3F2 → 3H6 (center at 695 nm) and 3H4 → 3H6 (center at 800 nm), respectively. It is easy to observe that the UC red emission intensity is much weaker than the blue emission intensity. However, when the laser beam is transferred to the side of the single β-NaYF4:Yb3+/Tm3+ MC particle [Fig. 2a2], a special UC luminescence phenomenon that the bright directional red emission exhibits at one side of the single MP is observed [Fig. 2b2]. It is pointed out that the position of incident laser can be controlled by tuning the moveable platform. The red emission position and the excitation point position of the MC are exactly symmetrical. Furthermore, the red emission intensity is obviously stronger than the blue one. According to their spectra, it is found that the red-to-blue (R/B) emission intensity ratio increases from 0.97 to 2.38 along with a change of excitation position from the center to the side of MC. These observations suggest that the other luminescence ion doped in the NaYF4 MC particle might affect their luminescence property under the same measurement condition. Then, when the luminescence center is replaced with Er3+ ions, the special UC emission property of a single MC does not change as shown in Fig. 2a3, a4 and b3, b4. Obviously, the incident position-dependent emission patterns of the single NaYF4:Yb3+/(Tm3+ or Er3+) MC don't rely on a specific luminescence ion. Therefore, these results indicate that the luminescent patterns control and the red emission enhancement for a single MC can be obtained simultaneously by tuning the focal point position of the excitation laser, in which are based on the special structure and configuration of the single NaYF4:Yb3+/(Tm3+ or Er3+) MC.
To prove the unique luminescence phenomena dependent on the structure and configuration of the single MC, we consider that the especial-shaped β-NaYF4:Yb3+/Tm3+ MC is changed for β-NaYF4:Yb3+/Tm3+ microrod. Based on the same confocal microscopy detection system and measuring condition, the strong UC light outputs like white-blue torch from the endpoint of a single β-NaYF4:Yb3+/Tm3+ microrod when a laser beam vertically excites in the end or another end of the microrod as shown in the inset of Fig. 3A and C. While the excitation light locates on the middle of the microrod, a beautiful candy-shaped luminescence pattern appears in the body of the microrod [Fig. 3B]. Although the observed emission patterns of the single β-NaYF4:Yb3+/Tm3+ microrod is different for three excitation positions, the UC emission intensities are nearly invariable in three cases, as shown in Fig. 3. These demonstrate that the emission patterns except spectral shape and intensity from single β-NaYF4:Yb3+/Tm3+ microrod can be controlled via adjusting the position of the focused excitation laser beam.
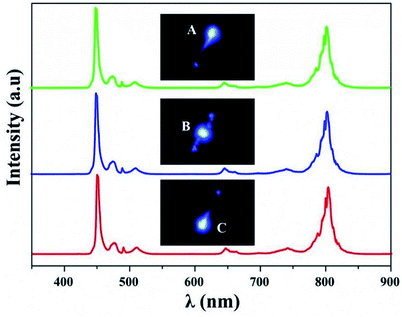 | ||
| Fig. 3 UC emission spectra and luminescence photos of a single β-NaYF4:Yb3+/Tm3+ microrod with 980 nm excitation. Note that each spectrum is normalized to its intensity at 450 nm. | ||
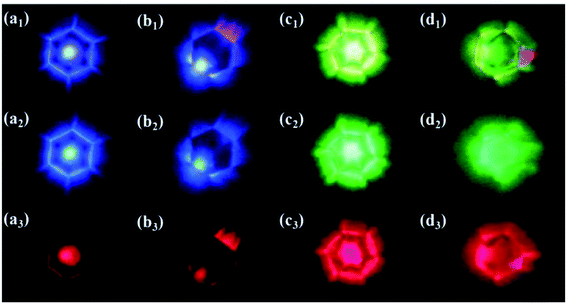
Therefore, the flower-like luminescence pattern and directional red emission pattern with a red emission enhancement depend on the geometry of the single NaYF4:Yb3+/(Tm3+ or Er3+) MC. Firstly, when the focal point position of the excitation laser is on the center of the single MC particle, the red emission doesn't seem existed according to the luminescence photographs of the blue or green flower-like emission pattern as shown in the Fig. 4a1 and c3. But the UC emission spectra present the result that the UC luminescence consists of blue (green) and red light as shown in the Fig. 2b1 and b3. To further clearly observe the spatial distribution of the UC luminescence, the individual blue (green) and red emission patterns of the single NaYF4:Yb3+/(Tm3+ or Er3+) MC particle through using filter are exhibited in Fig. 4a2, a3 and c2, c3, respectively. The optical images show that the blue (green) emission intensity is much larger than the red one. The distribution mechanism of UC luminescence color and intensity is interpreted by the scattering theory. When the NIR laser excites the NaYF4:Yb3+/(Tm3+ or Er3+) MC, the MC can emit two-color UC luminescence including blue (green) and red light. However, the scatter short-wavelength blue (green) light from the NaYF4 MC matrix is superior to the scatter long-wavelength red light according to the scattering theory. Therefore, we see the obvious blue (green) luminescence pattern via the camera though the red emission exists. The formation of the beautiful flower-like emission pattern stems from the internal light reflection and waveguide effect. The reflected light and transmitted ray include NIR excitation light and the UC emission light, in which are confined in the host material. Based on the structure characteristic of MC, it is noted that the observed flower-like pattern should be mainly resulted from total internal reflection effect. Hence, the reflected light in the matrix transmits radially to six edge sides of the MC particle forming the observed fascinating flower-like pattern.
In addition, when the focal point position of the excitation laser is adjusted on the side edge of the NaYF4:Yb3+/(Tm3+ or Er3+) MC particle, the luminescence patterns changed and the red emission enhanced relative to the blue (green) one is achieved. Considering the geometry and the light scattering effect of the particle, the spatial distribution of UC luminescence color is different from the first case. As the optical images shown in the Fig. 4b2, b3 and d2, d3, the blue (green) emission is mainly at the excitation point position and the red emission is at the symmetrical position of the MC particle by using the optical filters. In this case, the confining reflected light and transmitted ray together transmit along the edge lace of the MC particle via total internal reflection, resulting in an increase from the absorption of Yb3+ ions with increasing the optical path of the NIR excitation light in the MC media. In addition, the propagation process of the various rays would not only accompany with scatter effect, but also be incessantly repeated re-absorption and re-emitting processes, this leads to a large increase in the intensities ratio of the red to blue (green), and ultimately, a red flame-like pattern is formed in the side of particle.34 This finding reveals that the NaYF4:Yb3+/(Tm3+ or Er3+) MC particle based on the six smooth sides lace could acts as an active optical waveguide and presents a promising characteristic annular resonant microcavity for light propagation.
To further demonstrate the mechanisms of the luminescence patterns variation and red emission enhancement, the excitation power dependences of the UC luminescence intensity of the single β-NaYF4:Yb3+/(Tm3+ or Er3+) MC particle are separately analyzed for the two excitation positions. As shown in Fig. 5a, the R/B emission intensity ratios from the excitation position on the side of the single NaYF4:Yb3+/Tm3+ MC are much greater than the R/B ratios from the excitation position on the center of the particle with increase of the pump power. The R/G intensity ratios of the single NaYF4:Yb3+/Er3+ MC particle also present the similar results exhibited in Fig. 5b. These indicate that the excitation approach based on the waveguide effect could not obtain equivalent UC luminescence intensity with varying excitation power. However, the modulation of UC luminescence patterns and the enhancement of red light is still achieved by the confining propagation of light along the six sides lace around the MC particle and the redistributing intensity of light in space via the waveguiding.
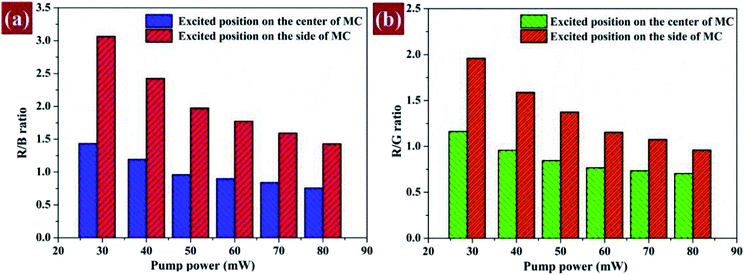 | ||
| Fig. 5 (a and b) The R/B and the R/G emission intensity ratios of the single β-NaYF4:Yb3+/Tm3+ MC and β-NaYF4:Yb3+/Er3+ MC with the increasing excitation power, respectively. | ||
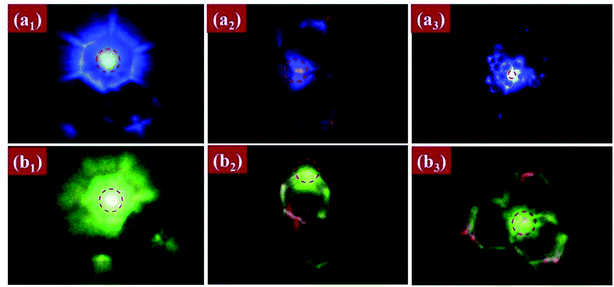
In fact, the luminescence patterns and intensities could be efficiently controlled by tuning the focal position of the excitation laser, in which is based on the optical waveguide effect. The optical effect is also adapted to the multiple β-NaYF4:Yb3+/(Tm3+ or Er3+) MCs. As shown in Fig. 6, the UC emission light can be propagated from the excitation point position to the symmetrical position of the excitation point along the sides lace of the MCs, and then transmitted from one MC particle to the other neighbored ones through the connecting edges in the system of multiple MCs, forming a lot of beautiful luminescence patterns. These findings can be widely used in anti-counterfeiting and optical barcoding based on a single MC system or three-dimensional color display.
4. Conclusions
In summary, we report some interesting phenomena that the UC luminescence patterns could be effectively controlled and the red emission intensities could be enhanced from a single β-NaYF4:Yb3+/(Tm3+ or Er3+) MC via tuning the excitation mode. When the focal point position of the excitation NIR laser is adjusted from the center to one side lace of the MC particle, the UC luminescence pattern would be transformed from blue or green flower-like emission pattern to the red flame-like irradiation pattern accompanied with a red luminescence enhancement. However, the luminescence properties are irrelevant to a specific luminescence center, they are sensitive to the crystal structure, excited position, pump power, and numbers. Their corresponding physical mechanism is explained by the optical waveguide effect based on the total reflection effect. We believe that the unique-structure micro/nano-crystal materials and excited mode would open a promising application in three-dimensional color display, optical waveguides and optical communication.Conflicts of interest
There are no conflicts to declare.Acknowledgements
This work is supported by the National Science Foundation of China (11604262), Shaanxi Provincial Research Plan for Young Scientific and Technological New Stars (Program No. 2015KJXX-40), the New Star Team of Xi'an University of Posts & Telecommunications, the Natural Science Basic Research Plan in Shaanxi Province of China (Grant No. 2018JM1052, 2018JQ1070), Natural Science Foundation of Shaanxi Provincial Department of Education (Grant No. 18JK0712), and the Open Research Fund of Key Laboratory of Spectral Imaging Technology, Chinese Academy of Sciences (LSIT201810D).References
- B. Zhou, B. Shi, D. Jin and X. Liu, Nat. Nanotechnol., 2015, 10, 924 CrossRef CAS PubMed.
- S. Wen, J. Zhou, K. Zheng, A. Bednarkiewicz, X. Liu and D. Jin, Nat. Commun., 2018, 9, 2415 CrossRef PubMed.
- Y. Hao, S. Lv, Z. Ma and J. Qiu, RSC Adv., 2018, 8, 12165–12172 RSC.
- L. D. Sun, H. Dong, P. Z. Zhang and C. H. Yan, Annu. Rev. Phys. Chem., 2015, 66, 619–642 CrossRef CAS PubMed.
- Z. Yin, H. Li, W. Xu, S. Cui, D. Zhou, X. Chen, Y. Zhu, G. Qin and H. Song, Adv. Mater., 2016, 28, 2518–2525 CrossRef CAS PubMed.
- D. Yang, Z. Hou, Z. Cheng, C. Li and J. Lin, Chem. Soc. Rev., 2015, 44, 1416–1448 RSC.
- S. T. Dibaba, R. Y. Wei, W. S. Xi, L. Zhao, L. Y. Shi, W. Ren, T. Mayrd and L. N. Sun, RSC Adv., 2018, 8, 35706–35718 RSC.
- M. Yang, J. Ren and R. Zhang, J. Alloys Compd., 2017, 714, 160–167 CrossRef CAS.
- T. Dilbeck, S. P. Hill and K. Hanson, J. Mater. Chem. A, 2017, 5, 11652–11660 RSC.
- M. Luoshan, L. Bai, C. Bu, X. Liu, Y. Zhu, K. Guo, R. Jiang, M. Li and X. Zhao, J. Power Sources, 2016, 307, 468–473 CrossRef CAS.
- W. Zheng, P. Huang, D. Tu, E. Ma, H. Zhu and X. Chen, Chem. Soc. Rev., 2015, 44, 1379–1415 RSC.
- P. Zhao, Y. Zhu, X. Yang, X. Jiang, J. Shen and C. Li, J. Mater. Chem. A, 2014, 2, 16523–16530 RSC.
- R. Deng, F. Qin, R. Chen, W. Huang, M. Hong and X. Liu, Nat. Nanotechnol., 2015, 10, 237 CrossRef CAS PubMed.
- X. Zhu, Q. Su, W. Feng and F. Li, Chem. Soc. Rev., 2017, 46, 1025–1039 RSC.
- D. Chen, M. Xu and P. Huang, Sens. Actuators, B, 2016, 231, 576–583 CrossRef CAS.
- Y. Liu, Y. Lu, X. Yang, X. Zheng, S. Wen, F. Wang, X. Vidal, J. Zhao, D. Liu and Z. Zhou, Nature, 2017, 543, 229 CrossRef CAS PubMed.
- B. Yang, Y. Wang, T. Wei, Y. Pan, E. Zhou, Z. Yuan, Y. Han, M. Li, X. Ling and L. Yin, Adv. Funct. Mater., 2018, 1801782 CrossRef.
- L. Tian, Y. Shang, S. Hao, Q. Han, T. Chen, W. Lv and C. Yang, Adv. Funct. Mater., 2018, 28, 1803946 CrossRef.
- W. You, D. Tu, W. Zheng, X. Shang, X. Song, S. Zhou, Y. Liu, R. Li and X. Chen, Nanoscale, 2018, 10, 11477–11484 RSC.
- C. Homann, L. Krukewitt, F. Frenzel, B. Grauel, C. Würth, U. Resch-Genger and M. Haase, Angew. Chem., Int. Ed., 2018, 57, 8765–8769 CrossRef CAS PubMed.
- L. Chen, Y. Rong, M. Ren, W. Wu, M. Qin, C. Pan, Q. Ma, S. Liu, B. Wu, E. Wu, J. Xu and H. Zeng, J. Phys. Chem. C, 2018, 122, 15666–15672 CrossRef CAS.
- J. Dong, Z. Zhang, H. Zheng and M. Sun, Nanophotonics, 2015, 4, 472–490 CAS.
- S. Schietinger, L. d. S. Menezes, B. r. Lauritzen and O. Benson, Nano Lett., 2009, 9, 2477–2481 CrossRef CAS PubMed.
- B. Chen, W. Kong, Y. Liu, Y. Lu, M. Li, X. Qiao, X. Fan and F. Wang, Angew. Chem., Int. Ed., 2017, 56, 10383–10387 CrossRef CAS PubMed.
- L. Yan, B. Zhou, N. Song, X. Liu, J. Huang, T. Wang, L. Tao and Q. Zhang, Nanoscale, 2018, 10, 17949–17957 RSC.
- T. Wang, H. Yu, C. K. Siu, J. Qiu, X. Xu and S. F. Yu, ACS Photonics, 2017, 4, 1539–1543 CrossRef CAS.
- C. X. Li, Z. W. Quan, J. Yang, P. P. Yang and J. Lin, Inorg. Chem., 2007, 46, 6329–6337 CrossRef CAS PubMed.
- A. Nadort, J. B. Zhao and E. M. Goldys, Nanoscale, 2016, 8, 13099–13130 RSC.
- M. Y. Ding, C. H. Lu, Li. H. Cao, Y. R. Ni and Z. Z. Xu, CrystEngComm, 2013, 15, 8366–8373 RSC.
- M. Law, D. J. Sirbuly, J. C. Johnson, J. Goldberger, R. J. Saykally and P. Yang, Science, 2004, 305, 1269–1273 CrossRef CAS PubMed.
- Y. Zhang, L. Zhang, R. Deng, J. Tian, Y. Zong, D. Jin and X. Liu, J. Am. Chem. Soc., 2014, 136, 4893–4896 CrossRef CAS PubMed.
- Q. Han, C. Zhang, C. Wang, Z. Wang, C. Li, W. Gao, J. Dong, E. He, Z. Zhang and H. Zheng, Sci. Rep., 2017, 7, 5371 CrossRef PubMed.
- W. Gao, H. Zheng, Q. Han, E. He and R. Wang, CrystEngComm, 2014, 16, 6697–6706 RSC.
- J. Xu, X. Zhuang, P. Guo, Q. Zhang, W. Huang, Q. Wan, W. Hu, X. Wang, X. Zhu and C. Fan, Nano Lett., 2012, 12, 5003–5007 CrossRef CAS PubMed.
| This journal is © The Royal Society of Chemistry 2019 |

