 Open Access Article
A “weak acid and weak base” type fluorescent probe for sensing pH: mechanism and application in living cells†
Chunpeng Jiaoabcd,
Jingxiang Pange,
Li Shen*fg,
Wenjuan Luabcd,
Pingping Zhangabcd,
Yuanyuan Liuabcd,
Jing Liabcd,
Xianhui Jiaabcd and
Yanfeng Wang *abcd
*abcd
aSchool of Medicine and Life Sciences, University of Jinan-Shandong Academy of Medical Sciences, Jinan 250200, Shandong, China. E-mail: wyfshiwoya@126.com
bInstitute of Materia Medica, Shandong Academy of Medical Sciences, Jinan 250062, Shandong, China
cKey Laboratory for Biotech-Drugs Ministry of Health, Jinan 250062, Shandong, China
dKey Laboratory for Rare & Uncommon Diseases of Shandong Province, Jinan 250062, Shandong, China
eShandong Medicinal Biotechnology Center, Shandong Academy of Medical Sciences, Jinan, 250062, Shandong, China
fCollege of Science, China University of Petroleum (East China), Qingdao, 266580, Shandong, China
gCollege of Chemical Engineering and Environmental Chemistry, Weifang University, Weifang, 261061, China
First published on 4th July 2019
Abstract
A simple pH fluorescent probe, N-(6-morpholino-1, 3-dioxo-1H-benzo[de]isoquinolin-2(3H)-yl) isonicotinamide (NDI), based on naphthalimide as the fluorophore and isonicotinic acid hydrazide as the reaction site was synthesized and characterized. It is useful for monitoring acidic and alkaline pH. The results of pH titration indicated that NDI exhibits obvious emission enhancement with a pKa of 4.50 and linear response to small pH fluctuations within the acidic range of 3.00–6.50. Interestingly, NDI also displayed strong pH-dependent characteristics with pKa 9.34 and linearly responded to an alkaline range of 8.30–10.50. The sensing response mechanism was confirmed by 1H NMR and ESI-MS spectroscopy. The mechanism of the optical responses of NDI toward pH was also determined by density functional theory (DFT) calculations. In addition, NDI displayed a highly selective and sensitive response to hydrogen ions and hydroxyl ions. The probe was successfully applied to image acidic and alkaline pH value fluctuations in HeLa cells and has lysosomal targeting ability.
1. Introduction
Intracellular pH (pHi) plays a vital role in cellular events, such as ion transport, muscle contraction, multidrug resistance, calcium regulation, cell growth, and apoptosis.1–4 Abnormal pHi values cause many common diseases, including neurodegenerative disorders, cystic fibrosis, Alzheimer's disease, and cancer.5–7 In distinct prokaryotic species and diverse subcellular compartments of eukaryotic cells, pHi values can range from highly acidic to basic.8,9 Under abnormal acid–base conditions, channel proteins, transporters, and signaling pathway proteins on the cell membrane lose their normal functions.10 In addition, an abnormal acid–base environment neutralizes or degrades functional groups of alkaline/acidic proteins, leading to irreversible changes. Consequently, sensing and monitoring pHi fluctuations is critical for studying cellular functions, understanding physiology and exploring cellular metabolisms.11A variety of techniques including nuclear magnetic resonance, HPLC-MS acid–base indicator titration, absorption spectroscopy, and electrochemistry have been reported to measure pH values.12–15 An optical probe, especially a fluorescent probe, is one of the most powerful tools for detecting pH in cells for its advantages of simple operation, high sensitivity, and temporal resolution.16–18 Many pH fluorescent probes have been designed. There are two classes of synthetic pH probes – one for acidic organelles (such as, lysosomes) functioning in the pH range of 4.00–6.00, and another for cytosol that works in the pH range 6.80–7.40.19,20 However, studies on both extremely acidic pH probes (pH < 4.00) and extremely basic pH probes (pH > 8.00) are rare and mostly single regions.21,22 It is difficult for most organisms to survive under highly acidic or alkaline conditions,23 but a large number of microorganisms, such as acidophilus and Helicobacter pylori,24–26 prefer harsh environments.27,28 Therefore, it is of great significance for medical rehabilitation to detect the pH value of lesion location as soon as possible and accurately administer drugs to kill bacteria. There is a lack of effective means to detect the pH in pathological tissue under such extreme acidic and alkaline conditions,29 and most are detected in a single range.8,10,30
1,8-Naphthalimide derivatives exhibit high luminescence efficiency, excellent photostability, large stock shift, and easy modification of the molecular structure. Additionally, NDI derivatives show excellent environmental sensitivity and a strong internal charge transfer (ICT) character.31–33 Therefore, they have great potential for developing fluorescent probes.34–37 Here, we report a 1,8-naphthalimide derivative, Naphthalimide-isoniazid hybrid NDI as a new pH-sensitive probe with a suitable pKa1 (4.50) and pKa2 (9.34) for biosystem investigation. This probe can respond to an acidic pH range from 3.00 to 6.50 and an alkaline pH range from 8.30 to 10.50 with an excellent linear relationship. This probe can monitor pH changes at extreme acidity and alkalinity without interference of metal ions and bioactive molecules, which make it highly desirable as a fluorescent probe for reliable and sensitive fluorescence detection. Furthermore, the NDI was applied to fluorescent imaging in living cells, which indicates that the probe can noninvasively image acidic and alkaline pH value fluctuations in biological systems.
2. Experimental section
2.1 Materials and instruments
6-Morpholinobenzo[de]isochromene-1,3-dione (1) was prepared according to references.38,39 All reactions were magnetically stirred under a nitrogen atmosphere and monitored by thin-layer chromatography (TLC). All solvents and chemicals were purchased from commercial sources and used without further purification unless otherwise stated.1H NMR and 13C NMR spectra were measured on a Bruker Avance 400 (400 MHz) spectrometer using DMSO-d6 as a solvent and tetramethylsilance (TMS) as an internal standard. Electrospray ionization (ESI) mass spectra were measured with an LC-MS 2010A (Shimadzu) instrument. Absorption and fluorescent spectra were measured by using TU-1901 (Beijing Purkinje General Instrument Co., Ltd.) and F-280 (Tianjin Gangdong Technology Co., Ltd.). A pH meter (Mettler Toledo, Switzerland) was used to determine the pH. The cell imaging experiments were carried out by using a Confocal Scanning Microscope (Olympus, LV3000).
2.2 Synthesis of the NDI probe
6-morpholinobenzo[de]isochromene-1,3-dione (1) (284 mg, 1 mmol) and isonicotinic acid hydrazide (164.4 mg, 1.2 mmol) were mixed in 10 mL DMF and refluxed for 11 h. Then the probe was purified by silica-gel column chromatograph (CH2Cl2/MeOH = 50/1, v/v) as a yellow solid (352 mg, 88%, Scheme 1). 1H NMR (400 MHz, DMSO-d6, δ/ppm): 11.62 (s, 1H), 8.86 (dd, J = 4.6, 1.4, 2H), 8.58 (t, J = 7.8, 2H), 8.49 (d, J = 8.1, 1H), 7.90 (dd, J = 4.7, 1.5, 3H), 7.42 (d, J = 8.2, 1H), 3.96–3.89 (m, 4H), 3.31–3.26 (m, 4H) ppm; 13C NMR (75 MHz, DMSO-d6) δ/ppm: 164.24, 162.21, 161.64, 156.81, 151.16, 139.06, 133.65, 132.11, 129.62, 126.82, 125.90, 122.53, 121.91, 115.79, 115.38, 66.59, 53.48 ppm. ESI-HRMS (C22H18N4O4): calculated [M + H]+: 403.1406, obtained: 403.1390.2.3 General procedure for spectral measurements
A stock solution of NDI (10−4 M) was prepared in DMSO and the solution for spectroscopic determination was obtained by diluting the stock solution to 10−5 M in a DMSO/PBS (phosphate buffer saline) (1/4, v/v) system. In the pH titration experiment, the pH of the solution was slightly changed by adding a minimum volume of HCl (1.0 M) or NaOH (1.0 M). The excitation wavelength was 400 nm. The resulting solution was well mixed and kept at room temperature for 30 min before recording its absorption and fluorescent spectra. Metal cations and anions were prepared in distilled water for selective testing. Reactive oxygen species and reactive nitrogen species were prepared in phosphate buffer saline.2.4 Cell culture and fluorescent imaging
HeLa cells were inoculated in a 24-well flat plate and then cultured in an atmosphere of 5% CO2 and 95% air in Dulbecco's modified Eagle's medium (DMEM, Invitrogen) at 37 °C for 24–36 h to reach 80–90% seeding efficiency. Some HeLa cells were treated with the NDI (10 μM concentration) at 37 °C for 30 min, followed by washing three times with PBS buffer. Another portion of HeLa cells were pretreated with 10 μM the NDI in culture media for 30 min at 37 °C, and further incubated in PBS at pH 11.00, 8.00, 6.00, and 3.00 for another 10 min at 37 °C. Fluorescent images were observed under a confocal microscope (Olympus LV3000).2.5 Cytotoxicity assay
The methyl thiazolyl tetrazolium (MTT) assay was used to measure the cytotoxicity of NDI in HeLa cells. HeLa cells were seeded into a 96-well cell-culture plate in culture media (DMEM). Various concentrations (5, 10, 20, 30 μM) of NDI were added to the wells. HeLa cells were cultured in an atmosphere of 5% CO2 and 95% air at 37 °C. 10 mL MTT (5 mg mL−1) was added to each well and incubated at 37 °C under 5% CO2 for 4 h. The supernatant from the orifice plate was aspirated, 150 microliters of DMSO were added, and shaken with a shaker. The absorption wavelength was measured by an enzyme labelling apparatus (Synergy HT) at 490 nm.| Cell viability (%) = (mean of absorbance value of treatment group)/(mean of absorbance value of control group). |
3. Results and discussion
As shown in Scheme 1, target probe molecules (NDI) were synthesized by simple and efficient amide condensation reaction of compound 1 and isoniazid with a yield of 88%. The structure of the probe was characterized by 1H NMR, 13C NMR and HRMS spectra (Fig. S1–S4†).3.1 Investigation of absorption properties of NDI
All fluorescent and absorption samples were done in aqueous solution (4![[thin space (1/6-em)]](https://www.rsc.org/images/entities/char_2009.gif) :
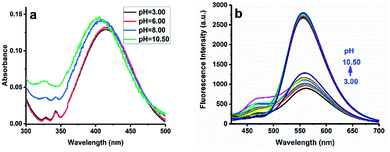
:![[thin space (1/6-em)]](https://www.rsc.org/images/entities/char_2009.gif) 1, PBS buffer/DMSO, v/v) and left for 30 min before measurement. To check the pH response of NDI, acid–base titration was carried out in a PBS buffer–DMSO solution. As shown in Fig. 1a, there was one maximum absorption peak around 415 nm and a side peak at 345 nm under acidic conditions (pH < 6). When pH values gradually changed from 6.00 to 11.00, the maximum absorption peak moved from 415 nm to 401 nm. The blue shift of the absorption spectrum with an increase of pH value can be explained as the change of ICT under basic and acidic conditions.
1, PBS buffer/DMSO, v/v) and left for 30 min before measurement. To check the pH response of NDI, acid–base titration was carried out in a PBS buffer–DMSO solution. As shown in Fig. 1a, there was one maximum absorption peak around 415 nm and a side peak at 345 nm under acidic conditions (pH < 6). When pH values gradually changed from 6.00 to 11.00, the maximum absorption peak moved from 415 nm to 401 nm. The blue shift of the absorption spectrum with an increase of pH value can be explained as the change of ICT under basic and acidic conditions.
3.2 Fluorescent properties of NDI
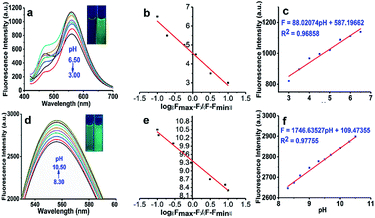
The fluorescent pH titration of the NDI is shown in Fig. 1b and 2. The NDI showed the main emission band at 561 nm. When the pH value changed from 3.00 to 6.50, the fluorescent intensity at 561 nm linearly increased. But when the solution changed from acidic to basic, that is from 6.50 to 8.30, the fluorescent intensity rapidly increased, and there was no linear relationship between fluorescent intensity and the pH value. When the pH value increased from 8.30 to 10.50, the emission band at 561 nm of the probe again linearly increased. Under acidic conditions, the lone pair electron of the nitrogen atom on the pyridine group bind to hydrogen protons, and the electron-withdrawing was increased with the fluorescent intensity of the NDI decreased. Under alkaline conditions, the hydroxyl group of enol isomer loses hydrogen proton to form oxygen anion, then the lone pair electron on the oxygen anion produces the ICT effect on the naphthalimide ring and enhance the fluorescence. Moreover, with the increase of pH value, the fluorescence intensity was further enhanced. The process of the protonation is shown in Fig. 4a.The pKa value of the probe NDI was determined in PBS/DMSO (4/1). In Fig. 2a and d, we can see that the fluorescence intensity strengthen as the pH value increased (emission wavelength 561 nm). In Fig. 2c and f, where the X axis represents the pH value and the Y axis represents the fluorescent intensity. According to the Henderson–Hasselbalch-type mass action equation (log[(Fmax – F)/(F – Fmin)] = pKa – pH, where F is the fluorescent emission intensity at 561 nm), we calculated that the pKa was 4.50 and 9.34, which are valuable for studying acidic organelles. As shown in Fig. 2c and f, when the pH was in the range of 3.00–6.50 and 8.30–10.50, the fluorescent intensity and pH can be described by a perfect linear regression relationship (2b: R2 = 0.96858; 3b: R2 = 0.97755).
In Fig. 2b, the linear regression relationship between the pH value (3.00–6.50) and “log[(Fmax – Fx)/(Fx – Fmin)]” is shown. It can be described by the following formula with R2 = 0.96833.
| pH = 4.56343 − 1.69702X |
In Fig. 2e, the linear regression relationship between the pH value (8.30–10.50) and “log[(Fmax – Fx)/(Fx – Fmin)]” is shown. It can be described by the following formula with R2 = 0.96641.
| pH = 9.36864 − 1.06211X |
In the formula, X is “log[(Fmax – Fx)/(Fx – Fmin)]”. The formula can be used to calculate the pH value of samples in the range of 3.00–6.50 and 8.30–10.50.
3.3 Reversibility and selectivity studies
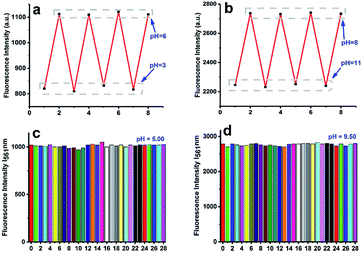
In order to check whether the pH-dependent fluorescent intensity of NDI is reversible, the pH of the solution was adjusted back and forth in the range from 3.00–6.00 and 8.00–11.00 with concentrated hydrochloric acid and sodium hydroxide solution. As shown in Fig. 3a and b, the results clearly showed that these processes were reversible. Due to the complex intracellular environment, various biomolecules and ions in the cell may affect the accuracy of the pH determination. In order to eliminate the interference of other ions to the test, we also studied the fluorescent intensity of probes in the presence of some anions, physiological ubiquitous metal cations, RNS, and ROS (F− (10 mM), Br− (10 mM), NO3− (10 mM), NO2− (10 mM), N3− (10 mM), SO32− (10 mM), Na+ (10 mM), Al3+ (10 mM), Ca2+ (10 mM), Cr3+ (10 mM), Co2+ (10 mM), Fe2+ (10 mM), Fe3+ (10 mM), Mn2+ (10 mM), Ni2+ (10 mM), Pb2+ (10 mM), Zn2+ (10 mM), Cu2+ (10 mM), Ag+ (10 mM), H2O2 (10 mM), NO (20 mM), ONOO− (10 mM), O2 (20 mM), ClO− (10 mM), ·OH (20 mM), and T-Buoo− (10 mM)) at pH 5.00 and 9.50 (Fig. 3c and d). The salts used in the stock solutions of ions were NaF, NaBr, NaNO3, NaNO2, NaN3, Na2SO3, AlCl3, CaCl2, CrCl3, CoCl2, FeSO4, FeCl3, MnSO4, NiSO4, Pb(NO3)2, ZnSO4, CuSO4 and AgNO3. The results showed that the probe can be used for pH detection without interference from other factors. Meanwhile, according to the time response results at different pH values (Fig. S5†), the probe has the advantage of fast response speed and can quickly obtain the pH of the detection system.3.4 Possible sensing mechanism
To explore the mechanism of probe NDI, we measured the 1H NMR spectra of NDI in DMSO-d6 before and after the addition of hydrochloric acid or sodium hydroxide. As illustrated in Fig. 4b, when hydrochloric acid was added to the NDI solution in DMSO-d6, the proton signals (H-(b 1, 2), at δ 8.86 and H-(a 1, 2), at δ 7.89) were dramatically shifted to δ 9.07 and 8.29. This is because the hydrogen ion binds to the nitrogen on the pyridine group. Under the action of a strong base, the active hydrogen disappeared and the chemical displacement method of the proton signals (H-(b 1, 2), at δ 8.86) were dramatically shifted to δ 8.56. This is because the isomerization of the amide occurs after the hydrogen on the amide is removed, forming a conjugated system. Signals for the protons on naphthalene imide ring in the NMR spectra did not change a lot in acid, neutral, and alkaline conditions, suggesting that the protonation occurred on pyridine nitrogen, not on morpholine nitrogen.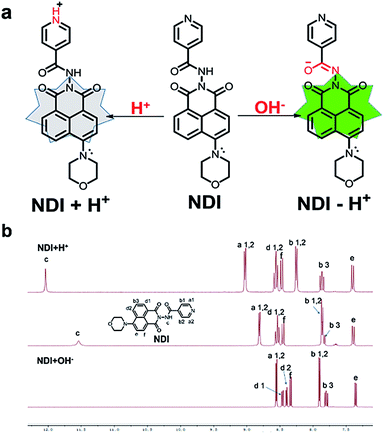 | ||
| Fig. 4 (a) Proposed mechanism for discriminative detection of H+ and OH−. (b) Partial 1H NMR spectra of NDI in DMSO-d6 before and after the addition of hydrochloric acid or sodium hydroxide. | ||
According to the above results, we believe that pyridine attached to isoniazid at the other end of naphthalimide can act as an electron-withdrawing group, and pyridine nitrogen atom has lone pair electrons and can be protonated easily under acid condition, and thus enhance its electron withdrawing ability. This reduces the electron cloud density and thus leads to fluorescence reduced of naphthalimide. With the further decrease of the acidity of the system, the electron withdrawing capacity of pyridine was enhanced and the fluorescence intensity of NDI was further weakened. However, under alkaline conditions, the protonation of pyridine nitrogen disappeared, the electron absorption ability was weakened, the fluorescence of NDI was enhanced. Enol isomer of the linker was deprotonation forms conjugated structure between naphthalimide and isonicotinamide, this electro-rich anion will further increase the electron cloud density of the naphthalimide ring and enhanced the fluorescence of NDI.
3.5 Density functional theory calculations
To gain deeper understanding of the photophysical character of the NDI probe, we have calculated the electronic structures of NDI in the ground state (S0) under acid, neutral, and alkaline conditions, respectively (Fig. 5 and Table S1†). The geometries of ground state (S0) were optimized using B3LYP method in combination with the 6-31G* basis set, including the solvent effect of DMSO by the polarizable continuum model (PCM) and no imaginary frequency was found. The vertical excitation energies of Sn were calculated using time-dependent density functional theory (TD-DFT) with the same method and basis set. All the calculations were performed with the Gaussian09 Programs.40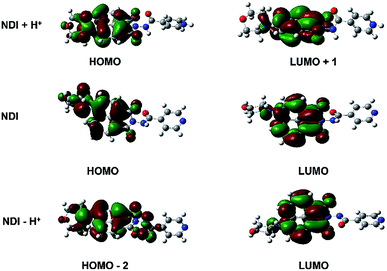 | ||
| Fig. 5 Electron density distribution of the frontier molecular orbitals of NDI in acid, neutral, and alkaline conditions. | ||
In the neutral form, the HOMO and LUMO are both localized on the morpholine and naphthalimide units, respectively. The electronic transition from S0 to S1 (with composition of HOMO–LUMO) shows the largest oscillator strength. The calculated excitation energy is 3.00 eV (413 nm), which is agreement with the experimental result (3.02 eV, 410 nm). However, under the acid conditions, the electronic excitation with the largest oscillator corresponds to the transition from S0 to S2, with a small red-shift of 3 nm compared to that under the neutral form, because of the increased electron-withdrawing ability of the protonated nitrogen atom on pyridine. The main contribution of S0–S2 can be ascribed to the transition from HOMO to LUMO+1. The HOMO of [NDI + H+] locates on morpholine and naphthalimide units while LUMO+1 mainly locates on naphthalimide unit. It indicates that the electronic transition of S0–S2 shows intramolecular charge-transfer character. This is also the situation of NDI under alkaline conditions [NDI − H+]. The maximum absorption peak shows a lager blue-shift of around 20 nm, which corresponds to the electronic transition of S0 to S3 (with composition of HOMO−2 to LUMO). HOMO−2 is distributed on morpholine, naphthalimide and enol isomer units, while LUMO is distributed on naphthalimide and N atom of morpholine. It can be concluded that the electronic transitions of maximum absorption all show charge-transfer character under acid, neutral and alkaline conditions.
3.6 Cytotoxicity of the fluorescent probes and fluorescent imaging
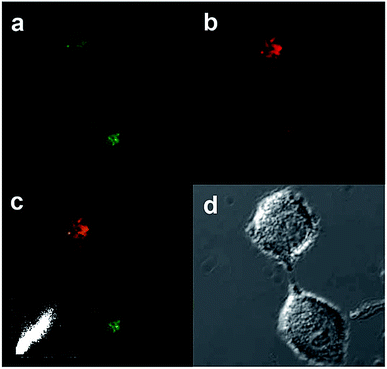
In order to evaluate the applicability of the NDI probe in pH monitoring of living cells, images of living cells were studied. First, an MTT assay with a HeLa cell line was used to determine the cytotoxicity of DNI. In Fig. S6,† the cellular viability was estimated to be greater than 80% after 24 h, which indicates that NDI (≤30 μM) has low cytotoxicity. In addition, cell images were obtained using a confocal fluorescence microscope. We measured HeLa cells incubated with the NDI probe at pH 3.0, 6.0, 8.0, and 11.0 (Fig. 6). The experimental results showed that the probe has good working performance in biological systems in acidic environments. In addition, HeLa cells were incubated with the 10 μM NDI probe for 60 s, and the fluorescent changes in the cells were observed (Fig. 7). After 60 s, the fluorescent intensity reached a maximum. In order to study the intrinsic ability of NDI to lysosomes in live HeLa cells, NDI (10 μM) was further co-stained with commercial Lyso-Tracker Red DND-99 (2.0 μM) for 30 min. Imaging results showed that the green image of the NDI channel obtained at 480 nm excitation was almost the same as the red image of the Lyso-Tracker Red DND-99 channel obtained at 577 nm excitation (Fig. 8). The overlap between the fluorescent images of NDI and Lyso-Tracker Red DND-99 revealed that Pearson's correction factor was 0.72, indicating that NDI can target lysosomes.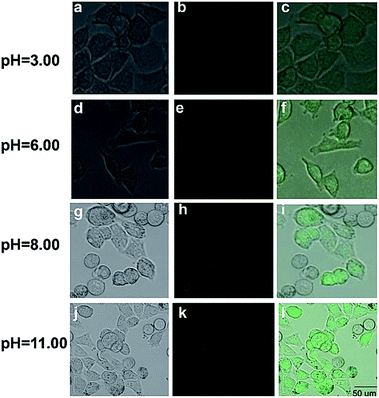 | ||
| Fig. 6 Fluorescent images of HeLa cells incubated with the 10 μM fluorescent NDI probe at different pH values (3.00, 6.00, 8.00, and 11.00). | ||
 | ||
| Fig. 7 Fluorescent images of HeLa cells incubated with the 10 μM fluorescent NDI probe at pH 11.00 at different times (20 s, 40 s, 60 s, and 120 s). | ||
4. Conclusions
A simple novel fluorescent probe NDI with lysosomal targeting ability was designed to detect pH values. pH titrations indicated that NDI has a remarkable emission enhancement with a pKa of 4.50 and linearly responded to small pH fluctuations within the acid range of 3.00–6.50. Interestingly, NDI also exhibited a strong pH dependence with pKa 9.34 and a linear response to the extreme alkalinity range of 8.30–10.50. After dynamic fluorescent imaging experiments, it was determined that the probe has good membrane permeability, and it was further successfully applied to the monitoring of pH changes in living cells. The response mechanism of the fluorescent probe to the pH value depends on the push–pull electronic capacity of isoniazid. In addition, the probe has the advantages of high selectivity, high sensitivity, high reversibility, and good membrane permeability. It is expected that NDI will be an effective tool for studying major biological processes at the tissue and organism level.Conflicts of interest
There are no conflicts to declare.Acknowledgements
This work was supported by the National Natural Science Foundation of China (No. 21606147 and 21305079), the Academy of Science and Technology Project of Shandong Academy of Medical Sciences (No. 2017-55, 2018-19), key projects of industrial science and technology plan in Qiannan prefecture (2017) 11, project of the Haixi Science and Technology Bureau of Qinghai Province 2017-Q4. Thanks to Dr Edward C. Mignot, Shandong University, for linguistic advice.Notes and references
- D. Alvaro, W. K. Cho, A. Mennone and J. L. Boyer, J. Clin. Invest., 1993, 92, 1314–1325 CrossRef CAS PubMed
.
- E. S. Akinboye, M. D. Rosen, S. R. Denmeade, K. A. Bernard and B. Oladapo, J. Med. Chem., 2012, 55, 7450–7459 CrossRef CAS PubMed
.
- S. G. Anema and Y. Li, Food Chem., 2015, 174, 339–347 CrossRef CAS PubMed
.
- J. Chao, H. Wang, Y. Zhang, C. Yin, F. Huo, K. Song, Z. Li, T. Zhang and Y. Zhao, Talanta, 2017, 174, 468–476 CrossRef CAS PubMed
.
- N. I. Georgiev, B. Rayna, T. Rumiana, U. Iva, D. Christophe, M. Stoyan, A. M. Asiri, A. H. Qusti and V. B. Bojinov, Bioorg. Med. Chem., 2013, 21, 6292–6302 CrossRef CAS PubMed
.
- A. Serafino, N. Moroni, R. Psaila, M. Zonfrillo, F. Andreola, F. Wannenes, L. Mercuri, G. Rasi and P. Pierimarchi, Biochim. Biophys. Acta, Mol. Basis Dis., 2012, 1822, 1004–1018 CrossRef CAS PubMed
.
- Z. Zongren and A. Samuel, Org. Lett., 2004, 6, 2067–2070 CrossRef PubMed
.
- J. B. Chao, H. J. Wang, Y. B. Zhang, Z. Q. Li, Y. H. Liu, F. J. Huo, C. X. Yin, Y. W. Shi and J. J. Wang, Anal. Chim. Acta, 2017, 975, 52–60 CrossRef CAS PubMed
.
- X. Chen, H. Xu, S. Ma, H. Tong, K. Lou and W. Wang, RSC Adv., 2018, 8, 13388–13392 RSC
.
- B. Lin, L. Fan, J. Ge, W. Zhang, C. Zhang, C. Dong and S. Shuang, Analyst, 2018, 143, 5054–5060 RSC
.
- S. Xia, J. Wang, J. Bi, X. Wang, M. Fang, T. Phillips, A. May, N. Conner, M. Tanasova and F. T. Luo, Sens. Actuators, B, 2018, 265, 699–708 CrossRef CAS PubMed
.
- X. Yang, L. He, K. Xu, Y. Yang and W. Lin, Anal. Methods, 2018, 10, 2963–2967 RSC
.
- H. Yu, G. Li, B. Zhang, X. Zhang, Y. Xiao, J. Wang and Y. Song, Dyes Pigm., 2016, 133, 93–99 CrossRef CAS
.
- E. Köhler and K. Greeff, Res. Exp. Med., 1972, 159, 65–74 CrossRef
.
- X. Zhang, G. J. Song, X. J. Cao, J. T. Liu and B. X. Zhao, RSC Adv., 2015, 5, 89827–89832 RSC
.
- M. Zhu, P. Xing, Y. Zhou, G. Lei, J. Zhang, D. Qi, Y. Bian, H. Du and J. Jiang, J. Mater. Chem. B, 2018, 6, 4422–4426 RSC
.
- M. Wang, X. Cai, J. Yang, C. Wang, L. Tong, J. Xiao and L. Li, ACS Appl. Mater. Interfaces, 2018, 10, 41003–41011 CrossRef CAS PubMed
.
- A. Sorensen, B. Rasmussen, S. Agarwal, M. Schau-Magnussen, T. I. Solling and M. Pittelkow, Angew. Chem., Int. Ed. Engl., 2013, 52, 1–5 CrossRef
.
- C. Xu, R.-J. Song, P. Lu, J.-C. Chen, Y.-Q. Zhou, G. Shen, M.-J. Jiang and W. Zhang, Int. J. Nanomed., 2018, 13, 7229–7249 CrossRef PubMed
.
- G. Bartwal, K. Aggarwal and J. M. Khurana, J. Hazard. Mater., 2018, 360, 51–61 CrossRef CAS PubMed
.
- P. H. Donnan, P. D. Ngo and S. O. Mansoorabadi, Biochemistry, 2017, 57, 295–299 CrossRef PubMed
.
- H. H. Ho, R. Swennen, V. Cappuyns, E. Vassilieva, T. Van Gerven and T. V. Tran, Sci. Total Environ., 2012, 435–436, 487–498 CrossRef CAS PubMed
.
- I. Andrea, V. B. Alexis and R. Francesco, J. Am. Chem. Soc., 2014, 136, 5836–5839 CrossRef PubMed
.
- Y. Zhendong, T. Anthony Yiu-Yan, W. Keith Man-Chung, T. Chi-Hang, L. Bao, P. Chun-Ting, W. Lixin and Y. Vivian Wing-Wah, Dalton Trans., 2012, 41, 11340–11350 RSC
.
- X. X. Zhang, Z. Wang, X. Yue, Y. Ma, D. O. Kiesewetter and X. Chen, Mol. Pharm., 2013, 10, 1910–1917 CrossRef CAS PubMed
.
- M. Oja and U. Maran, Eur. J. Pharm. Sci., 2018, 123, 429–440 CrossRef CAS PubMed
.
- Q. Jing, L. Daying, L. Xiaoyan, G. Shiquan, S. Fengli, C. Hexi, H. Huarui and Y. Guangming, Anal. Chem., 2015, 87, 5897–5904 CrossRef PubMed
.
- W. Shi, X. Li and H. Ma, Methods Appl. Fluoresc., 2014, 2, 042001–0420014 CrossRef CAS PubMed
.
- M. Yang, Y. Song, Z. Meng, S. Lin, Z. Hao, L. Yuan, D. Zhang and R. C. Peng, Angew. Chem., 2012, 124, 7794–7799 CrossRef
.
- Y. Ge, A. Liu, D. Jian, G. Duan, X. Cao and F. Li, Sens. Actuators, B, 2017, 247, 46–52 CrossRef CAS
.
- M. Dangalov, S. Yordanova, M. Stoyanova, D. Cheshmedzhieva, P. Petrov and S. Stoyanov, J. Mol. Struct., 2016, 1125, 705–713 CrossRef CAS
.
- S. S. Mati, S. Chall, S. Rakshit and S. C. Bhattacharya, J. Fluoresc., 2015, 25, 341–353 CrossRef CAS PubMed
.
- P. A. Panchenko, O. A. Fedorova and V. F. Yu, Russ. Chem. Rev., 2014, 83, 155–182 CrossRef
.
- A. Saini and N. Kaur, Sens. Actuators, B, 2016, 234, 602–608 CrossRef CAS
.
- S. M. Dimov, N. I. Georgiev, A. M. Asiri and V. B. Bojinov, J. Fluoresc., 2014, 24, 1621–1628 CrossRef CAS PubMed
.
- S. O. Aderinto, Z. Han, H. Wu, C. Chen, J. Zhang, H. Peng, Z. Yang and W. Fei, Color. Technol., 2016, 133, 40–49 Search PubMed
.
- N. V. Marinova, N. I. Georgiev and V. B. Bojinov, J. Photochem. Photobiol., A, 2013, 254, 54–61 CrossRef CAS
.
- C. Y. Li, Y. Zhou, Y. F. Li, C. X. Zou and X. F. Kong, Sens. Actuators, B, 2013, 186, 360–366 CrossRef CAS
.
- L. Song, X. D. Sun, Y. Ge, Y. H. Yao, J. Shen, W. B. Zhang and J. H. Qian, Chin. Chem. Lett., 2016, 27, 1776–1780 CrossRef CAS
.
- F. Yu, Y. Wang, W. Zhu, Y. Huang, M. Yang, H. Ai and Z. Lu, RSC Adv., 2014, 4, 36849–36853 RSC
.
Footnote |
| † Electronic supplementary information (ESI) available. See DOI: 10.1039/c9ra03203g |
| This journal is © The Royal Society of Chemistry 2019 |


