 Open Access Article
Improvement of self-cleaning waterborne polyurethane-acrylate with cationic TiO2/reduced graphene oxide†
Gang Chen,
Si Ouyang,
Yiqing Deng,
Mengxiao Chen,
Yanqing Zhao,
Wangcai Zou and
Qiang Zhao *
*
School of Chemical Engineering, Sichuan University, Chengdu, Sichuan 610065, P. R. China. E-mail: zhaoqiang@scu.edu.cn
First published on 13th June 2019
Abstract
UV curable waterborne polyurethane acrylate (WPUA) with surfactant-modified TiO2/reduced graphene oxide (TiO2/rGO) nanocomposites were prepared and analyzed to improve their mechanical performance and self-cleaning ability. TiO2/rGO nanocomposites were prepared by a simple hydrothermal method with nano-TiO2 and graphene oxide, and modified with cationic surfactant (CTAB) to obtain a cationic TiO2/rGO (C-TiO2/rGO). Then, the obtained C-TiO2/rGO was incorporated into anionic waterborne polyurethane acrylate by in situ fabrication to obtain a composite emulsion (C-TiO2/rGO-WPUA). The results of Fourier transform infrared spectroscopy (FTIR), X-ray diffraction (XRD), and scanning electron microscopy (SEM) showed that CTAB was successfully intercalated into TiO2/rGO, and TiO2 nanoparticles were evenly distributed on graphene sheets with good dispersibility. Compared to UV-cured neat WPUA and C-TiO2/rGO-WPUA, the mechanical properties and thermal stability of the composites were significantly improved. When the content of C-TiO2/rGO was 0.5%, the UV-cured composites had overall excellent performance. In particular, the WPUA composites exhibited good self-cleaning ability in photocatalysis. The photocatalytic degradation rate of methyl orange in 0.5% C-TiO2/rGO-WPUA reached 88.3% under 6 h visible light irradiation.
1. Introduction
The design and preparation of eco-friendly polymer materials that exhibit high performance are still a grand challenge for researchers worldwide. In recent years, waterborne polyurethane (WPU) has wide applications in coatings, adhesives, primers, coating additives, textiles and biomaterials due to its environmental friendliness and excellent properties.1–4 However, compared with traditional solvent-based polyurethanes, waterborne polyurethanes still have shortcomings in their properties, such as poor water resistance and generally low mechanical properties.5 UV light curing technology could be an effective way to improve the performance of waterborne polyurethane. The polyurethane prepolymer can be cured under ultraviolet light by introducing ultraviolet reactive monomers into the molecule chains. After treatment with UV radiation at room temperature, the mechanical properties of waterborne polyurethane acrylate (WPUA) are effectively improved.6–9 Although the performance of the waterborne polyurethane has a certain improvement after UV-curing, it still cannot meet the expected requirements. In this case, the above problem can be effectively improved by introducing a nanofiller into the waterborne polyurethane system. At present, nanofiller-polymer composites have shown great potential for application in electrocatalysts, biomaterials, and high performance materials.10–12Nano-TiO2 is a highly efficient photocatalyst. Since nano-TiO2 was first used for photocatalytic decomposition of water in 1972, it has been widely used in the fields of photocatalysis, photolysis of water and solar cells in the past few decades due to its low cost, non-toxicity and high stability.13–16 As a widely used inorganic filler, nano-TiO2 has also attracted much attention in the compounding with polymers. However, TiO2 can only absorb ultraviolet light with wavelength less than 380 nm, and it has high recombination rate of the hole/electron pairs, resulting in limitation of practical application of TiO2.17 The construction of heterostructure nanocomposites between TiO2 and other materials is considered to be a typical strategy to improve the separation efficiency of photogenerated holes/electrons pairs.18 Graphene has hexagonal honeycomb lattice structure consisting of carbon atoms with sp2 hybrid, which has excellent optical, electrical, mechanical properties and thermal stability.19–21 Graphene and its derivatives make them ideal platforms for various nanocomposites due to their unique planar structure and excellent electron transport properties. Graphene oxide (GO) is one of the important derivatives of graphene, which maintains the layered structure of graphene and has a large number of easily modified oxygen-containing groups.22,23 Combining graphene-based materials with TiO2 without causing defects in the energy band gap of TiO2 expand spectral sensitivity range and improve photocatalytic activity.24–26 In addition, by incorporating graphene and TiO2 into the WPUA matrix, the excellent mechanical properties and thermal stability of the graphene itself can further enhance performance of WPU. More importantly, the nanofiller-WPUA composites can overcome the shortcomings of the mechanical properties of the conventional water-based polyurethane meanwhile exhibit excellent environmental self-cleaning ability under visible light.
The properties of nanofiller-polymer composites largely depend on the dispersion of nanofiller and the interfacial interaction between nanofiller and polymer matrix.27 However, both graphene and TiO2 nanoparticles are poorly dispersible in most polymer matrix and tend to aggregate. Various methods were reported to improve the dispersibility in polymer matrix via changing the surface properties of nanofiller.28–31 Non-covalent modification of nanofiller is a simple and effective method to promote the combination of nanofiller-polymer composites. Among non-covalent modification methods, electrostatic attraction between nanofiller and polymer matrix is also an efficient approach to combine nanofiller–polymer nanocomposites. For instance, Wei et al. prepared polyacrylate/surfactant-modified reduced graphene oxide (PA/LAS-rGO) to investigate their tribological behaviors on flexible leather substrates. Due to the good compatibility and amphiphilicity of LAS-rGO in polyacrylate latex, polyacrylate/LAS-rGO exhibits good mechanical and tribological properties.32 Luo et al. provided a facile approach for fabrication of a nanocomposite epoxy coating with superior corrosion protection performance by incorporating a cationic reduced graphene oxide (RGO-ID+).33
In this work, we provided a novel and eco-friendly approach for fabrication of nanocomposites-WPUA with excellent mechanical properties and self-cleaning performance in photocatalysis by incorporating a cationic modified TiO2/reduced graphene oxide (C-TiO2/rGO) to anionic WPUA. The cationic surfactant hexadecyl trimethyl ammonium bromide (CTAB) was intercalated into TiO2/rGO to improve the dispersibility of TiO2/rGO nanocomposites in polymer matrix. The C-TiO2/rGO composite WPUA (C-TiO2/rGO-WPUA) was prepared by combining cationic TiO2/rGO with anionic waterborne polyurethane acrylate by electrostatic attraction. It is expected that C-TiO2/rGO-WPUA could exhibit great performance improvement in thermal stability, mechanical properties and environmental self-cleaning ability.
2. Experimental section
2.1 Materials
Nano-TiO2 (99.8% metals basis), 2-hydroxy-4′-(2-hydroxyethoxy)-2-methylpropiophenone (Irgacure 2959, photoinitiator), hexadecyl trimethyl ammonium bromide (CTAB, AR), N,N-dimethylformamide (DMF, AR), isophorone diisocyanate (IPDI, 99%), polytetramethylene ether glycol (PTMEG, Mn = 1000 g mol−1), 2,2-dimethylolbutyric acid (DMBA, 98%), triethylamine (TEA, 99%) and dibutyltin dilaurate (DBTDL, 98%), acetone (AR) were purchased from Aladdin Biological Technology Co., Ltd. (Shanghai, China). 1,4-Butanediol (BDO, 98%), hydroxyethyl methacrylate (HEMA), sulfuric acid (H2SO4, 98%), phosphoric acid (H3PO4, 85%), potassium permanganate (KMnO4), hydrogen peroxide (H2O2, 30%), and hydrochloric acid (HCl, 37%), methyl orange powder were obtained from Kelong chemical Co., Ltd. (Chengdu, China). Graphite powder was purchased from HuaYuan Chemical Industry Co., Ltd. (Shanghai, China).2.2 Preparation of GO
GO was prepared by the modified Hummers' method.34,35 1 g of graphite powder was placed in a beaker. 135 ml of H2SO4 and 15 ml of phosphoric acid were then added, and stirred under ice bath for 5–10 min. 6 g of KMnO4 was slowly added to the uniformly stirred black graphite solution under ice bath for 30 minutes, and the color of the solution gradually turned dark green. The mixture was stirred for 12 h at room temperature. Then, a certain amount of ice water was slowly added into the mixture under ice bath. H2O2 was then added until no bubbles generated, meantime the solution turned from dark green to dark yellow. Finally, the obtained mixture was filtered through a sand core funnel, washed with 3% HCl and deionized water until the pH reached neutral, and then freeze-dried to obtain brown GO.2.3 Preparation of C-TiO2/rGO nanocomposites
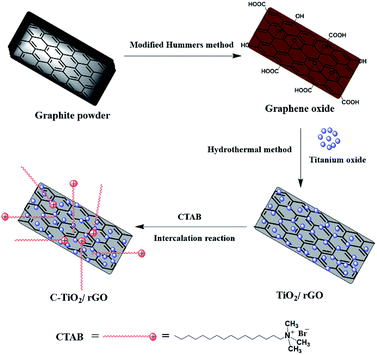
C-TiO2/rGO nanocomposites were synthesized by a two-step method.36,37 Firstly, the TiO2/rGO nanocomposites were prepared by hydrothermal method. A homogeneous TiO2/GO suspension was obtained by dispersing 0.1 g of TiO2 and 0.1 g of GO in 50 ml of water and 25 ml of absolute ethanol in an ultrasonic bath for 30 minutes. After stirring for 2 h, the mixture was transferred to a 100 ml Teflon-lined autoclave and heated at 180 °C for 12 h. The hydrothermal process would partially reduce GO to rGO. The resulting suspension was separated and washed repeatedly with distilled water and absolute ethanol, and finally dried at 50 °C for 6 hours to prepare TiO2/rGO nanocomposites.Then, the TiO2/rGO nanocomposites (0.1 g) obtained in the previous step was dispersed in DMF (10 ml) and sonicated for 30 minutes to form a uniform suspension. DMF solution of CTAB (0.2 g CTAB in 200 ml DMF) was slowly added into the above suspension. The mixture was sonicated for 8 h and stirred for 24 h, then filtered, washed several times with distilled water and absolute ethanol, and dried in an oven at 50 °C to obtain C-TiO2/rGO. The preparation process of C-TiO2/rGO nanocomposites was shown in Scheme 1.
2.4 Preparation of C-TiO2/rGO-WPUA nanocomposites
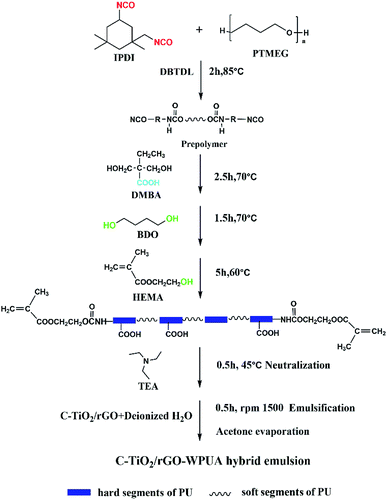
0.01 mol of PTMEG, 0.045 mol of IPDI and DBTDL as catalyst (0.25 weight percent of total solids) were charged to a 250 ml three-necked round bottom flask equipped with a nitrogen inlet, condenser, oil bath and mechanical stirrer. The reaction was carried out at 85 °C for 2 hours with stirring at 200 rpm. An additional chain extension reaction was carried out with 0.01 mol DMBA (dissolved in 15 ml acetone) at a temperature of 70 °C to form an NCO-terminated PU prepolymer for an additional 2.5 hours. Then, an appropriate amount of BDO was added to the reaction mixture at 70 °C for 1 hour. The reaction was then cooled to 60 °C, HEMA (1.393 g) was added to the system and allowed to react at 60 °C for 5 hours. When the temperature was cooled to 40 °C, TEA (DMPA equivalent) was added to neutralize the acidic groups for 30 minutes.Then, the prepared C-TiO2/rGO was firstly dispersed in deionized water, ultrasonically obtained for one hour to obtain a homogeneous dispersion solution, and the dispersion was added to the reaction system under vigorous stirring for 30 minutes. Finally, acetone was removed using a rotary evaporator at 45 °C. The solid content of the resulting dispersion was 30 wt%. The preparation process of C-TiO2/rGO-WPUA hybrid emulsion was shown in Scheme 2.
2.5 Preparation of C-TiO2/rGO-WPUA composites films
The films were obtained by pouring the C-TiO2/rGO-WPUA emulsions with 3 wt% Irgacure 2959 photoinitiator onto a smooth and clean glass plate to dry at room temperature for 5 days. The dried film was cured by using a UV lamp (8 W cm−1, wavelength 356 nm, Valley Photoelectric Technology Co., Ltd) for 3 min. For comparison, the films of TiO2/rGO-WPUA, rGO-WPUA and TiO2/rGO-WPUA were also prepared by using the same procedure. The composites films with C-TiO2/rGO contents (with respect to the WPUA solid content) of 0.1, 0.5, and 1.0 wt% were denoted as 0.1% C-TiO2/rGO-WPUA, 0.5% C-TiO2/rGO-WPUA and 1.0% C-TiO2/rGO-WPUA, respectively. The composites films with TiO2/rGO contents of 0.1, 0.5, and 1.0 wt% were denoted as 0.1% TiO2/rGO-WPUA, 0.5% TiO2/rGO-WPUA and 1.0% TiO2/rGO-WPUA, respectively. The composites films with only rGO or TiO2 contents of 0.5 wt% were denoted as 0.5% rGO-WPUA and 0.5% TiO2-WPUA.2.6 Characterization
UV-Vis absorption spectrum was recorded with a Purkinje TU1901 UV-Vis spectrophotometer at room temperature. High-resolution transmission electron microscopy (HRTEM) image was detected with FEI Tecnai GF20S-TWIN equipment. XRD measurements were performed at Panalytical X'Pert Pro MPD instrument with Cu Kα radiation. All samples were scanned in 2θ range from 5° to 80°. Fourier transform infrared (FTIR) spectra were recorded with a Nicolet NEXUS 670 FTIR spectrometer at room temperature. The spectra were recorded in the range of 4000–400 cm−1 at a resolution of 4 cm−1. Raman spectra of GO, TiO2/rGO, C-TiO2/rGO were obtained on Raman spectrometer (HORIBA LabRAM HR) with laser of wavelength 532 nm from 100 to 3300 cm−1. Thermogravimetric analysis (TGA) was performed by using a METTLER TOLEDO TGA/DSC 2/1600-ThermoStar from 30 °C to 600 °C under nitrogen at a rate of 10 °C min−1 for characterizing the inorganic fillers and WPUA composites, respectively. Field Emission Scanning Electron Microscopy (JEOL JSM-7500 F) was used to observe morphological features of GO, TiO2/rGO, C-TiO2/rGO and fractured surface of WPUA composites. Tensile strength and elongation at break of the WPUA composites were measured using a RGT-SX-10 electronic universal material testing machine (Shenzhen Reger Instrument Co., Ltd) at room temperature, with a cross head speed of 100 mm min−1.The self-cleaning properties of the WPUA were evaluated by photocatalytic degradation of the methyl orange (MO) under 300 W Xe lamp (420 nm < λ < 780 nm). In a typical test, the WPUA films (average weight 0.6–0.8 g) were cut into small pieces (almost 5 × 5 mm2 in size), and these chopped WPUA films were immersed in 80 mL of a 20 ppm MO. The mixture was then placed in the dark and stirred for 0.5 h to achieve adsorption equilibrium. The MO solution was then photodegraded under visible light illumination. The change in concentration of MO was monitored by measuring the characteristic methyl orange peak (465 nm) at specific illumination time intervals.
3. Results and discussion
3.1 Characterization of the nanocomposites
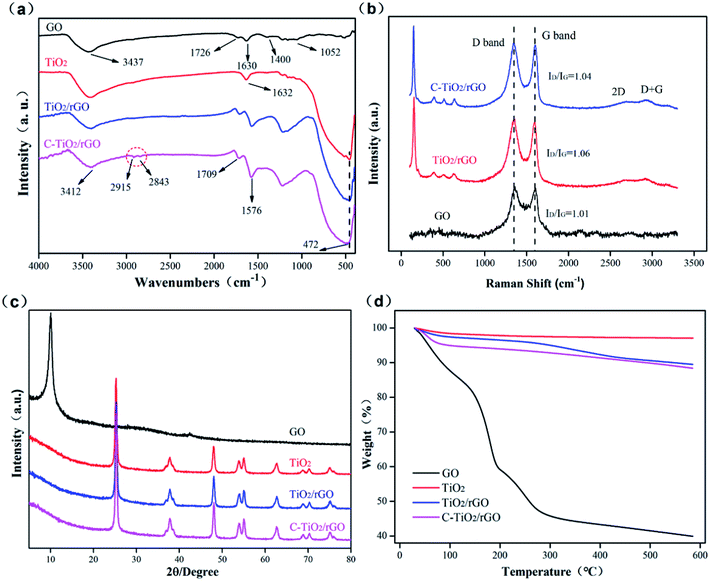
The FTIR spectra of GO, TiO2, TiO2/rGO and C-TiO2/rGO were shown in Fig. 1(a). From the GO spectrum curve, it could be observed that –OH stretching vibration peak appeared near 3437 cm−1, C![[double bond, length as m-dash]](https://www.rsc.org/images/entities/char_e001.gif) O stretching vibration peak appeared at 1726 cm−1, C–OH bending vibration peak appeared at 1630 cm−1, C–O stretching vibration peak of carboxyl appeared at 1400 cm−1 and C–O–C vibration absorption peak of epoxy group appeared at 1052 cm−1. For TiO2, a broad absorption peak at 3000–3600 cm−1 and a peak at 1632 cm−1 could be attributed to the vibration of OH groups of adsorbed water and the Ti–OH group. The absorption peak around 500–700 cm−1 was assigned to the signal of Ti–O–Ti bond.38 The disappearance of the C
O stretching vibration peak appeared at 1726 cm−1, C–OH bending vibration peak appeared at 1630 cm−1, C–O stretching vibration peak of carboxyl appeared at 1400 cm−1 and C–O–C vibration absorption peak of epoxy group appeared at 1052 cm−1. For TiO2, a broad absorption peak at 3000–3600 cm−1 and a peak at 1632 cm−1 could be attributed to the vibration of OH groups of adsorbed water and the Ti–OH group. The absorption peak around 500–700 cm−1 was assigned to the signal of Ti–O–Ti bond.38 The disappearance of the C![[double bond, length as m-dash]](https://www.rsc.org/images/entities/char_e001.gif) O peak at 1726 cm−1 and the C–O stretching vibration peak at 1400 cm−1 and the weakening of the OH stretching vibration peak at 3412 cm−1 indicated that GO was partially reduced to rGO in the nanocomposites.39 Also, the presence of the Ti–O stretching vibration peak at 472 cm−1 indicated the presence of TiO2 nanoparticles in the nanocomposites. New peaks at 2915 cm−1 and 2843 cm−1 for C-TiO2/rGO could be ascribed to the asymmetric and symmetrical stretching vibration of C-H in the alkyl chain of cationic surfactant CTAB, which was an evidence of the successful intercalation of TiO2/rGO with CTAB.40
O peak at 1726 cm−1 and the C–O stretching vibration peak at 1400 cm−1 and the weakening of the OH stretching vibration peak at 3412 cm−1 indicated that GO was partially reduced to rGO in the nanocomposites.39 Also, the presence of the Ti–O stretching vibration peak at 472 cm−1 indicated the presence of TiO2 nanoparticles in the nanocomposites. New peaks at 2915 cm−1 and 2843 cm−1 for C-TiO2/rGO could be ascribed to the asymmetric and symmetrical stretching vibration of C-H in the alkyl chain of cationic surfactant CTAB, which was an evidence of the successful intercalation of TiO2/rGO with CTAB.40
Raman spectroscopy is an effective tool for characterizing graphene materials, indicating the quality and defects of graphene materials through the D band and G band.41 Fig. 1(b) showed the Raman spectra of GO, TiO2/rGO and C-TiO2/rGO, both of which mainly dominated by the D band located at ∼1349 cm−1 and G band located at ∼1598 cm−1, attributed to sp3 defect and graphitic sp2 carbons, respectively.42 The intensity ratio (ID/IG) between G band and D band indicates the disorder degree of graphene structure. The ID/IG intensity ratio of TiO2/rGO and C-TiO2/rGO were calculated to be 1.06 and 1.04, respectively. The increased ID/IG intensity ratio compared with that of GO (1.01) could be one of the indicators for GO reduction because the reduction of GO easily introduced more defects at the edge of the graphitic sheets.43 In addition, the ID/IG ratio of TiO2/rGO modified by CTAB decreased from 1.06 to 1.04, indicating a decrease in defect density in TiO2/rGO nanocomposites. The appearance of the 2D peak in the Raman spectra of TiO2/rGO and C-TiO2/rGO at 2692 cm−1 indicated the presence of multilayer graphene sheets in nanocomposites.44 GO did not show this particular band. This phenomenon was due to the fact that GO prepared by the modified Hummers' method contained a large number of defects and heavy oxidation of its basal plane, which affected the scattering of secondary phonons, resulting in weak or no 2D and D + G bands in Raman spectroscopy of GO. Nevertheless, Raman spectrum of TiO2/rGO and C-TiO2/rGO showed the typical mode of anatase TiO2 (∼148, ∼201, ∼393, ∼512 and ∼635 cm−1), indicating the presence of anatase TiO2 in C-TiO2/rGO and TiO2/rGO.
The XRD patterns of GO, TiO2, TiO2/rGO and C-TiO2/rGO nanocomposites were shown in Fig. 1(c). GO exhibited a reflection peak at 10.1° corresponding to the interlayer distance of 0.87 nm. The peaks of 2θ values at 25.3°, 37.8°, 48.0°, 53.9°, 55.1°, and 62.7° were assigned to the (101), (004), (200), (105), (211) and (204) planes of anatase TiO2, respectively.45 The XRD peak positions and peak shapes of C-TiO2/rGO and TiO2/rGO were almost the same as those of pure TiO2, indicating the presence of TiO2 in C-TiO2/rGO and TiO2/rGO. Similar positions and shapes of their XRD peaks may be due to the fact that the crystallinity of TiO2 was too much stronger than that of rGO, and the weak characteristic peak of the reduced graphene was totally masked by the main peak of anatase TiO2 at 25.3°.46,47 Moreover, the specific number of graphene layers could be calculated from the XRD data. Take GO as an example:
Firstly, the (001) XRD diffraction peak of GO was fitted to obtain FWHM (full width at half maximum) = 0.881° and 2θ = 10.17°. According to the Bragg equation and Scherrer equation:
2d![[thin space (1/6-em)]](https://www.rsc.org/images/entities/char_2009.gif) sin sin![[thin space (1/6-em)]](https://www.rsc.org/images/entities/char_2009.gif) θ = nλ θ = nλ
| (1) |
 | (2) |
TGA thermograms of GO, TiO2, TiO2/rGO and C-TiO2/rGO were shown in Fig. 1(d). TiO2 remained thermally stable up to 600 °C under nitrogen atmosphere, and a small part of weight loss was due to desorption of water molecules adsorbed on the surface of TiO2. In contrast, GO was thermally unstable, with a weight loss of up to 60.1% at 600 °C, which was related to the pyrolysis of a large number of unstable oxygen functional groups such as hydroxyl, carboxyl and carbonyl on its surface.48 At 600 °C, the weight loss of TiO2/rGO and C-TiO2/rGO were 10.5% and 11.6%, respectively. This weight loss was due to the decomposition of oxygenated groups, reduced graphene and other organic compounds. It was worth noting that the weight loss of C-TiO2/rGO was higher than that of TiO2/rGO due to the decomposition of CTAB molecules in C-TiO2/rGO.
3.2 Morphology of the nanocomposites
The FESEM images showed the surface morphological characteristics of GO, TiO2/rGO and C-TiO2/rGO. It can be seen from Fig. 2(a) that the microstructure of the GO had obvious wrinkles with sheet structure. Comparing the FESEM images of TiO2/rGO (Fig. 2(b)) with C-TiO2/rGO (Fig. 2(c)), it could be seen that TiO2 nanoparticles were both successfully loaded on the rGO sheets, and the sizes of TiO2 nanoparticles were distributed between 15 nm and 30 nm by scale analysis with software ImageJ. Moreover, it could be clearly seen from the FESEM images that the TiO2 nanoparticles in TiO2/rGO had large amount of agglomeration on the rGO sheets with poor dispersion. Compare with TiO2/rGO, TiO2 nanoparticles in C-TiO2/rGO were relatively well-distributed on the rGO sheets without large aggregation. This was probably because the dispersion of the TiO2 nanoparticles on the graphene sheet is effectively improved by the modification of the surfactant CTAB.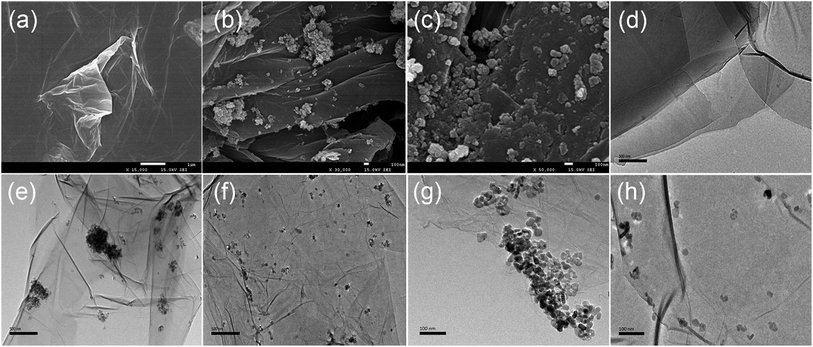 | ||
| Fig. 2 FESEM images of (a) GO, (b) TiO2/rGO and (c) C-TiO2/rGO, and TEM images of (d) GO, (e and g) TiO2/rGO and (f and h) C-TiO2/rGO. | ||
The TEM images of GO (d), TiO2/rGO (e and g) and C-TiO2/rGO (f and h) were shown in Fig. 2. Compared with the clean surface of bare GO sheets (Fig. 2(d)), tiny nanoparticles were observed on the rGO sheets (Fig. 2(e–h)). The TEM images of the TiO2/rGO and C-TiO2/rGO demonstrated that TiO2 nanoparticles were both successfully loaded on the rGO sheets. In addition, it could be seen that the sizes of the TiO2 nanoparticles were between 15 nm and 30 nm, and the results were consistent with the above SEM results. Similarly, the TiO2 nanoparticles in TiO2/rGO had uneven aggregation on the rGO sheets and showed poor dispersion, while the distribution of TiO2 nanoparticles in C-TiO2/rGO was relatively uniform without obvious large aggregation.
3.3 Characterization of the WPUA and its composites
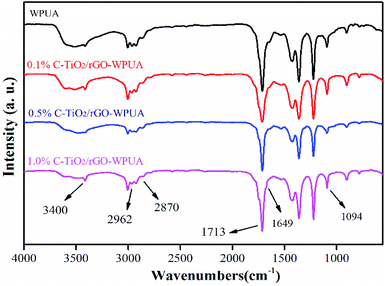
The FTIR spectra of WPUA and C-TiO2/rGO-WPUA with various nanocomposites loadings were shown in Fig. 3, all of which showed nearly similar absorption curves. This should be due to the fact that the addition of small amount of C-TiO2/rGO had low influence on the FTIR spectrum of the WPUA.49 As illustrated, the stretching vibration peak of N–H at ∼3400 cm−1 and the stretching vibration peak of C![[double bond, length as m-dash]](https://www.rsc.org/images/entities/char_e001.gif) O at ∼1713 cm−1 indicated that the urethane bonds were formed by the reaction of isocyanato group of IPDI and the hydroxyl group of PTMEG. The peaks appeared at ∼2962 cm−1 and ∼2870 cm−1 represented C–H stretching and CH2 stretching absorption peak. The absorption peak at ∼1094 cm−1 was attributed to the stretching vibration of the C–O–C of the polyether. The disappearance of the stretching vibration peak of the NCO group at 2270 cm−1 confirmed that complete reaction of –NCO.50 Moreover, a small band of ∼1649 cm−1 attributed to the C
O at ∼1713 cm−1 indicated that the urethane bonds were formed by the reaction of isocyanato group of IPDI and the hydroxyl group of PTMEG. The peaks appeared at ∼2962 cm−1 and ∼2870 cm−1 represented C–H stretching and CH2 stretching absorption peak. The absorption peak at ∼1094 cm−1 was attributed to the stretching vibration of the C–O–C of the polyether. The disappearance of the stretching vibration peak of the NCO group at 2270 cm−1 confirmed that complete reaction of –NCO.50 Moreover, a small band of ∼1649 cm−1 attributed to the C![[double bond, length as m-dash]](https://www.rsc.org/images/entities/char_e001.gif) C stretching vibration peak in acrylic was observed.51
C stretching vibration peak in acrylic was observed.51
3.4 Thermal properties
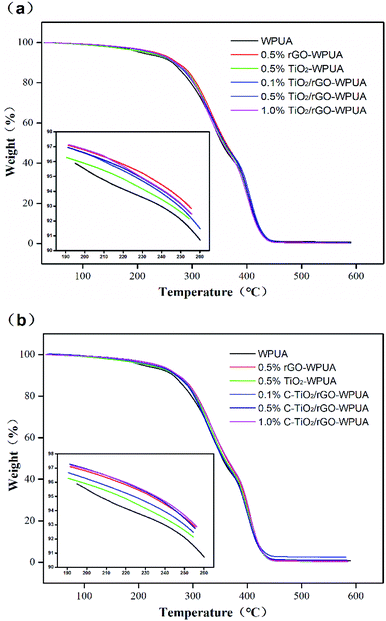
TGA was used to characterize the thermal stability of WPUA and its composites. The TGA curves for neat WPUA, TiO2/rGO-WPUA and C-TiO2-rGO/WPUA under N2 atmosphere were shown in Fig. 4, and the main decomposition temperature corresponding to different weight loss was summarized in Table 1. All thermograms demonstrated two step degradation profiles for the presence of soft and hard segments in WPUA. The TGA curves showed that the TiO2/rGO-WPUA and C-TiO2/rGO-WPUA were shifted toward a higher temperature compared with that of neat WPUA. From Table 1, the T95% of the TiO2/rGO-WPUA and C-TiO2/rGO-WPUA at 1.0 wt% nanocomposites content were about 22.5 °C and 29.2 °C higher than neat WPUA, respectively. The results showed that the addition of nanocomposites improved the thermal stability of TiO2/rGO-WPUA and C-TiO2/rGO-WPUA. The increased thermal stability was due to the presence of inorganic components with additional heat insulating capacity, which stabilized WPUA composites against thermal decomposition. Moreover, the presence of strong non-covalent interactions between nanocomposites and WPUA matrix enhanced the thermal stability of the composites.| Composites | T95% (°C) | T90% (°C) | T50% (°C) | Wpre (%) |
|---|---|---|---|---|
| a T95%: temperature at 90% mass loss; T90%: temperature at 90% mass loss; T50%: temperature at 50% mass loss; Wpre: percentage of residue remained at the end (600 °C). | ||||
| Neat WPUA | 206.4 | 263.9 | 354.1 | 0.8 |
| 0.5% rGO-WPUA | 233.1 | 272.1 | 361.7 | 0.5 |
| 0.5% TiO2-WPUA | 217.3 | 268.4 | 358.0 | 0.4 |
| 0.1% TiO2/rGO-WPUA | 225.9 | 267.7 | 359.9 | 0.4 |
| 0.5% TiO2/rGO-WPUA | 228.4 | 269.6 | 359.8 | 0.4 |
| 1.0% TiO2/rGO-WPUA | 228.9 | 269.5 | 355.9 | 0.2 |
| 0.1% C-TiO2/rGO-WPUA | 224.2 | 268.9 | 355.3 | 2.6 |
| 0.5% C-TiO2/rGO-WPUA | 234.5 | 269.9 | 355.8 | 1.0 |
| 1.0% C-TiO2/rGO-WPUA | 235.6 | 273.0 | 362.7 | 0.3 |
3.5 Fracture surface morphology
The dispersion of the nanocomposites in the polymer matrix strongly influences the properties of the composites.52 To investigate the dispersibility and compatibility of the nanocomposites in the WPUA matrix, the microscopic morphology of the fracture surface of the WPUA and its composites were observed by SEM.Fracture surface SEM images of neat WPUA and its composites were shown in Fig. 5. All WPUA and its composites were pre-immersed in liquid nitrogen for a few hours and then chopped, and the dispersion of the fillers in the polymer matrix were observed by SEM. From Fig. 5, all WPUA films had similar fracture morphology with some ridges, while the fracture surface of the WPUA composites were relatively rough than that of neat WPUA. In addition, the fracture surface of the 0.5% TiO2/rGO-WPUA (Fig. 5(c) and (d)) was not uniformly dispersed, and obvious exposed nanocomposites were observed on the fractured surface, which suggested that the aggregation occurred. In comparison to 0.5% TiO2/rGO-WPUA, the fractured surface of the 0.5% C-TiO2/rGO-WPUA (Fig. 5(e) and (f)) was obviously more homogenous due to the relatively strong ionic interaction between C-TiO2/rGO and the WPUA matrix.
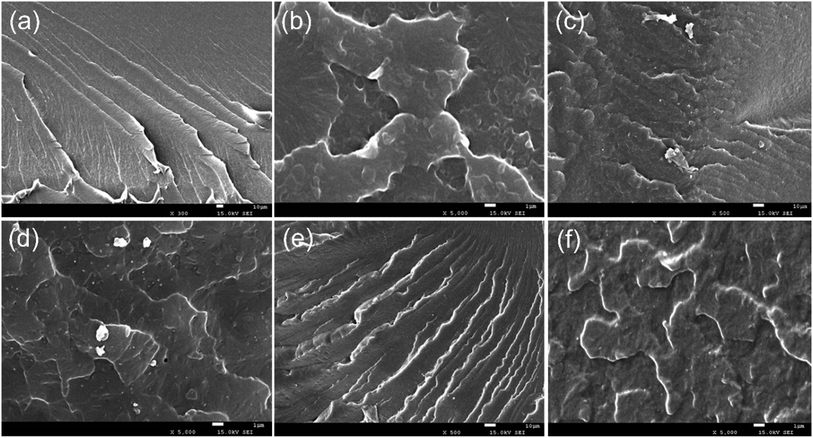 | ||
| Fig. 5 Fracture surface SEM images of (a) and (b) neat WPUA, (c) and (d) 0.5% TiO2/rGO-WPUA, and (e) and (f) 0.5% C-TiO2/rGO-WPUA. | ||
3.6 Mechanical properties
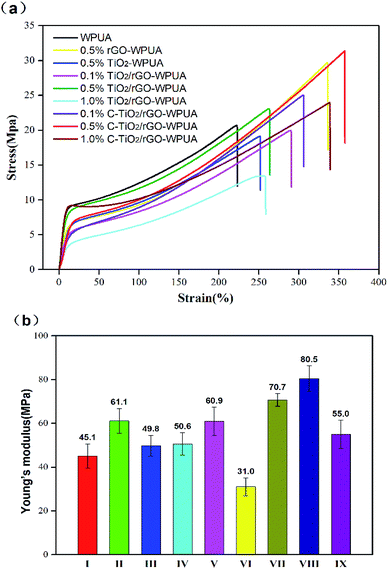
It is of great guiding significance to investigate the mechanical properties of WPUA for its practical application. Fig. 6(a) and (b) showed the tensile stress–strain curves and tensile modulus of WPUA and its composites. It could be seen from Fig. 6(a) that the overall performance of most composites were higher than that of neat WPUA. The C-TiO2/rGO-WPUA exhibited better mechanical properties than TiO2/rGO-WPUA or neat WPUA. With the increase of the amount of nanofillers, the mechanical properties of TiO2/rGO-WPUA or C-TiO2/rGO-WPUA increased firstly and then significantly decreased. This might due to the aggregation of the nanofillers in the WPUA matrix with a further addition (1.0%) of nanocomposites. Greater performance improvement of C-TiO2/rGO-WPUA could be attributed to good compatibility and strong interfacial interaction of the nanocomposites with the WPUA matrix. Specifically, the C-TiO2/rGO-WPUA with 0.5% nanocomposites content produced a maximum tensile strength of 31.4 MPa, elongation at break of 357.2% and Young's modulus of 80.5 MPa, which meant 51.5%, 60.6% and 78.5% enhancement comparing with neat WPUA, respectively. It should be noted that the performance of the WPUA composites were greatly improved when only rGO was added. 0.5% rGO-WPUA produced tensile strength of 29.7 MPa, elongation at break of 335.6% and Young's modulus of 61.1 MPa. However, this phenomenon did not occur when only TiO2 was added, indicating that rGO played a more important role in improving the mechanical properties of the WPUA composites. This may be because rGO had stronger strength and stiffness than TiO2. Moreover, compared with TiO2 nanoparticles, the larger layered structure of rGO had a larger surface area, and the incorporation of rGO could effectively increase the compactness of the WPUA composite film, thereby better improving mechanical properties.3.7 Photocatalytic properties
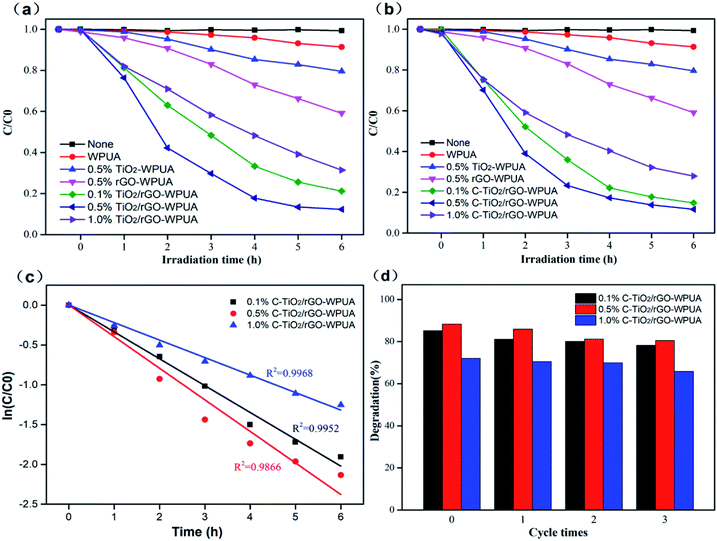
In this study of photocatalytic properties, methyl orange (MO) was selected as the model dirt for testing the self-cleaning properties of the prepared composite films. The photocatalytic degradation of the dye was investigated by immersing chopped pieces of the composite films into the solution of MO under visible light illumination. Degradation curves were shown in Fig. 7(a) and (b).It is well known that TiO2/graphene nanocomposites exhibit enhanced photocatalytic activity compared to pure TiO2 nanoparticles.53 Therefore, when TiO2/rGO-WPUA and C-TiO2/rGO-WPUA composites were used as photocatalysts, photocatalytic degradation of MO solution resulted in a significant decrease in MO concentration. From Fig. 7(a) and (b), all of the composites exhibited predictable photocatalytic degradation ability. The highest efficiency of the dye degradation was recorded in the presence of the sample of 0.5% C-TiO2/rGO-WPUA, where 88.3% of MO was decomposed after 6 hours under visible light illumination (time-dependent UV absorption spectra and image showing the degradation of MO at different times were shown in Fig. s1 and s2†). The 0.5% C-TiO2/rGO-WPUA sample had the highest efficiency for degrading MO dyes because 0.5% C-TiO2/rGO could be well dispersed in the WPUA matrix (this could be reflected in the fracture surface SEM images). Moreover, with CTAB modification in C-TiO2/rGO, the TiO2 nanoparticles were more uniformly dispersed on the reduced graphene sheets, the composites had a higher absorption light area and a higher surface area in the photocatalysis, resulting in higher photocatalytic performance. In comparison, neat WPUA had a degradation efficiency of only 8.7%. 0.5% rGO-WPUA and 0.5% TiO2-WPUA had certain degradation ability of 40.9% and 20.4%. In addition, a blank test without WPUA was also carried out, and almost no MO concentration changes were found after 6 hours under visible light illumination. The photocatalytic performance of C-TiO2/rGO-WPUA composites were slightly better than that of TiO2/rGO-WPUA, which was attributable to better dispersibility of C-TiO2/rGO in WPUA matrix and better dispersibility of TiO2 nanoparticles on rGO sheets. Moreover, the photocatalytic performance of TiO2/rGO-WPUA and C-TiO2/rGO-WPUA composites were both significantly decreased with a further addition (1.0%) of nanocomposites. It may be attributed to the accumulation of excess nanocomposites in the WPUA matrix. The uneven dispersion affected the absorption of visible light by the composites, resulting in a decrease in photocatalytic performance. Fig. 7(c) depicted the corresponding kinetic curves fitted with a first order kinetic equation:
| ln(C/C0) = −kt |
4. Conclusions
A series of C-TiO2/rGO-WPUA composites were prepared via incorporation of cationic TiO2/rGO with WPUA. The cationic surfactant CTAB was intercalated into the TiO2/rGO nanocomposites, which effectively improved the dispersibility of TiO2 on the reduced graphene sheets and the dispersibility of TiO2/rGO nanocomposites in the polymer matrix. The C-TiO2/rGO nanocomposites were efficiently assembled with the WPUA matrix by ionic interaction and exhibited excellent dispersibility in the WPUA matrix. By introducing cationic surfactant-modified TiO2/rGO nanocomposites into WPUA, the thermal properties, mechanical properties and photocatalytic properties of WPUA composites were significantly improved. The mechanical properties of WPUA composites largely depended on the dispersion of TiO2/rGO in WPUA matrix. With the increase of the amount of nanocomposites, the mechanical properties of WPUA composite increased firstly and then significantly decreased. Compared with neat WPUA, the elongation at break, tensile strength and elastic modulus of 0.5 wt% C-TiO2/rGO-WPUA composites increased significantly by 49.9%, 43.0% and 78.5%, respectively. The composites also exhibited good self-cleaning ability in photocatalysis. Interestingly, the photocatalytic performance of WPUA composites were mainly related to the content of nanocomposites other than the dispersion of nanocomposites. The highest efficiency of the dye degradation (88.3%) was recorded in the presence of the sample of 0.5% C-TiO2/rGO-WPUA after 6 hours visible light illumination. In summary, a novel approach for fabrication of a nanocomposites-WPUA with high performance and self-cleaning ability was introduced by incorporating C-TiO2/rGO to anionic WPUA. C-TiO2/rGO-WPUA composites may be used as a new environment-friendly waterborne polyurethane material for self-cleaning coating.Conflicts of interest
There are no conflicts to declare.Acknowledgements
This work was supported by the Key Research and Development Program in Sichuan Province, China (No. 2018GZ0490) and Sichuan University–Sichuan Carpoly Coating Co., Ltd. Cooperation Project (No. 18H0916, 16H0295). We thank the Instrumental Analysis Center of Sichuan University for helping with characterization.Notes and references
- V. García-Pacios, V. Costa, M. Colera and J. M. Martín-Martínez, Prog. Org. Coat., 2011, 71, 136–146 CrossRef
.
- M. A. Pérez-Limiñana, F. Arán-Aís, A. M. Torró-Palau, A. C. Orgilés-Barceló and J. M. Martín-Martínez, Int. J. Adhes. Adhes., 2005, 25, 507–517 CrossRef
.
- Q. B. Meng, S. I. Lee, C. Nah and Y. S. Lee, Prog. Org. Coat., 2009, 66, 382–386 CrossRef CAS
.
- S.-h. Hsu, H.-J. Tseng and Y.-C. Lin, Biomaterials, 2010, 31, 6796–6808 CrossRef CAS PubMed
.
- C. Bai, X. Zhang and J. Dai, Prog. Org. Coat., 2007, 60, 63–68 CrossRef CAS
.
- D. B. Otts, E. Heidenreich and M. W. Urban, Polymer, 2005, 46, 8162–8168 CrossRef CAS
.
- H. Xu, F. Qiu, Y. Wang, W. Wu, D. Yang and Q. Guo, Prog. Org. Coat., 2012, 73, 47–53 CrossRef CAS
.
- F. Yu, L. Cao, Z. H. Meng, N. Lin and X. Y. Liu, Polym. Chem., 2016, 7, 3913–3922 RSC
.
- X. Liu, Q. Zhang, C. Huang, H. Li, H. Wang and M. Hu, RSC Adv., 2016, 6, 107942–107950 RSC
.
- M. Zhang, Y. Li, Z. Su and G. Wei, Polym. Chem., 2015, 6, 6107–6124 RSC
.
- O. C. Compton and S. B. T. Nguyen, Small, 2010, 6, 711–723 CrossRef CAS
.
- S.-T. Hsiao, C.-C. M. Ma, H.-W. Tien, W.-H. Liao, Y.-S. Wang, S.-M. Li, C.-Y. Yang, S.-C. Lin and R.-B. Yang, ACS Appl. Mater. Interfaces, 2015, 7, 2817–2826 CrossRef CAS
.
- A. Fujishima and K. Honda, Nature, 1972, 238, 37–38 CrossRef CAS PubMed
.
- O. Ola and M. M. Maroto-Valer, J. Photochem. Photobiol., C, 2015, 24, 16–42 CrossRef CAS
.
- R. Poulomi, K. Doohun, L. Kiyoung, S. Erdmann and S. Patrik, Nanoscale, 2010, 2, 45–59 RSC
.
- D. Chen, F. Huang, Y. B. Cheng and R. A. Caruso, Adv. Mater., 2010, 21, 2206–2210 CrossRef
.
- W. Ho, J. C. Yu, J. Lin, J. Yu and P. Li, Langmuir, 2004, 20, 5865–5869 CrossRef CAS
.
- W. Fan, X. Yu, H.-C. Lu, H. Bai, C. Zhang and W. Shi, Appl. Catal., B, 2016, 181, 7–15 CrossRef CAS
.
- K. S. Novoselov, A. K. Geim, S. V. Morozov, D. Jiang, Y. Zhang, S. V. Dubonos, I. V. Grigorieva and A. A. Firsov, Science, 2004, 306, 666–669 CrossRef CAS PubMed
.
- A. A. Balandin, S. Ghosh, W. Bao, I. Calizo, D. Teweldebrhan, F. Miao and C. N. Lau, Nano Lett., 2008, 8, 902–907 CrossRef CAS PubMed
.
- N. O. Weiss, H. Zhou, L. Liao, Y. Liu, S. Jiang, Y. Huang and X. Duan, Adv. Mater., 2012, 24, 5776 CrossRef
.
- N. I. Kovtyukhova, P. J. Ollivier, B. R. Martin, T. E. Mallouk and A. D. Gorchinskiy, Chem. Mater., 1999, 11, 771–778 CrossRef CAS
.
- A. B. Bourlinos, D. Gournis, D. Petridis, T. Szabó, A. Szeri and I. Dékány, Langmuir, 2003, 19, 6050–6055 CrossRef CAS
.
- K. Siwińska-Stefańska, M. Fluder, W. Tylus and T. Jesionowski, J. Environ. Manage., 2018, 212, 395–404 CrossRef
.
- J. Wei, Z. Zang, Y. Zhang, M. Wang, J. Du and X. Tang, Opt. Lett., 2017, 42, 911–914 CrossRef CAS PubMed
.
- H. Zhang, X. Wang, N. Li, J. Xia, Q. Meng, J. Ding and J. Lu, RSC Adv., 2018, 8, 34241–34251 RSC
.
- J. R. Potts, D. R. Dreyer, C. W. Bielawski and R. S. Ruoff, Polymer, 2011, 52, 5–25 CrossRef CAS
.
- K. Chen, Q. Tian, C. Tian, G. Yan, F. Cao, S. Liang and X. Wang, Ind. Eng. Chem. Res., 2017, 56, 11827–11838 CrossRef CAS
.
- X. Wang, W. Xing, L. Song, B. Yu, Y. Hu and G. H. Yeoh, React. Funct. Polym., 2013, 73, 854–858 CrossRef CAS
.
- Y. Fan, Y. Liu, Q. Cai, Y. Liu and J. Zhang, Synth. Met., 2012, 162, 1815–1821 CrossRef CAS
.
- C. Chen, S. Qiu, M. Cui, S. Qin, G. Yan, H. Zhao, L. Wang and Q. Xue, Carbon, 2017, 114, 356–366 CrossRef CAS
.
- L. Wei, J. Ma, W. Zhang, C. Liu and Y. Bao, Prog. Org. Coat., 2018, 122, 64–71 CrossRef CAS
.
- X. Luo, J. Zhong, Q. Zhou, S. Du, S. Yuan and Y. Liu, ACS Appl. Mater. Interfaces, 2018, 10, 18400–18415 CrossRef CAS PubMed
.
- D. C. Marcano, D. V. Kosynkin, J. M. Berlin, S. Alexander, S. Zhengzong, S. Alexander, L. B. Alemany, L. Wei and J. M. Tour, ACS Nano, 2010, 4, 4806–4814 CrossRef CAS PubMed
.
- W. S. H. Jr and R. E. Offeman, J. Am. Chem. Soc., 1958, 80, 1339 CrossRef
.
- J. Yang, Z. Wen, X. Shen, J. Dai, Y. Li and Y. Li, Chem. Eng. J., 2018, 334, 907–921 CrossRef CAS
.
- J. Xu, X. Cai and F. Shen, Appl. Surf. Sci., 2016, 379, 433–439 CrossRef CAS
.
- W. Low and V. Boonamnuayvitaya, Mater. Res. Bull., 2013, 48, 2809–2816 CrossRef CAS
.
- H. Gao, C. Wei, Y. Jian, J. Zhi, G. Hu, W. Shangguan, Y. Sun and J. Su, Int. J. Hydrogen Energy, 2013, 38, 13110–13116 CrossRef CAS
.
- Y. Wu, H. Luo, H. Wang, C. Wang, J. Zhang and Z. Zhang, J. Colloid Interface Sci., 2013, 394, 183–191 CrossRef CAS PubMed
.
- K. N. Kudin, B. Ozbas, H. C. Schniepp, R. K. Prud'Homme, A. Ilhan, A. Aksay and R. Car, Nano Lett., 2008, 8, 36–41 CrossRef CAS PubMed
.
- D. Graf, F. Molitor, K. Ensslin, C. Stampfer, A. Jungen, C. Hierold and L. Wirtz, Nano Lett., 2006, 7, 238–242 CrossRef PubMed
.
- J. H. Yun, R. J. Wong, H. N. Yun and R. Amal, ChemCatChem, 2013, 5, 3060–3067 CrossRef CAS
.
- A. C. Ferrari and J. Robertson, Phys. Rev. B: Condens. Matter Mater. Phys., 2000, 61, 14095–14107 CrossRef CAS
.
- M. S. A. S. Shah, A. R. Park, K. Zhang, J. H. Park and P. J. Yoo, ACS Appl. Mater. Interfaces, 2012, 4, 3893–3901 CrossRef PubMed
.
- Y. J. Xu, Y. Zhuang and X. Fu, J. Phys. Chem. C, 2010, 114, 2669–2676 CrossRef CAS
.
- S. Thakur and N. Karak, J. Mater. Chem. A, 2015, 3, 12334–12342 RSC
.
- W. Chao, X. Huang, G. Wang, X. Wu, Y. Ke, S. Li and P. Jiang, J. Mater. Chem., 2012, 22, 7010–7019 RSC
.
- A. Mohammadi, M. Barikani, A. H. Doctorsafaei, A. P. Isfahani, E. Shams and B. Ghalei, Chem. Eng. J., 2018, 349, 466–480 CrossRef CAS
.
- H. Song, M. Wang, Y. Wang, Y. Zhang, A. Umar and Z. Guo, Sci. Adv. Mater., 2017, 9, 1895–1904 CrossRef CAS
.
- O. Llorente, M. J. Fernández-Berridi, A. González and L. Irusta, Prog. Org. Coat., 2016, 99, 437–442 CrossRef CAS
.
- T. Kuilla, S. Bhadra, D. Yao, N. H. Kim, S. Bose and J. H. Lee, Prog. Polym. Sci., 2010, 35, 1350–1375 CrossRef CAS
.
- Y. Zhang, Z. R. Tang, X. Fu and Y. J. Xu, ACS Nano, 2010, 4, 7303–7314 CrossRef CAS PubMed
.
- R. Duarah and N. Karak, New J. Chem., 2018, 42, 2167–2179 RSC
.
Footnote |
| † Electronic supplementary information (ESI) available. See DOI: 10.1039/c9ra03250a |
| This journal is © The Royal Society of Chemistry 2019 |

