 Open Access Article
The preparation of liquefied bio-stalk carbon nanofibers and their application in supercapacitors†
Xia Jiang ab,
Chao Liua,
Gaofeng Shi*a,
Guoying Wanga,
Zhao Wanga,
Shiming Jia
 a,
Yucan Donga,
Puranjan Mishrac,
Haoqi Tiana and
Yanrong Liua
aSchool of Petrochemical Engineering, Lanzhou University of Technology, Lanzhou, China. E-mail: gaofengshi_lzh@163.com
bGansu Vocational College of Agriculture, Lanzhou, China
cFaculty of Engineering Technology, Universiti Malaysia Pahang, Lebuhraya Tun Razak, 26300 Gambang, Kuantan, Pahang, Malaysia
First published on 29th July 2019
Abstract
Carbon nanofibers (CNFs) have been widely used in electrochemical energy storage devices because of their excellent conductivity, extremely large surface area and structural stability. Herein, we obtained a viscous, liquefied bio-stalk carbon via the simple chemical treatment of biomass, and mixed it with polyacrylonitrile to prepare a spinning solution. Subsequent electrospinning and high temperature activation resulted in the successful preparation of liquefied lignin-based activated carbon nanofibers. The as-prepared liquefied bio-stalk carbon nanofibers exhibited an outstanding electrochemical performance (specific capacitance of 273 F g−1 at 0.5 A g−1 current density), and a capacitance retention of 210 F g−1 even under a large current density of 10 A g−1. Besides its high specific capacitance and outstanding rate capability, the symmetrical supercapacitor cell based on the liquefied carbon-based nanofiber electrodes also exhibited an excellent cycling performance with 92.76% capacitance retention after 5000 charge–discharge cycles. This study provides a new strategy for the future development of supercapacitor electrode materials and enhances the development of biomass energy.
Introduction
Faced with the issues such as constant consumption of fossil fuels and global warming, there is an urgent need for the development of energy storage devices with high power density to store energy and supply electricity. As an outstanding representative of electrochemical energy storage devices, supercapacitors have attracted wide attention due to their high power density, long cycle life and fast charge–discharge rates.1–3 The challenge in the research of supercapacitors is finding high-performance electrode materials.4 New nanocarbon materials, such as carbon nanotubes and carbon fibers, have characteristics, such as large aspect ratio, high strength, light weight, and good thermal conductivity and electrical conductivity, which make them suitable for high-capacity electrode materials.5 As a quasi-one-dimensional carbon material between carbon nanotubes and ordinary carbon fibers, carbon nanofibers have excellent physical and chemical properties, which make them very suitable for use as supercapacitor electrode materials.6,7Traditional methods for preparing carbon nanofibers include chemical vapor deposition (CVD),8 solution-liquid-solid methods,9 self-assembly,10 hydrothermal synthesis methods, and electrospinning.11,12 Compared with these conventional methods, the electrospinning method is favorable due to its simple equipment, convenient operation, low-cost, and continuous preparation.13,14
Usually, the electrospinning precursor is polyacrylonitrile,15 polyvinylpyrrolidone,16 or polyvinyl alcohol.17 However, these materials are expensive and difficult to prepare, seriously affecting the industrial production of carbon nanofiber materials. Therefore, it is imperative to seek new precursors. Lignin is one of the main components in woody plants and herbs, which consists mainly of cellulose and hemicellulose. Moreover, lignin is rich in resources, accounting for about 1/3 of biomass and has a high carbon yield of more than 50%.18 Therefore, the conversion of lignin into an electrospinning precursor will have great potential. However, lignin is a poorly soluble refractory natural polymer material with low plasticity, which limits its development in electrospinning applications. Fortunately, we have found that by lignin liquefaction technology, lignin can be converted into an electrospinning precursor liquid to prepare fibers directly. Lignin liquefaction technology is an effective way to fully exploit the potential value of woody biomass.19,20 This advanced wood chemical processing technology has matured into the wood industry. Based on the liquefaction technology, the main components of woody biomass, cellulose, hemicellulose, lignin and their mixtures can be liquefied and converted into polymers or low molecular substances with specific functional groups.21–23
Herein, we converted lignin to liquefied carbon and doped it into PAN as an electrospinning precursor, which saves cost and increases the solubility of precursor materials in high polymers. We used an agricultural waste, i.e., hemp straw, as the lignin precursor, which is one of the major crops in Western China. Huge amounts of hemp straw are left in harvested fields without further utilization, which leads to various environmental problems, and more importantly, results in the waste of renewable resources. Thus, the potential application of cornstalks in materials science is attracting considerable attention. Furthermore, it is advantageous to convert hemp straw into liquefied carbon because it contains rich carbonaceous species. Hemp straw is composed of three main fractions, namely, cellulose, hemicellulose, and lignin.24 The liquefied carbon was prepared using phenol as a liquefier and phosphoric acid as a catalyst.25,26 Then, liquefied carbon/polyacrylonitrile (PAN) nanofiber electrode materials with different mass ratios were prepared via electrospinning, which were denoted as LC-CNF. We explored the effect of liquefied carbon on the electrode capacitance behavior, which showed the advantages of liquefied carbon-based carbon nanofibers as a supercapacitor electrode material. The entire preparation process is shown in Fig. 1. This study offers a universal method for synthesizing liquefied carbon nanofibers from various lignin sources for various important energy storage and electronics devices.
Experimental
Materials
All the chemicals used in the present study were of analytical reagent (AR) grade. Hemp straws were obtained from Tianshui, Gansu, China. Polyacrylonitrile [PAN], N,N-dimethylformamide [DMF], phenol, potassium hydroxide [KOH], hexamethylenetetramine, and hydrochloric acid [HCL] were purchased from Chemical Reagent Co., Ltd. and used as received. Deionized water was used for the entire synthesis and application purposes.Preparation of liquefied carbon
Briefly, the hemp straw was repeatedly washed with deionized water to remove dust and impurities, and then dried in an oven at 80 °C for 24 h. The resulting dried hemp straw was crushed into a powder with a particle size below 100 mesh. Then, using a dosage of 10% phosphoric acid as a catalyst, the hemp straw powder was mixed with phenol at a mass rate of 1![[thin space (1/6-em)]](https://www.rsc.org/images/entities/char_2009.gif) :
:![[thin space (1/6-em)]](https://www.rsc.org/images/entities/char_2009.gif) 5 and liquefied at 160 °C. After 2.5 h, the oil bath was removed, and the reaction mixture cooled. Thereafter, the wood phenol-liquefied material was obtained. According to 5% by mass of the liquefied product, the chain extender hexamethylenetetramine was added to the liquefied carbon polymer.
5 and liquefied at 160 °C. After 2.5 h, the oil bath was removed, and the reaction mixture cooled. Thereafter, the wood phenol-liquefied material was obtained. According to 5% by mass of the liquefied product, the chain extender hexamethylenetetramine was added to the liquefied carbon polymer.
Electrospinning
The liquefied carbon (LC) and polyacrylonitrile (PAN) mixed in a certain mass ratio (8![[thin space (1/6-em)]](https://www.rsc.org/images/entities/char_2009.gif) :
:![[thin space (1/6-em)]](https://www.rsc.org/images/entities/char_2009.gif) 2, 7
2, 7![[thin space (1/6-em)]](https://www.rsc.org/images/entities/char_2009.gif) :
:![[thin space (1/6-em)]](https://www.rsc.org/images/entities/char_2009.gif) 3, and 6
3, and 6![[thin space (1/6-em)]](https://www.rsc.org/images/entities/char_2009.gif) :
:![[thin space (1/6-em)]](https://www.rsc.org/images/entities/char_2009.gif) 4) were accurately weighed and dissolved in 10 mL of N,N-dimethylformamide (DMF) solution. Magnetic stirring was carried out for 6 h at room temperature to obtain a uniform viscous spinning solution. The nanofibers were produced using an electrospinning device (Yongkang Leye, Beijing). The viscous solution was loaded into a 10 mL plastic syringe with a 22-gauge blunt tip needle. For electrospinning, the negative high pressure was −2 kV, the positive high pressure was 15 kV, the distance between the collector (aluminum foil) and the nozzle was fixed at 15 cm, the flow rate was 0.1 mm min−1, and the ambient temperature was 25 °C.
4) were accurately weighed and dissolved in 10 mL of N,N-dimethylformamide (DMF) solution. Magnetic stirring was carried out for 6 h at room temperature to obtain a uniform viscous spinning solution. The nanofibers were produced using an electrospinning device (Yongkang Leye, Beijing). The viscous solution was loaded into a 10 mL plastic syringe with a 22-gauge blunt tip needle. For electrospinning, the negative high pressure was −2 kV, the positive high pressure was 15 kV, the distance between the collector (aluminum foil) and the nozzle was fixed at 15 cm, the flow rate was 0.1 mm min−1, and the ambient temperature was 25 °C.
Carbonization and activation
The electrospun mats were placed in a programmed temperature-controlled muffle furnace and pre-oxidized in air at 280 °C for 1 h at a heating rate of 1 °C min−1. Then, the pre-oxidized nanofibers were mixed with 10 wt% KOH solution and subjected to activation treatment for 6 h. After being collected and dried, the activated nanofibers were carbonized at 800 °C for 1 h at a heating rate of 2 °C min−1 under a constant flow of nitrogen gas to obtain LC-CNFs. Thereafter, the LC-CNFs were thoroughly washed with 10 wt% HCL solution and dried at 80 °C for 12 h in an oven. The sample was named LC-CNF-X, where LC-CNF is the liquefied carbon-based carbon nanofiber and X (x = 0, 2, 3 and 4) stands for the different mass ratios of the PAN: liquefied carbon (1![[thin space (1/6-em)]](https://www.rsc.org/images/entities/char_2009.gif) :
:![[thin space (1/6-em)]](https://www.rsc.org/images/entities/char_2009.gif) 0, 8
0, 8![[thin space (1/6-em)]](https://www.rsc.org/images/entities/char_2009.gif) :
:![[thin space (1/6-em)]](https://www.rsc.org/images/entities/char_2009.gif) 2, 7
2, 7![[thin space (1/6-em)]](https://www.rsc.org/images/entities/char_2009.gif) :
:![[thin space (1/6-em)]](https://www.rsc.org/images/entities/char_2009.gif) 3, and 6
3, and 6![[thin space (1/6-em)]](https://www.rsc.org/images/entities/char_2009.gif) :
:![[thin space (1/6-em)]](https://www.rsc.org/images/entities/char_2009.gif) 4), respectively. For analysis and comparison, a sample without KOH treatment was synthesized, which was named LC-CNF-a.
4), respectively. For analysis and comparison, a sample without KOH treatment was synthesized, which was named LC-CNF-a.
Structure characterization
The morphology of the samples was characterized via scanning electron microscopy (SEM) (JSM-6701F, Japan). Energy dispersive X-ray (EDX) spectroscopy coupled with SEM was used to analyze the sample composition. Their crystal and molecular structures were investigated via X-ray diffraction (XRD, X'Pert Powder, Dutch PANalytical). Raman spectra were recorded using a spectrometer (JYHR800, Micro-Raman). Surface composition was determined via an X-ray photoelectron spectroscope (XPS, PHI5702, USA). The specific surface area was measured using the Brunauer–Emmett–Teller method by N2 adsorption and desorption at 77.3 K using a volumetric sorption analyzer (BET micromeritics ASAP 2020).Test of electrochemical properties
The working electrodes were fabricated by mixing the as-prepared carbon material (0.0040 g), acetylene black and polyvinylidene fluoride (PTFE) with a mass ratio of 85![[thin space (1/6-em)]](https://www.rsc.org/images/entities/char_2009.gif) :
:![[thin space (1/6-em)]](https://www.rsc.org/images/entities/char_2009.gif) 10
10![[thin space (1/6-em)]](https://www.rsc.org/images/entities/char_2009.gif) :
:![[thin space (1/6-em)]](https://www.rsc.org/images/entities/char_2009.gif) 5 in ethanol. The slurry was then loaded on a piece of nickel foam (2 cm × 1 cm) and dried at 80 °C for 12 h, and then pressed into a sheet at a pressure of 5 MPa. The electrochemical measurements on the carbon electrodes were performed using a CHI660E electrochemical workstation (CHI660E, Shanghai Chenhua Instrument Co. Ltd.). The standard three-electrode system contained a platinum plate as a counter electrode and saturated calomel electrode as the reference electrode. Cyclic voltammetry (CV) of the three-electrode system was performed in the voltage range of −1 to 0 V (vs. standard calomel electrode) at different scan rates.
5 in ethanol. The slurry was then loaded on a piece of nickel foam (2 cm × 1 cm) and dried at 80 °C for 12 h, and then pressed into a sheet at a pressure of 5 MPa. The electrochemical measurements on the carbon electrodes were performed using a CHI660E electrochemical workstation (CHI660E, Shanghai Chenhua Instrument Co. Ltd.). The standard three-electrode system contained a platinum plate as a counter electrode and saturated calomel electrode as the reference electrode. Cyclic voltammetry (CV) of the three-electrode system was performed in the voltage range of −1 to 0 V (vs. standard calomel electrode) at different scan rates.
For the three-electrode configuration, the specific capacitance of the electrode materials was calculated using eqn (1):
 | (1) |
A symmetric supercapacitor cell was assembled using the fabricated LC-CNF-X as electrode materials and 6 mol L−1 KOH solution as the electrolyte. To prepare the electrodes, LC-CNF-X was ground with acetylene black (10 wt%) and polytetrafluoroethylene (10 wt%), and then pressed onto nickel foam, which served as the current collector. The total mass of each electrode was 0.0040 g, and two electrodes with almost identical weight were selected to assemble the supercapacitor. The NSHPC electrodes fitted with the separator (PP/PE complex film) and electrolyte solution were symmetrically assembled into the electrode/separator/electrode configuration (sandwich-type cells). Cyclic voltammetry (CV) was performed on a CHI660E electrochemical workstation. The rate capability and cycling stability performance were tested using a computer-controlled supercapacitor testing system (NEWARE 5V0.1A, Shenzhen China).
Results and discussion
Structural characterization
Scanning electron microscopy analysis was used to observe the microstructures of LC-CNF-Xs (Fig. 2). It can be seen that the fiber shape of LC-CNF-2 and LC-CNF-3 (Fig. 2b and c, respectively) was maintained after the carbonization and activation processes. Moreover, they show a similar fibrous structure to LC-CNF-0 (Fig. 2a), which has no liquefied carbon. However, with an increase in the content of liquefied carbon, the structure of the nanofibers disappeared, as seen from LC-CNF-4 (Fig. 2d). It is worth noting that the cellulose and hemicellulose in the hemp straw are under the conditions of 160 °C, phenol as a liquefier and phosphoric acid as a catalyst were converted to liquefied carbon, and the degradation of side chain ether bonds (such as the β–O-4 bond) caused hydrolysis, resulting in the formation of some oligosaccharides.28,29 Phenol can react with the small molecules formed by the degradation to form compounds having a phenolic structure, and these small molecule compounds enhance the affinity in the PAN high polymer. Therefore, the liquefied carbon was mixed with a certain mass ratio of PAN, and the nanofiber structure was obtained at the same electric field strength, flow rate, distance from the nozzle to the receiving plate, and environmental parameters.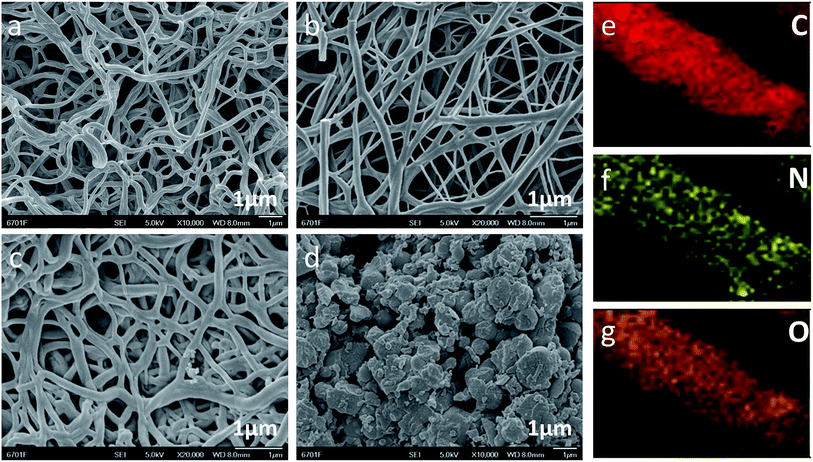 | ||
| Fig. 2 SEM images of (a) LC-CNF-0, (b) LC-CNF-2, (c) LC-CNF-3 and (d) LC-CNF-4. Normal EDX mapping of LC-CNF-3: (e) C element, (f) N element, and (g) O element. | ||
Furthermore, the EDX mapping images demonstrate the distribution of carbon, oxygen, and nitrogen in the carbon fibers. The elemental mapping of LC-CNF-3 is shown in Fig. 2e–g, which demonstrate the uniform distribution of carbon, oxygen, and nitrogen in LC-CNF-3, respectively. We used hemp straw as a precursor for liquefied carbon. It is a type of crop straw, which contains a certain amount of nitrogen. The N element is also derived from PAN, which contains a large amount of N atoms. Thus, clearly, the N element was derived from the hemp straw and the PAN.
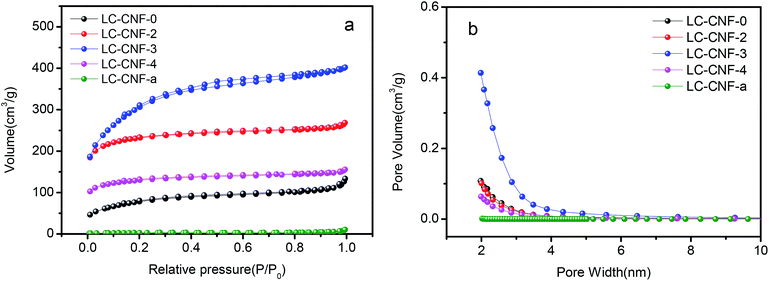
The porosity of LC-CNF-Xs was determined via nitrogen adsorption and desorption measurement at 77 K, as shown in Fig. 3a. The adsorption–desorption curves of all the LC-CNF-Xs belong to the type IV nitrogen adsorption isotherm. The Brunauer–Emmett–Teller (BET) surface areas were calculated to be 28.31, 283.55, 789.89, 1105.53 and 444.03 m2 g−1 for LC-CNF-a, LC-CNF-0, LC-CNF-2, LC-CNF-3 and LC-CNF-4, respectively. According to a previous study,30,31 KOH activation generates micropores and mesopores, which can result in an increase in the specific surface area of the carbon nanofibers. In this study, the specific surface area of LC-CNF-Xs was enhanced greatly after KOH treatment, and LC-CNF-3 had the largest surface area. The pore diameter distribution curves are in accordance with the corresponding N2 isothermal adsorption curves in Fig. 3b. For LC-CNF-a, a narrow pore-size distribution was observed, where its pore diameter was 4.016 nm and pore volume was 0.0284 cm3 g−1 (P/P0 = 0.995). Conversely, for LC-CNF-0, LC-CNF-2, LC-CNF-3 and LC-CNF-4, their pore diameters were 2.544, 2.0351, 2.221 and 2.084 nm and pore volumes were 0.180, 0.402, 0.613 and 0.231 cm3 g−1 (P/P0 = 0.995), respectively. Furthermore, a relatively broad pore-size distribution was observed for LC-CNF-3. These results indicate that the KOH activation changed the porous structure of the nanofibers, and it can clearly be seen that pores were generated in LC-CNF-3. The structure of the micropores and mesopores is conducive to electrical storage and ion transport, and the full contact of the electrolyte and the electrode material, thereby improving the electrochemical performance of the electrode material of the supercapacitor.
The crystal structure of LC-CNF-Xs was further examined via powder XRD, as shown in Fig. 4a. All the samples show diffraction peaks at 25° and 43°, corresponding to the (002) and (100) lattice planes of graphite, respectively, indicating that the materials prepared belong to an amorphous graphite structure.32 Compared with LC-CNF-0, the (002) peak of other samples slightly shifted to a lower angle, indicating a larger interlayer distance of the sample treated by adding liquefied carbon. Raman spectroscopy can provide further conformation to characterize LC-CNF-Xs.
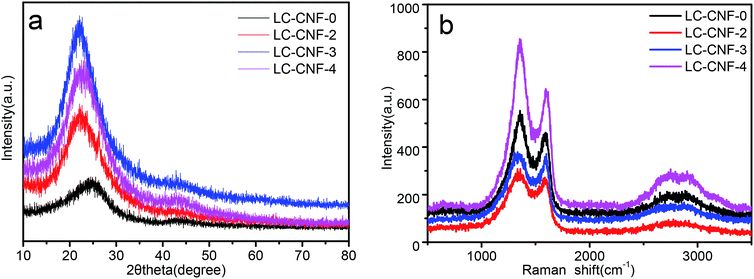 | ||
| Fig. 4 (a) XRD patterns for LC-CNF-0, LC-CNF-2, LC-CNF-3 and LC-CNF-4 and (b) Raman spectra of LC-CNF-0, LC-CNF-2, LC-CNF-3 and LC-CNF-4. | ||
Thus, Raman spectroscopy was performed to investigate the structure of LC-CNF-Xs, as shown in Fig. 4b. All the LC-CNF-X samples show the three typical bands corresponding to the G band (1362 cm−1), D band (1600 cm−1), and 2D band (2809 cm−1). It is well known that the D band represents the existence of a disordered carbon structure, while the G band is associated with the sp2-hybridized carbon in the graphitic structure in a two-dimensional (2D) hexagonal lattice.33 The intensity ratio between the D-band and G-band (ID/IG) is used to determine the degree of graphitization.34 It is associated with the defects between molecular structural units, where the defects in a material provide more electrochemical reaction sites, which greatly affect the surface reaction rate of the material. In this case, the ID/IG of LC-CNF-0, LC-CNF-2, LC-CNF-3 and LC-CNF-4 was ≈1.17, 1.19, 1.18 and 1.20, respectively. This demonstrates that LC-CNF-2, LC-CNF-3 and LC-CNF-4 have a relatively high degree of graphitization in comparison to LC-CNF-0, which agrees well with the XRD results. This shows that after the doping the liquefied carbon, more defects were introduced into the structure, and the structure became more disordered, providing more electrochemical reaction sites.
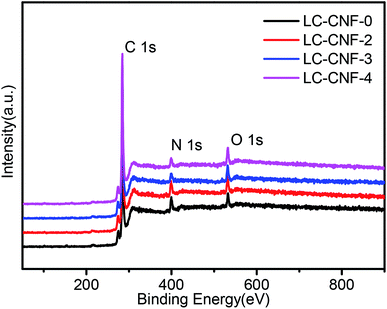
XPS analysis was performed to study the compositions and chemical structures of LC-CNF-Xs. In the XPS survey spectrum of all of the LC-CNF-Xs, C 1s, N 1s, and O 1s were observed, without any impurity (Fig. 5). The relative contents of each element are shown in Table 1. By comparing the results for LC-CNF-0, LC-CNF-2, LC-CNF-3 and LC-CNF-4, the nitrogen content just slightly decreased from 7.74% for LC-CNF-0 to 4.66% for LC-CNF-4, but the oxygen content of the samples slightly increased from 3.41% for LC-CNF-0 to 5.16% for LC-CNF-4. The N element was derived from the hemp straw and PAN. These atoms were maintained after the transformation of PAN and liquefied carbon into LC-CNF-X via the carbonization process. This result is consistent with the EDX mapping. The results are consistent with the elemental analysis, which indicated that during carbonization at high temperature (750–850 °C), the nitrogen species escaped in the form of NO, N2 or NH3.35 Although carbonization caused a slight loss in nitrogen species, it increased the surface area, porosity and graphitization degree of the carbons, which are positive impacts that might influence the electronic conductivity and electrochemical property of N-doped carbons. Further, a slight increase in the oxygen-containing groups indicates that the oxygen-containing functional groups on the surface of the carbon material were introduced on the surface of the carbon fibers.
| Sample | C | O | N |
|---|---|---|---|
| LC-CNF-0 | 88.86 | 3.41 | 7.74 |
| LC-CNF-2 | 87.52 | 5.16 | 7.33 |
| LC-CNF-3 | 90.59 | 4.75 | 4.66 |
| LC-CNF-4 | 89.84 | 4.92 | 5.24 |
Fig. 6 shows the C 1s, O 1s and N 1s XPS spectra of the LC-CNF-X samples. The high-resolution C 1s spectrum exhibits mainly four peaks, which are located at 284.5, 285.9, 286.5 and 288.9 eV, corresponding to graphitic structure (C–C sp2), carbon–oxygen single bonds, carbon–oxygen single bonds (C–O) and carbon–oxygen double bonds (O–C![[double bond, length as m-dash]](https://www.rsc.org/images/entities/char_e001.gif) O).36,37 The C 1s spectra of the samples present similar characteristics, indicating that the addition of liquefied carbon does not have a clear impact on the chemical state of carbon.
O).36,37 The C 1s spectra of the samples present similar characteristics, indicating that the addition of liquefied carbon does not have a clear impact on the chemical state of carbon.
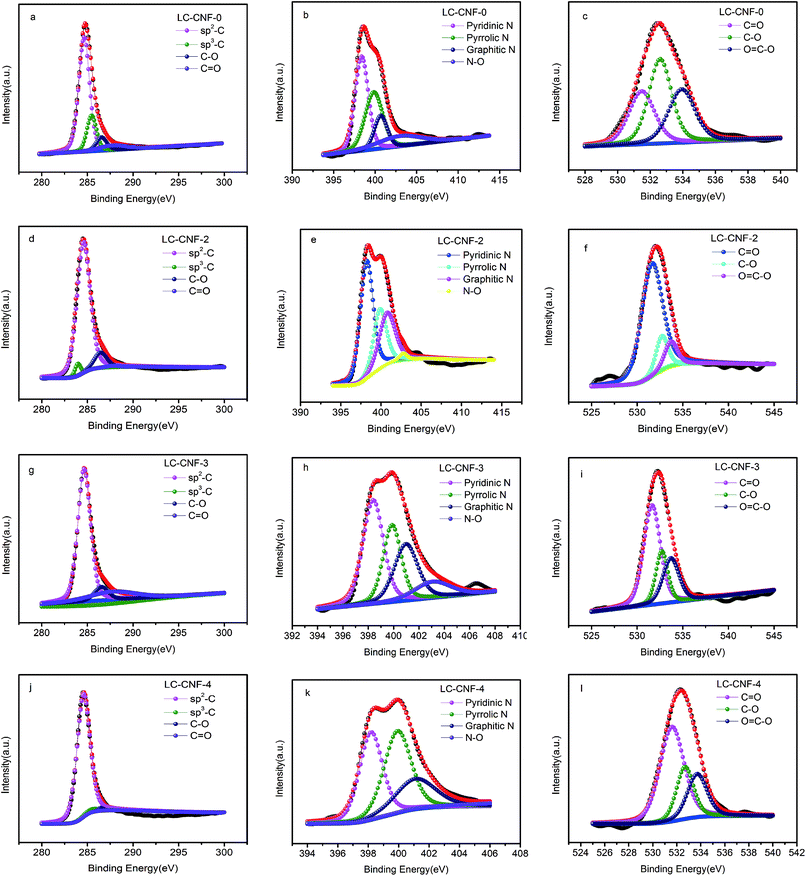 | ||
| Fig. 6 XPS survey spectra of C 1s, O 1s, and N 1s orbitals for LC-CNF-0, LC-CNF-2, LC-CNF-3 and LC-CNF-4. | ||
The O 1s spectra can also be divided into three peaks situated at 531.6, 532.7, and 533.7 eV, corresponding to oxygen double-bonded to carbon (C![[double bond, length as m-dash]](https://www.rsc.org/images/entities/char_e001.gif) O) in quinone-type groups, singly bonded oxygen (–O–) in C–O groups and O
O) in quinone-type groups, singly bonded oxygen (–O–) in C–O groups and O![[double bond, length as m-dash]](https://www.rsc.org/images/entities/char_e001.gif) C–O in carboxyl-type groups, respectively.38
C–O in carboxyl-type groups, respectively.38
The N 1s spectra can also be divided into three peaks situated at 398.5, 399.9, 401.1 and 400.9 eV, which can be attributed to pyridinic N, pyrrolic N, graphitic N and N-oxide (N–O), respectively.39 The proportion of different N compositions that were calculated by the integrated peak area of LC-CNF-Xs is summarized in Table 2. Careful observation shows that the pyridinic N and graphitic N species were predominant in the LC-CNF-2 and LC-CNF-3 samples. In general, the pyridinic N and graphitic N in carbon are regarded as electroactive sites, which are beneficial for the enhancement of electrical conductivity and capacitance.40 Based on the above analysis, the LC-CNF-X sample is expected to be an appealing electrode material for supercapacitors.
| Sample | Pyridinic N | Pyrrolic N | Graphitic N | N–O |
|---|---|---|---|---|
| LC-CNF-0 | 39.83 | 32.41 | 13.50 | 14.26 |
| LC-CNF-2 | 48.49 | 24.04 | 25.96 | 1.51 |
| LC-CNF-3 | 38.96 | 25.57 | 24.59 | 10.88 |
| LC-CNF-4 | 16.31 | 18.03 | 10.03 | 55.88 |
Electrochemical characterization
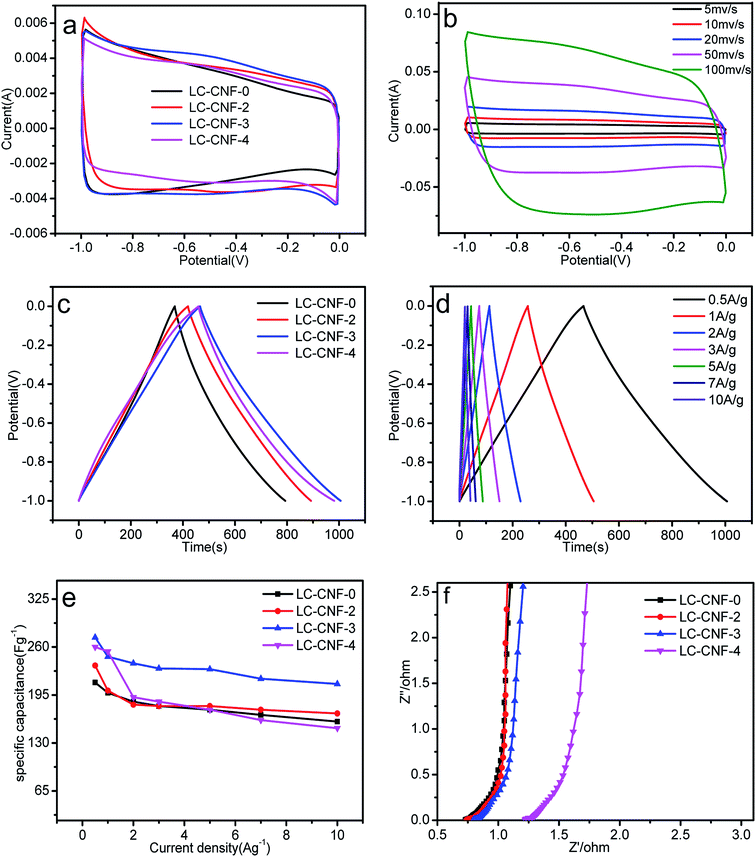
The evaluation of the electrochemical behavior was performed via cyclic voltammetry (CV), galvanostatic charge–discharge (GCD) and electrochemical impedance spectroscopy (EIS) in three- and two-electrode systems.The cyclic voltammetry (CV) curves for the four different LC-CNF-Xs are shown in Fig. 7a, which were tested between −1 to 0 V at 5 mV s−1. Peaks from the Faradaic current were not observed, which reveals that all the LC-CNF-Xs mainly possess double-layer capacitances, and LC-CNF-3 has the largest CV-circulated area with a rectangular shape, and thus it has the highest double-layer capacitance among all the materials.
Fig. 7b shows the CV curves of LC-CNF-3 at different scan rates in the range of 5 mV s−1 to 100 mV s−1 in the potential window from −1 V to 0 V. The CV curves still maintained a rectangular-like shape even at a high scan rate of 100 mV s−1, suggesting its good reversibility.
Fig. 7c shows the galvanostatic charge–discharge curves (GCD) for the LC-CNF-Xs at a current density of 0.5 A g−1. All the samples displayed the typical capacitor triangle shapes. The linear curves with symmetrical charge and discharge lines indicate good capacitive behavior. According to eqn (1), the calculated specific capacitances in terms of the charge–discharge curves are 106, 235, 273, and 260 F g−1 for LC-CNF-0, LC-CNF-2, LC-CNF-3 and LC-CNF-4, respectively. LC-CNF-3 has the highest value, and thus its capacitance performance is the best, which is consistent with the CV curves. This is also consistent with the previous structural analysis, which indicated it has the best pore distribution. Although LC-CNF-4 has a similar specific capacitance to LC-CNF-3, it lost the nanofiber structure, which can be observed in the electron microscopy images.
The GCD curves of LC-CNF-3 at different current densities ranging from 0.5 A g−1 to 10 A g−1 are shown in Fig. 7d. For all the current densities, the charge–discharge curves of LC-CNF-3 maintained the shape of a nearly symmetrical triangle, which is in consistent with the CV measurements. The excellent capacitive behavior of LC-CNF-3 was further verified by varying the current density in the GCD measurements.
The specific capacitance of the samples at different current densities is shown in Fig. 7e. It can be seen that the current density of LC-CNF-3 is 273 F g−1 at 0.5 A g−1 and 210 F g−1 even at 10 A g−1, with a retention rate of up to 76.9%, which means it maintained excellent stability throughout the charge–discharge test. The other samples displayed a similar changing trend with an increase in the charge–discharge current density; however, their specific capacitance was lower than that of LC-CNF-3 at the same current density. So, we know that there is an optimal ratio of liquefied carbon. Furthermore, the specific capacitance of LC-CNF-4 was found to be 260 F g−1 at 0.5 A g−1, but it did not have good stability.
EIS measurements were performed to further understand the effect of the addition of liquefied carbon on the performance enhancement. The Nyquist plots of the all samples are presented in Fig. 7f. All four samples exhibit a small semicircle over the high-frequency region. It is known that the radius of the semicircle over the high-frequency region corresponds to the charge transfer resistance (Rct). The curves of these samples tended to be straight in the low frequency region, which means the slope tended to 90°, where the slope of the straight line is related to the diffusive resistance. The nearly vertical line in the low frequency region represents the diffusion resistance (W) of the electrolyte in the porous structure.41 Although the EIS of LC-CNF-3 was not the best, it still has a small radius in the high frequency region, and thus it can facilitate the quick diffusion of electrolyte ions.
In order to explore the practicality of the LC-CNF-Xs, a symmetric capacitor device as an all-solid-state supercapacitor device was fabricated with two identical LC-CNF-3 electrodes (denoted as LC-CNF-3//LC-CNF-3).
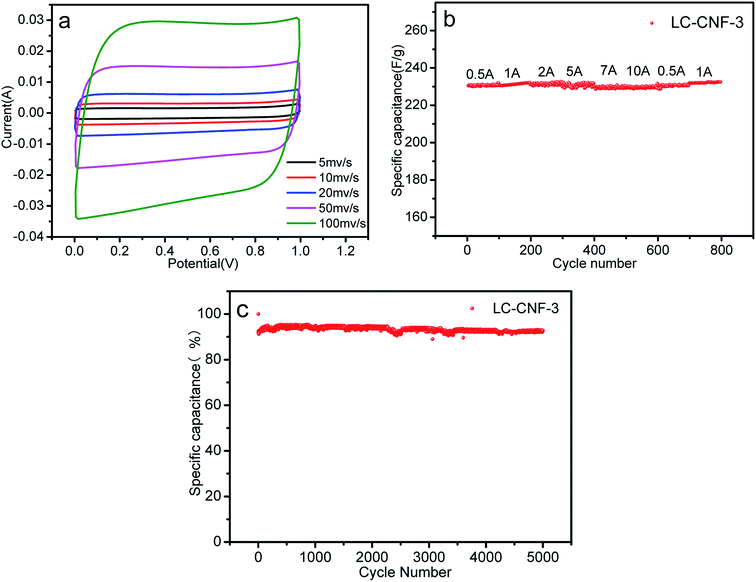
Fig. 8a presents the CV curves of the LC-CNF-3//LC-CNF-3 device at various scan rates ranging from 5 to 100 mV s−1 between 0 and 1 V. Obviously, the CV curves still maintained good symmetrically rectangular shapes, indicating that the LC-CNF-3 device has good supercapacitance characteristics at different scanning speeds.42,43 Meanwhile, the symmetrical rectangular shapes of the CV curves were still well maintained under a high scan rate of 100 mV s−1, indicating the excellent power capability of the fabricated electrode materials.
The good rate capability of the LC-CNF-3 electrodes also is presented in Fig. 8b, where the specific capacitance of the LC-CNF-3 electrode slowly decreased and about 99% of the capacitance was retained as the current density increased from 0.5 to 10 A g−1. Moreover, the capacitance of the LC-CNF-3 electrode returned to its original value when the current density was reversed from 10 to 0.5 A g−1, suggesting its good structural stability.
The very satisfactory cycle stability of the LC-CNF-3 cell is revealed in Fig. 8c. After 5000 charge–discharge cycles, the capacitance retention of the LC-CNF-3 cell reached up to 92.76%, demonstrating that its excellent cycle performances were still maintained. From the above results, LC-CNF-3 developed in this study can be applied as an electrode material for high-performance liquid and all-solid-state supercapacitors.
Conclusion
In summary, a facile and sustainable approach involving the electrospinning a mixture of liquefied carbon and polyacrylonitrile, in which the liquefied carbon was prepared in the presence of phenol as a liquefier and phosphoric acid as a catalyst, and subsequent KOH treatment and carbonization process was used to fabricate liquefied carbon-based nanofibers using a renewable hemp straw as the raw material. The electrode materials for supercapacitors exhibited a large capacitance, excellent rate capability and satisfactory cycle stability. More importantly, the proposed strategy also fully utilizes an abundant renewable resource, freely available in nature to produce high-performance electrode materials for supercapacitors.Conflicts of interest
The authors declare no conflicts of interest.Acknowledgements
This work was supported by the National Natural Science Foundation of China (21567015), the National Key Research and Development Program of China (2016YFC0202900), Lanzhou University of Technology Hongliu First-class Discipline Construction Program (Support) and Lanzhou University of Technology Hongliu Science Fund for Young Scholars (2018 Support).References
- D. Qi, Y. Liu, Z. Liu, L. Zhang and X. Chen, Adv. Mater., 2017, 5 DOI:10.1002/adma.201602802.
- M. F. El-Kady, V. Strong, S. Dubin and R. B. Kaner, Science, 2012, 6074, 99–123 Search PubMed.
- M. Höök and X. Tang, Energy Policy, 2013, 1, 797–809 CrossRef.
- W. Guoping, Z. Lei and Z. Jiujun, Chem. Soc. Rev., 2012, 2, 797–828 Search PubMed.
- D. S. Su and R. Schlögl, ChemSusChem, 2010, 2, 136–168 CrossRef PubMed.
- B. Zhang, F. Kang, J. M. Tarascon and J. K. Kim, Prog. Mater. Sci., 2015, 319–380 Search PubMed.
- P. Srinivasu, A. Islam, S. P. Singh, L. Han, M. L. Kantam and S. K. Bhargava, J. Mater. Chem., 2012, 39, 20866–20869 RSC.
- G. B. Zheng, K. Kouda, H. Sano, Y. Uchiyama, Y. F. Shi and H. J. Quan, Carbon, 2004, 3, 635–640 CrossRef.
- W. Li, Y. Guo and L. Chen, J. Nanosci. Nanotechnol., 2006, 12, 3775–3779 CrossRef PubMed.
- J. Qian, M. Zhang, I. Manners and M. A. Winnik, Trends Biotechnol., 2010, 2, 84–92 CrossRef PubMed.
- G. Nagaraju, C. N. Tharamani, G. T. Chandrappa and J. Livage, Nanoscale Res. Lett., 2007, 9, 57–75 Search PubMed.
- A. A. Ali and M. A. El-Hamid, Composites, Part A, 2006, 10, 1681–1687 CrossRef.
- L. Zhang, A. Aboagye, A. Kelkar, C. Lai and F. Hao, J. Mater. Sci., 2014, 2, 463–480 CrossRef.
- J. Xu, L. Zhang, G. Xu, Z. Sun, C. Zhang, X. Ma, C. Qi, L. Zhang and D. Jia, Appl. Surf. Sci., 2018, S1052468913 Search PubMed.
- T. H. Cho, M. Tanaka, H. Onishi, Y. Kondo, T. Nakamura, H. Yamazaki, S. Tanase and T. Sakai, J. Power Sources, 2008, 1, 155–160 CrossRef.
- N. W. S. Wan and A. F. Ismail, AIChE J., 2012, 10, 3167–3175 Search PubMed.
- U. K. Fatema, C. Tomizawa, M. Harada and Y. Gotoh, Carbon, 2011, 6, 2158–2161 CrossRef.
- A. Demirbaş, Energy Convers. Manage., 2000, 15, 1601–1607 CrossRef.
- F. P. Petrocelli and M. T. Klein, Ind. Eng. Chem. Process Des. Dev., 1985, 4, 635–641 Search PubMed.
- M. H. Alma, M. Yoshioka, Y. Yao and N. Shiraishi, J. Appl. Polym. Sci., 2015, 4, 675–683 Search PubMed.
- Q. Zhang, G. Zhao and S. Jie, For. Stud. China, 2004, 3, 50–54 CrossRef.
- L. Lin, Y. Yao, M. Yoshioka and N. Shiraishi, Carbohydr. Polym., 2004, 2, 123–129 CrossRef.
- A. Demirbaş, Energy Convers. Manage., 2000, 6, 633–646 CrossRef.
- W. Lu, M. Sevilla, A. B. Fuertes, R. Mokaya and G. Yushin, Adv. Energy Mater., 2011, 3, 356–361 Search PubMed.
- L. Lin, M. Yoshioka, Y. Yao and N. Shiraishi, J. Appl. Polym. Sci., 1994, 11, 1629–1636 CrossRef.
- L. Lin, M. Yoshioka, Y. Yao and N. Shiraishi, J. Appl. Polym. Sci., 1995, 8, 1297–1304 CrossRef.
- Y. Zhu, S. Murali, M. D. Stoller, K. J. Ganesh, W. Cai, P. J. Ferreira, A. Pirkle, R. M. Wallace, K. A. Cychosz and M. Thommes, Science, 2011, 6037, 205–216 Search PubMed.
- X. J. Sui and S. B. Wu, Adv. Mater. Res., 2012, 6, 383–390 Search PubMed.
- J. Huang, L. Chao, W. Dan, T. Hong and L. Ren, J. Anal. Appl. Pyrolysis, 2014, 98–108 CrossRef.
- J. Naeyoung, K. Soongeun, L. Dongwook, Y. Dong-Myung, P. Young Min, B. Anass, C. Jae-Young and P. Jong Se, Adv. Mater., 2013, 47, 6854–6858 Search PubMed.
- Z. Yang, A. Yongde Xia and R. Mokaya, J. Am. Chem. Soc., 2007, 6, 1673–1679 CrossRef PubMed.
- O. U. Yu-Jing, P. Chao, J. W. Lang, D. D. Zhu and X. B. Yan, New Carbon Mater., 2014, 3, 209–215 Search PubMed.
- L. Wang, G. Mu, C. Tian, L. Sun, W. Zhou, P. Yu, J. Yin and H. Fu, Chemsuschem, 2013, 5, 880–889 CrossRef PubMed.
- L. Cheng, H. H. Yu, J. W. Yong, J. Li and P. C. Ji, J. Power Sources, 2018, 9–16 Search PubMed.
- B. Zhang, Y. Yang, Z. L. Xu, S. Abouali, M. Akbari, Y. B. He, F. Kang and J. K. Kim, Adv. Energy Mater., 2014, 7 DOI:10.1002/aenm.201301448.
- L. Hao, X. Li and L. Zhi, Adv. Mater., 2013, 28, 3899–3904 CrossRef PubMed.
- B. Xu, S. Yue, Z. Sui, X. Zhang, S. Hou, G. Cao and Y. Yang, Energy Environ. Sci., 2011, 8, 2826–2830 RSC.
- J. L. Figueiredo, M. F. R. Pereira, M. M. A. Freitas and J. J. M. Órfão, Carbon, 1999, 9, 1379–1389 CrossRef.
- R. J. J. Jansen and H. V. Bekkum, Carbon, 1995, 8, 1021–1027 CrossRef.
- L. Qing, X. Ping, G. Wei, M. Shuguo, Z. Guoqi, C. Ruiguo, C. Jaephil, W. Hsing-Lin and W. Gang, Adv. Mater., 2014, 9, 1378–1386 Search PubMed.
- L. Chen, T. Ji, L. Brisbin and J. Zhu, ACS Appl. Mater. Interfaces, 2015, 22, 617–632 Search PubMed.
- C. Vix-Guterl, S. Saadallah, K. Jurewicz, E. Frackowiak, M. Reda, J. Parmentier, J. Patarin and F. Beguin, Mater. Sci. Eng., B, 2004, 1, 148–155 CrossRef.
- Z. Y. Li, M. S. Akhtar and O. B. Yang, J. Alloys Compd., 2015, 212–218 CAS.
Footnote |
| † Electronic supplementary information (ESI) available. See DOI: 10.1039/c9ra03361k |
| This journal is © The Royal Society of Chemistry 2019 |


