 Open Access Article
An aggregation-induced emission-based fluorescence turn-on probe for Hg2+ and its application to detect Hg2+ in food samples†
Lijun Tang *a,
Haili Yua,
Keli Zhong
 a,
Xue Gaob and
Jianrong Li
 *b
*b
aCollege of Chemistry and Chemical Engineering, Bohai University, Jinzhou, 121013, China. E-mail: ljtang@bhu.edu.cn
bCollege of Food Science and Technology, Bohai University, National & Local Joint Engineering Research Center of Storage, Processing and Safety Control Technology for Fresh Agricultural and Aquatic Products, The Fresh Food Storage and Processing Technology Research Institute of Liaoning Provincial Universities, Jinzhou, 121013, China. E-mail: lijr6491@163.com
First published on 29th July 2019
Abstract
In this work, we presented a new tetraphenylethene-derived fluorescent probe TPE-M for Hg2+ detection in an aqueous solution. Probe TPE-M is molecularly dissolved in CH3OH/PBS (20 mM, pH = 7.4) (3![[thin space (1/6-em)]](https://www.rsc.org/images/entities/char_2009.gif) :
:![[thin space (1/6-em)]](https://www.rsc.org/images/entities/char_2009.gif) 7, v/v) mixed solution and is almost non-emissive. Reaction of TPE-M with Hg2+ leads to release of an AIE-active precursor 4, and results in a significant fluorescence enhancement. The Hg2+ recognition process has some distinct advantages including rapid response, high selectivity and sensitivity, strong anti-interference ability, and a low detection limit (4.16 × 10⁻⁶ M). Moreover, the probe is applicable to detect Hg2+ in real food samples such as shrimp, crab and teas, suggesting the practical applicability of TPE-M.
7, v/v) mixed solution and is almost non-emissive. Reaction of TPE-M with Hg2+ leads to release of an AIE-active precursor 4, and results in a significant fluorescence enhancement. The Hg2+ recognition process has some distinct advantages including rapid response, high selectivity and sensitivity, strong anti-interference ability, and a low detection limit (4.16 × 10⁻⁶ M). Moreover, the probe is applicable to detect Hg2+ in real food samples such as shrimp, crab and teas, suggesting the practical applicability of TPE-M.
Introduction
Mercury ion (Hg2+), as a notorious toxic heavy metal ion, possesses significant influence on human health by accumulating in the body along with the skin, respiratory tract and food chain.1 Hg2+ accumulation in the food chain is harmful to DNA and the central nervous system.2,3 Therefore, effective detection of Hg2+ is of great significance.So far, several effective methods for Hg2+ detection, including liquid chromatography (LC),4 atomic absorption spectrometry (AAS),5 atomic fluorescence spectrometry (AFS),6 and inductively coupled plasma-mass spectrometry (ICP-MS)7 have been established. However, these methods usually require expensive instruments, complicated sample preparations, tedious detection processes, and relatively professional operation techniques. Compared with the aforementioned methods, fluorescence techniques have received considerable attention due to their advantages such as simple operation, rapid response, high selectivity and sensitivity.8–12 During the past few decades, a large number of Hg2+ selective fluorescent probes have been documented.13–18 There are mainly two strategies for the design of fluorescent Hg2+ probes. One design method is based on Hg2+-chelation induced fluorescence changes of the probe,19–21 however, some probes based on this strategy are prone to suffer from the interference of other metal ions (Cu2+, Co2+, Fe2+, and Pb2+),22–25 or fluorescence quenching due to the heavy atom effect induced by the Hg2+ ion.26–29 Another methodology is based on Hg2+-triggered specific reaction of the probe.30–34 Compared with the chelation method, the specific chemical reactions triggered by Hg2+ can lead to unique spectral changes in fluorescence or absorbance, which makes the probes more advantageous in terms of selectivity and sensitivity. Whereas, the latter protocol sometimes may be affected by the aggregation-caused quenching (ACQ) effect of the reaction product with hydrophobic nature.35,36 The discovery of aggregation-induced emission (AIE) phenomenon37 provides an opportunity to address this limitation. Although there are some fluorescent Hg2+ probes based on AIE mechanism have been documented,24,38–45 development of new AIE-based fluorescent Hg2+ probes with high selectivity and rapid response is still highly desirable.
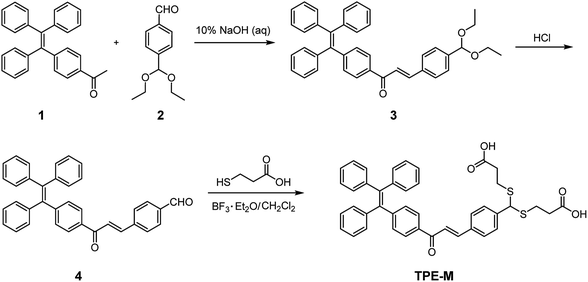
Tetraphenylethene (TPE) is a well-known AIE-active luminogen, and a great number of TPE-based derivatives with distinct AIE properties have been established. However, the TPE aggregates have shorter emission wavelengths, and TPE-based fluorescent Hg2+ probes are still rare. One can envision that by extending the conjugation structure and incorporate a dithioacetal group on a TPE-based fluorogen, a new Hg2+ selective fluorescent probe with red-shifted emission based on AIE mechanism can be obtained. We herein synthesized a new TPE-derived Hg2+ selective fluorescent probe TPE-M by condensation of TPE-derived aldehyde 4 and 3-mercaptopropionic acid (Scheme 1). It is surmised that the Hg2+-triggered hydrolysis of dithioacetal in TPE-M will release its precursor 4, a potentially AIE-active compound, and thus can realize Hg2+ detection in an aqueous medium. The carboxylic acid-containing dithioacetal moiety doped in probe TPE-M can provide Hg2+ recognition site and enable good solubility of TPE-M in aqueous solution. Further studies demonstrate that probe TPE-M can detect Hg2+ in CH3OH/PBS mixed solvent based on AIE mechanism.
Experimental section
Materials and instruments
Unless otherwise specified, solvents and reagents were of analytical grade from commercial suppliers and used directly. Compound 1 (ref. 46) was synthesized according to literature method. 1H NMR and 13C NMR spectra were measured on an Agilent 400-MR spectrometer. High resolution mass spectroscopy (HRMS) was recorded on an Agilent 1200 time-of-flight mass spectrometer (Bruker, microTOF-Q). Fluorescence measurements were performed on a Sanco 970-CRT spectrofluorometer (Shanghai, China). Dynamic light scattering (DLS) experiments were performed with a Malvern Zetasizer Nano-ZS90 DLS system (Malvern Instruments Ltd., Worcestershire, UK).General procedure for spectroscopic analysis
Double distilled water was used throughout the experiments. Probe TPE-M was dissolved in CH3OH/PBS (20 mM, pH = 7.4) (3![[thin space (1/6-em)]](https://www.rsc.org/images/entities/char_2009.gif) :
:![[thin space (1/6-em)]](https://www.rsc.org/images/entities/char_2009.gif) 7, v/v) to afford the test solution (10 μM). Titration experiments were performed in 10 mm quartz cuvettes at 25 °C. Metal ions (as chloride or nitrate salts, 10 mM) were added to the host solution and used for the titration experiment.
7, v/v) to afford the test solution (10 μM). Titration experiments were performed in 10 mm quartz cuvettes at 25 °C. Metal ions (as chloride or nitrate salts, 10 mM) were added to the host solution and used for the titration experiment.
Synthesis
![[thin space (1/6-em)]](https://www.rsc.org/images/entities/char_2009.gif) :
:![[thin space (1/6-em)]](https://www.rsc.org/images/entities/char_2009.gif) 30, v/v) to give 3 as a yellow solid (1.35 g, yield 48%). Mp 49.9–51.8 °C. 1H NMR (400 MHz, DMSO-d6) δ 7.94 (d, J = 8.0 Hz, 2H), 7.90–7.85 (m, 3H), 7.70 (d, J = 15.6 Hz, 1H), 7.45 (d, J = 8.4 Hz, 2H), 7.18–7.12 (m, 11H), 7.02–6.98 (m, 6H), 5.52 (s, 1H), 3.59–3.45 (m, 4H), 1.15 (t, J = 7.0 Hz, 6H); 13C NMR (100 MHz, DMSO-d6) δ 188.7, 148.7, 143.8, 143.2, 143.0, 142.5, 142.0, 140.1, 135.8, 135.0, 131.5, 131.1, 131.0, 129.1, 128.6, 128.4, 128.3, 127.4, 127.3, 122.4, 100.9, 61.3, 15.6. HRMS (ESI+): calcd for C40H37O3 [M + H]+, 565.2743; found: 565.2972.
30, v/v) to give 3 as a yellow solid (1.35 g, yield 48%). Mp 49.9–51.8 °C. 1H NMR (400 MHz, DMSO-d6) δ 7.94 (d, J = 8.0 Hz, 2H), 7.90–7.85 (m, 3H), 7.70 (d, J = 15.6 Hz, 1H), 7.45 (d, J = 8.4 Hz, 2H), 7.18–7.12 (m, 11H), 7.02–6.98 (m, 6H), 5.52 (s, 1H), 3.59–3.45 (m, 4H), 1.15 (t, J = 7.0 Hz, 6H); 13C NMR (100 MHz, DMSO-d6) δ 188.7, 148.7, 143.8, 143.2, 143.0, 142.5, 142.0, 140.1, 135.8, 135.0, 131.5, 131.1, 131.0, 129.1, 128.6, 128.4, 128.3, 127.4, 127.3, 122.4, 100.9, 61.3, 15.6. HRMS (ESI+): calcd for C40H37O3 [M + H]+, 565.2743; found: 565.2972.![[thin space (1/6-em)]](https://www.rsc.org/images/entities/char_2009.gif) :
:![[thin space (1/6-em)]](https://www.rsc.org/images/entities/char_2009.gif) 20, v/v) to obtain 4 as pale yellow solids (890.47 mg, yield 82%). Mp 206.7–207.8 °C. 1H NMR (400 MHz, DMSO-d6) δ 10.04 (s, 1H), 8.09 (d, J = 8.0 Hz, 2H), 8.05 (d, J = 15.6 Hz, 1H), 7.98–7.95 (m, 4H), 7.76 (d, J = 15.6 Hz, 1H), 7.19–7.12 (m, 11H), 7.03–6.99 (m, 6H); 13C NMR (100 MHz, DMSO-d6) δ 193.1, 188.6, 149.0, 143.2, 143.1, 143.0, 142.5, 140.7, 140.1, 137.4, 135.5, 131.6, 131.1, 131.0, 130.3, 129.9, 128.7, 128.4, 128.3, 127.4, 127.3, 125.2. HRMS (ESI−): calcd for C36H29O4 [M + 2H2O–H]−, 525.2066; found: 525.1789.
20, v/v) to obtain 4 as pale yellow solids (890.47 mg, yield 82%). Mp 206.7–207.8 °C. 1H NMR (400 MHz, DMSO-d6) δ 10.04 (s, 1H), 8.09 (d, J = 8.0 Hz, 2H), 8.05 (d, J = 15.6 Hz, 1H), 7.98–7.95 (m, 4H), 7.76 (d, J = 15.6 Hz, 1H), 7.19–7.12 (m, 11H), 7.03–6.99 (m, 6H); 13C NMR (100 MHz, DMSO-d6) δ 193.1, 188.6, 149.0, 143.2, 143.1, 143.0, 142.5, 140.7, 140.1, 137.4, 135.5, 131.6, 131.1, 131.0, 130.3, 129.9, 128.7, 128.4, 128.3, 127.4, 127.3, 125.2. HRMS (ESI−): calcd for C36H29O4 [M + 2H2O–H]−, 525.2066; found: 525.1789.![[thin space (1/6-em)]](https://www.rsc.org/images/entities/char_2009.gif) :
:![[thin space (1/6-em)]](https://www.rsc.org/images/entities/char_2009.gif) 30, v/v) to obtain TPE-M as orange yellow solid (547.23 mg, yield 49%). Mp 74.1–75.2 °C. 1H NMR (400 MHz, DMSO-d6) δ 12.32 (br, 2H), 7.94 (d, J = 8.0 Hz, 2H), 7.90–7.85 (m, 3H), 7.69 (d, J = 15.2 Hz, 1H), 7.49 (d, J = 8.4 Hz, 2H), 7.16–7.14 (m, 11H), 7.03–6.99 (m, 6H), 5.32 (s, 1H), 2.78–2.71 (m, 2H), 2.67–2.61 (m, 2H) (proton signals for two CH2 groups are overlapped with the peak of residue DMSO); 13C NMR (100 MHz, DMSO-d6) δ 188.6, 173.3, 148.7, 143.6, 143.2, 143.0, 142.5, 140.1, 135.8, 134.6, 131.5, 131.1, 131.0, 129.6, 128.6, 128.4, 128.3, 127.4, 127.3, 122.5, 51.9, 34.5, 27.5. HRMS (ESI+): calcd for C42H36NaO5S2 [M + Na]+, 707.1902; found: 707.1011.
30, v/v) to obtain TPE-M as orange yellow solid (547.23 mg, yield 49%). Mp 74.1–75.2 °C. 1H NMR (400 MHz, DMSO-d6) δ 12.32 (br, 2H), 7.94 (d, J = 8.0 Hz, 2H), 7.90–7.85 (m, 3H), 7.69 (d, J = 15.2 Hz, 1H), 7.49 (d, J = 8.4 Hz, 2H), 7.16–7.14 (m, 11H), 7.03–6.99 (m, 6H), 5.32 (s, 1H), 2.78–2.71 (m, 2H), 2.67–2.61 (m, 2H) (proton signals for two CH2 groups are overlapped with the peak of residue DMSO); 13C NMR (100 MHz, DMSO-d6) δ 188.6, 173.3, 148.7, 143.6, 143.2, 143.0, 142.5, 140.1, 135.8, 134.6, 131.5, 131.1, 131.0, 129.6, 128.6, 128.4, 128.3, 127.4, 127.3, 122.5, 51.9, 34.5, 27.5. HRMS (ESI+): calcd for C42H36NaO5S2 [M + Na]+, 707.1902; found: 707.1011.Result and discussion
AIE properties of intermediate 4
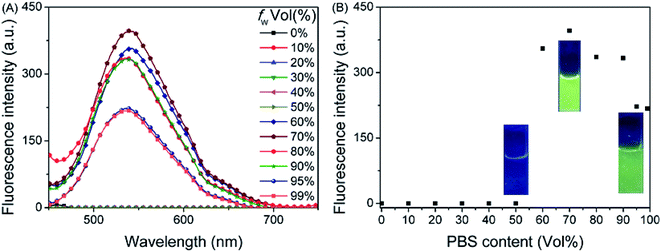
Based on the probe design principle, namely, probe TPE-M undergoes Hg2+-triggered hydrolysis to release AIE-active compound 4, the AIE characteristic of compound 4 was firstly examined. The changes in fluorescence behavior of 4 was examined in a mixed solvent of CH3OH/PBS (20 mM, pH = 7.4) with different PBS contents (fw) (Fig. 1). Compound 4 is non-emissive when fw ranging from 0 to 50%. On further increase fw to 60–70%, a greatly enhanced emission band centered at 537 nm can be observed. Further increase of fw leads to partial fluorescence quenching. When illuminate the solution of 4 in CH3OH/PBS (20 mM, pH = 7.4) (3![[thin space (1/6-em)]](https://www.rsc.org/images/entities/char_2009.gif) :
:![[thin space (1/6-em)]](https://www.rsc.org/images/entities/char_2009.gif) 7, v/v) with a laser pointer, an obvious light path can be observed (Fig. S1†), indicating that compound 4 form aggregates. Dynamic light scattering (DLS) measurements showed an average particle size of 412 nm in diameter (Fig. S2†), indicating the formation of nano-aggregates of compound 4.
7, v/v) with a laser pointer, an obvious light path can be observed (Fig. S1†), indicating that compound 4 form aggregates. Dynamic light scattering (DLS) measurements showed an average particle size of 412 nm in diameter (Fig. S2†), indicating the formation of nano-aggregates of compound 4.
Fluorescence recognition of TPE-M to Hg2+
Promoted by the AIE property of compound 4, we then explored the response of probe TPE-M toward Hg2+ ions in CH3OH/PBS (20 mM, pH = 7.4) (3![[thin space (1/6-em)]](https://www.rsc.org/images/entities/char_2009.gif) :
:![[thin space (1/6-em)]](https://www.rsc.org/images/entities/char_2009.gif) 7, v/v). In order to examine the solubility of TPE-M in the mixed solvent, the relationship between absorbance and probe concentration ranging from 4 to 14 μM was first investigated (Fig. S3†). The results provide a good linear relationship (R2 > 0.99) between absorbance and probe concentration, demonstrating that all probes are molecularly dissolved. Then we detected the fluorescence response of probe TPE-M (10 μM) to different concentrations of Hg2+. As shown in Fig. 2, a gradually enhanced fluorescence emission band centered at 538 nm was observed upon stepwise addition of Hg2+ to the probe solution, and the fluorescence intensity leveled off after 1.5 equiv. of Hg2+ was used. The observed emission wavelength is quite similar to that of 4 in CH3OH/PBS (20 mM, pH = 7.4) (3
7, v/v). In order to examine the solubility of TPE-M in the mixed solvent, the relationship between absorbance and probe concentration ranging from 4 to 14 μM was first investigated (Fig. S3†). The results provide a good linear relationship (R2 > 0.99) between absorbance and probe concentration, demonstrating that all probes are molecularly dissolved. Then we detected the fluorescence response of probe TPE-M (10 μM) to different concentrations of Hg2+. As shown in Fig. 2, a gradually enhanced fluorescence emission band centered at 538 nm was observed upon stepwise addition of Hg2+ to the probe solution, and the fluorescence intensity leveled off after 1.5 equiv. of Hg2+ was used. The observed emission wavelength is quite similar to that of 4 in CH3OH/PBS (20 mM, pH = 7.4) (3![[thin space (1/6-em)]](https://www.rsc.org/images/entities/char_2009.gif) :
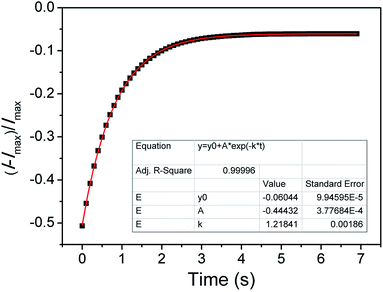
:![[thin space (1/6-em)]](https://www.rsc.org/images/entities/char_2009.gif) 7, v/v), suggesting the formation of aggregates of 4. DLS analysis of the Hg2+-treated TPE-M solution revealed the formation of aggregates with an average particle size of 419 nm (Fig. S4†), which is in good agreement with the DLS data of compound 4 solution. The titration results indicate that probe TPE-M has good sensing characteristics for Hg2+. Based on the titration curve, a satisfactory linear relationship (R2 > 0.99) was obtained between the emission intensity (at 538 nm) and Hg2+ concentration (0 to 15 μM) (Fig. S5†). The detection limit of probe TPE-M for Hg2+ was estimated to be 4.157 × 10⁻⁶ M on the basis of signal to noise method (LOD = 3σ/k, σ is the standard deviation of the blank solution; k is the slope of the calibration curve). Time-course study shows that the response of probe TPE-M to Hg2+ (1.5 equiv.) is rapid and can be completed within 4 seconds (Fig. 3). The pseudo first-order reaction rate constant k is calculated to be 1.218 s−1 according to the equation It = Imax + A × exp(−k × t) (It is the emission intensity at 538 nm at time t, and Imax is the maximum emission intensity at 538 nm),47 indicating that probe TPE-M has potential real-time detection capability for Hg2+ ions.
7, v/v), suggesting the formation of aggregates of 4. DLS analysis of the Hg2+-treated TPE-M solution revealed the formation of aggregates with an average particle size of 419 nm (Fig. S4†), which is in good agreement with the DLS data of compound 4 solution. The titration results indicate that probe TPE-M has good sensing characteristics for Hg2+. Based on the titration curve, a satisfactory linear relationship (R2 > 0.99) was obtained between the emission intensity (at 538 nm) and Hg2+ concentration (0 to 15 μM) (Fig. S5†). The detection limit of probe TPE-M for Hg2+ was estimated to be 4.157 × 10⁻⁶ M on the basis of signal to noise method (LOD = 3σ/k, σ is the standard deviation of the blank solution; k is the slope of the calibration curve). Time-course study shows that the response of probe TPE-M to Hg2+ (1.5 equiv.) is rapid and can be completed within 4 seconds (Fig. 3). The pseudo first-order reaction rate constant k is calculated to be 1.218 s−1 according to the equation It = Imax + A × exp(−k × t) (It is the emission intensity at 538 nm at time t, and Imax is the maximum emission intensity at 538 nm),47 indicating that probe TPE-M has potential real-time detection capability for Hg2+ ions.
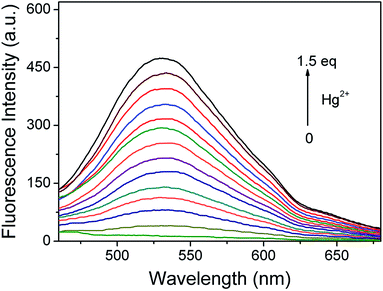 | ||
Fig. 2 Changes of fluorescence spectrum of probe TPE-M (10 μM) in CH3OH/PBS (20 mM, pH = 7.4) (3![[thin space (1/6-em)]](https://www.rsc.org/images/entities/char_2009.gif) : :![[thin space (1/6-em)]](https://www.rsc.org/images/entities/char_2009.gif) 7, v/v) on incremental addition of Hg2+ (0–15 μM). λex = 395 nm. 7, v/v) on incremental addition of Hg2+ (0–15 μM). λex = 395 nm. | ||
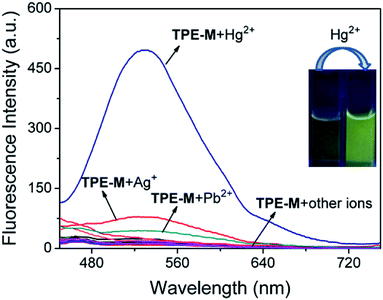
In order to further confirm the selectivity of probe TPE-M to Hg2+, the fluorescence spectra of probe TPE-M in the presence of different metal ions (including Cu2+, Co2+, Zn2+, Cd2+, Cr3+, Fe3+, Sr2+, Na+, Hg2+, Ag+, Pb2+, Mn2+, Al3+, K+, Ni2+, Ba2+, Mg2+, Fe2+ and Ca2+, 1.5 equiv. for each metal ion) were subsequently explored (Fig. 4). Except for Hg2+, other tested metal ions caused a minor or negligible fluorescence enhancement. It is noteworthy that addition of Ag+ or Pb2+ also elicits a slight fluorescence enhancement at 538 nm. The Ag+-induced fluorescence enhancement can be attributed to the Ag+-triggered hydrolysis of probe TPE-M, which is similar to our previous result.44 Since Ag+ and Cl− are prone to form insoluble AgCl, no Ag+ ion at the micromole level can be found under physiological conditions (containing Cl− ions at the millimole level). The Pb2+-induced emission enhancement is most likely due to the Pb2+-triggered hydrolysis of TPE-M because of the sulfophilic property of Pb2+ ions.48,49 Whereas, compared with the effect of Hg2+, the emission enhancement induced by Ag+ and Pb2+ are very weak. Therefore, the results suggest that probe TPE-M has excellent selectivity for Hg2+ over other tested metal ions.
To get insight into the practical applicability of probe TPE-M, competitive experiments were them performed (Fig. 5). As shown in the Fig. 5, other coexisting metal ions did not significantly interfere with the recognition of Hg2+. We also investigated the effect of pH on the fluorescence intensity changes of TPE-M with and without Hg2+ (Fig. 6). Under alkaline conditions, significant fluorescence quenching of TPE-M + Hg2+ was observed, which may attributed to the generation of mercuric oxide coming from the reaction between OH− and Hg2+,50 this reaction prevented the Hg2+-triggered hydrolysis of dithioacetal group in the probe. The results show that probe TPE-M is suitable to detect Hg2+ under near neutral and weak alkaline conditions with pH range from 7.0 to 9.0.
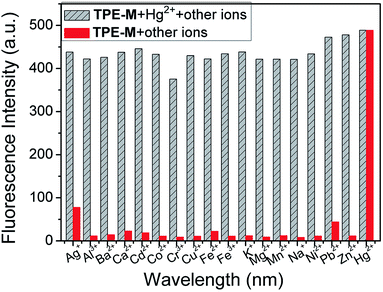 | ||
| Fig. 5 Change in fluorescence intensity of probe TPE-M (10 μM) in the presence of different metal ions (red bars) and further addition of Hg2+ (gray stripe). Metal ions were used as 15 μM. | ||
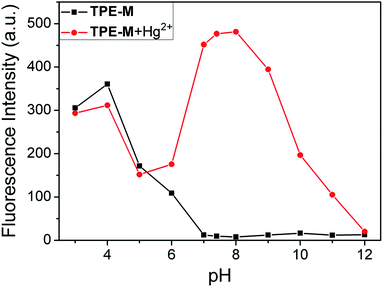 | ||
| Fig. 6 Fluorescence intensity changes of probe TPE-M in the presence and absence of Hg2+ under different pH conditions. | ||
Detection mechanism of TPE-M for Hg2+
To verify the proposed Hg2+-triggered hydrolysis of probe TPE-M to release compound 4, an additional reaction of TPE-M with Hg2+ was conducted, and the 1H NMR spectrum of the separated product was compared with that of 4 (Fig. 7). The methine proton (Hb) signal of the dithioacetal moiety in TPE-M appeared at 5.31 ppm (Fig. 7C), this signal disappeared in the separated product (Fig. 7B). Concomitantly, a new proton signal appearing at 10.04 ppm (Fig. 7B) was observed, which is assignable to the aldehyde proton (Ha) of compound 4, and the aromatic proton signals (Fig. 7B) have a pattern similar to that compound 4 (Fig. 7A). The almost identical 1H NMR spectra of the separated product and 4 demonstrate that reaction of TPE-M with Hg2+ indeed releasing 4. Another conclusive evidence for the formation of compound 4 was from the HRMS analysis of probe TPE-M + Hg2+ solution (Fig. S6†). The peak appearing at m/z = 713.4981 can be assigned to the species of [4 + 7CH3OH–H]− (calcd m/z = 713.3695), indicating the formation of compound 4. These results indicate that probe TPE-M is transformed into 4 on interaction with adding Hg2+ ions. The released AIE-active compound 4 aggregates in the detection medium, which is the reason for the observed fluorescence. The detection mechanism of probe TPE-M for Hg2+ is shown in Scheme 2.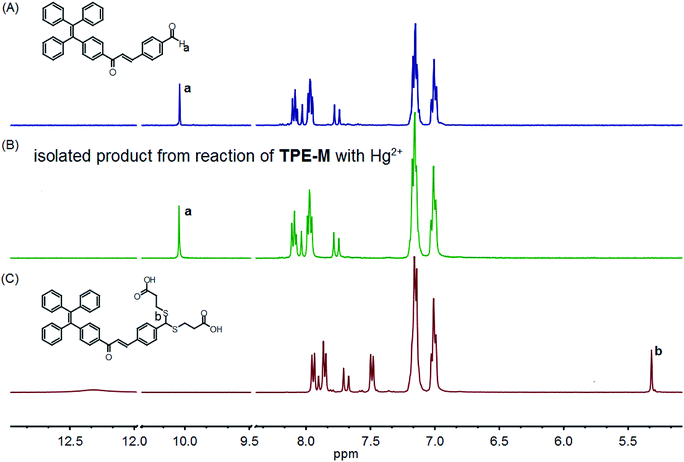 | ||
| Fig. 7 Comparison of partial 1H NMR spectra of compound 4 (A), isolated product from reaction of TPE-M with Hg2+ (B), and TPE-M (C) in DMSO-d6. | ||
Application of TPE-M for Hg2+ detection in real samples
To further explore the potential applicability of TPE-M, we examined its utility for Hg2+ detection in some food samples including crabs, shrimps and teas. Firstly, the pretreated shrimp or crab sample solution (the detailed procedures for sample pretreatment are described in ESI†) was mixed with methanol with 7![[thin space (1/6-em)]](https://www.rsc.org/images/entities/char_2009.gif) :
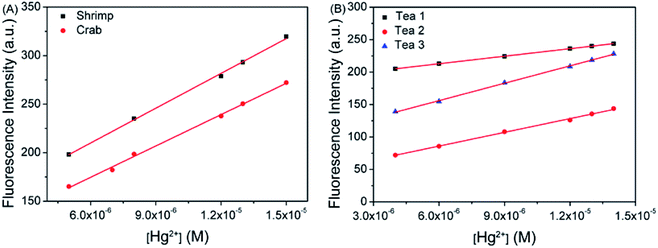
:![[thin space (1/6-em)]](https://www.rsc.org/images/entities/char_2009.gif) 3 volume ratio, and spiked with different concentrations of Hg2+. Then 10 μM of probe TPE-M was added to the Hg2+ spiked solutions and the fluorescence spectra were measured. As shown in Fig. 8A, the fluorescence intensity of the samples displayed good linear relationships against the added Hg2+ concentration, and the relevant calculations are shown in Table 1. It can be seen that the recoveries measured are between 93.47% and 105.4%, and the relative standard deviations (RSDs) are less than 2%, and the relative errors are less than 6.53%. The addition amount of Hg2+ and the measured value reach a good consistency, indicating that the analysis of Hg2+ in the seafood samples is reliable and feasible.
3 volume ratio, and spiked with different concentrations of Hg2+. Then 10 μM of probe TPE-M was added to the Hg2+ spiked solutions and the fluorescence spectra were measured. As shown in Fig. 8A, the fluorescence intensity of the samples displayed good linear relationships against the added Hg2+ concentration, and the relevant calculations are shown in Table 1. It can be seen that the recoveries measured are between 93.47% and 105.4%, and the relative standard deviations (RSDs) are less than 2%, and the relative errors are less than 6.53%. The addition amount of Hg2+ and the measured value reach a good consistency, indicating that the analysis of Hg2+ in the seafood samples is reliable and feasible.
| Sample | Added (μM) | Detect (μM) | RSD (%) | Recovery (%) | Relative error (%) |
|---|---|---|---|---|---|
| Shrimp | 5.0 | 4.67 | 1.45 | 93.47 | 6.53 |
| 8.0 | 8.43 | 0.71 | 105.40 | 5.40 | |
| 15.0 | 14.53 | 2.00 | 96.85 | 3.15 | |
| Crab | 5.0 | 5.20 | 1.20 | 104.10 | 4.10 |
| 8.0 | 7.95 | 1.26 | 99.32 | 0.68 | |
| 15.0 | 15.33 | 1.52 | 102.20 | 2.20 |
Subsequently, each tea sample was mixed with methanol at 7![[thin space (1/6-em)]](https://www.rsc.org/images/entities/char_2009.gif) :
:![[thin space (1/6-em)]](https://www.rsc.org/images/entities/char_2009.gif) 3 volume ratios, and different concentrations of Hg2+ were added thereto, and then detected by probe TPE-M. As shown in Fig. 8B, the fluorescence intensity of the probe in the real sample showed good linear relationships versus the spiked Hg2+ concentration, and the relevant calculations are shown in Table 2. The results show that the measured recoveries are between 95.44% and 109.35%, the relative standard deviations (RSDs) are less than 1.78%, and the relative errors are less than 9.35%. These results demonstrate that probe TPE-M can be used to detect Hg2+ in real tea samples.
3 volume ratios, and different concentrations of Hg2+ were added thereto, and then detected by probe TPE-M. As shown in Fig. 8B, the fluorescence intensity of the probe in the real sample showed good linear relationships versus the spiked Hg2+ concentration, and the relevant calculations are shown in Table 2. The results show that the measured recoveries are between 95.44% and 109.35%, the relative standard deviations (RSDs) are less than 1.78%, and the relative errors are less than 9.35%. These results demonstrate that probe TPE-M can be used to detect Hg2+ in real tea samples.
| Sample | Added (μM) | Detect (μM) | RSD (%) | Recovery (%) | Relative error (%) |
|---|---|---|---|---|---|
| Tea 1 | 6.0 | 6.02 | 0.16 | 100.41 | 0.41 |
| 9.0 | 8.59 | 0.27 | 95.44 | 4.56 | |
| 14.0 | 14.64 | 0.71 | 104.54 | 4.54 | |
| Tea 2 | 6.0 | 6.19 | 1.17 | 103.16 | 3.16 |
| 9.0 | 8.95 | 0.50 | 99.49 | 0.51 | |
| 14.0 | 14.49 | 0.09 | 103.47 | 3.47 | |
| Tea 3 | 6.0 | 6.56 | 0.80 | 109.35 | 9.35 |
| 9.0 | 9.46 | 1.78 | 105.08 | 5.08 | |
| 14.0 | 14.16 | 0.62 | 101.10 | 1.15 |
Conclusion
In summary, we reported a new tetraphenylethene-derived fluorescent probe TPE-M for Hg2+ detection in CH3OH/PBS (20 mM, pH = 7.4) (3![[thin space (1/6-em)]](https://www.rsc.org/images/entities/char_2009.gif) :
:![[thin space (1/6-em)]](https://www.rsc.org/images/entities/char_2009.gif) 7, v/v) solution. On treatment of non-emissive probe TPE-M solution with Hg2+, an AIE-active compound 4 is released and elicits a noticeable fluorescence enhancement. The Hg2+ recognition event holds the advantages of rapid response, high selectivity and sensitivity, strong anti-interference ability, and a low detection limit. In addition, TPE-M can be applied to detect Hg2+ in real food samples including shrimp, crab and teas, advocating the practical applicability of TPE-M.
7, v/v) solution. On treatment of non-emissive probe TPE-M solution with Hg2+, an AIE-active compound 4 is released and elicits a noticeable fluorescence enhancement. The Hg2+ recognition event holds the advantages of rapid response, high selectivity and sensitivity, strong anti-interference ability, and a low detection limit. In addition, TPE-M can be applied to detect Hg2+ in real food samples including shrimp, crab and teas, advocating the practical applicability of TPE-M.
Conflicts of interest
There are no conflicts to declare.Acknowledgements
The project was supported by the National Natural Science Foundation of China (No. 21878023, U1608222 and 21304009), the LiaoNing Revitalization Talents Program, the Natural Science Foundation of Liaoning Province (20170540019), and the Doctoral Scientific Research Foundation of Liaoning Province (No. 20170520416).Notes and references
- C. O. R. Okpala, G. Sardo, S. Vitale, G. Bono and A. Arukwe, Crit. Rev. Food Sci. Nutr., 2018, 58, 1986–2001 CrossRef CAS PubMed.
- P. Grandjean, P. Weihe, R. F. White and F. Debes, Environ. Res., 1998, 77, 165–172 CrossRef CAS PubMed.
- T. Takeuchi, N. Morikawa, H. Atsumoto and Y. Shiraishi, Acta Neuropathol., 1962, 2, 40–57 CrossRef.
- M. Wang, W. Feng, J. Shi, F. Zhang, B. Wang, M. Zhu, B. Li, Y. Zhao and Z. Chai, Talanta, 2007, 71, 2034–2039 CrossRef CAS PubMed.
- M. Filippelli, Anal. Chem., 1987, 59, 116–118 CrossRef CAS.
- T. Labatzke and G. Schlemmer, Anal. Bioanal. Chem., 2004, 378, 1075–1082 CrossRef CAS PubMed.
- H. Chen, J. Chen, X. Jin and D. Wei, J. Hazard. Mater., 2009, 172, 1282–1287 CrossRef CAS PubMed.
- D. T. Quang and J. S. Kim, Chem. Rev., 2010, 110, 6280–6301 CrossRef CAS PubMed.
- H. Zhu, J. Fan, B. Wang and X. Peng, Chem. Soc. Rev., 2015, 44, 4337–4366 RSC.
- L. Tang, M. Tian, H. Chen, X. Yan, K. Zhong and Y. Bian, Dyes Pigm., 2018, 158, 482–489 CrossRef CAS.
- L. Tang, P. He, X. Yan, J. Sun, K. Zhong, S. Hou and Y. Bian, Sens. Actuators, B, 2017, 247, 421–427 CrossRef CAS.
- Q. Hu, W. Li, C. Qin, L. Zeng and J. T. Hou, J. Agric. Food Chem., 2018, 66, 10913–10920 CrossRef CAS PubMed.
- L. Tang, F. Li, M. Liu and R. Nandhakumar, Spectrochim. Acta, Part A, 2011, 78, 1168–1172 CrossRef PubMed.
- P. Mahato, S. Saha, P. Das, H. Agarwalla and A. Das, RSC Adv., 2014, 4, 36140–36174 RSC.
- M. J. Culzoni, A. Muñoz de la Peña, A. Machuca, H. C. Goicoechea and R. Babiano, Anal. Methods, 2013, 5, 30–49 RSC.
- N. Kumar, V. Bhalla and M. Kumar, Analyst, 2014, 139, 543–558 RSC.
- Y. Zhou, X. He, H. Chen, Y. Wang, S. Xiao, N. Zhang, D. Li and K. Zheng, Sens. Actuators, B, 2017, 247, 626–631 CrossRef CAS.
- Y. Zhang, H. Chen, D. Chen, D. Wu, Z. Chen, J. Zhang, X. Chen, S. Liu and J. Yin, Sens. Actuators, B, 2016, 224, 907–914 CrossRef CAS.
- P. Srivastava, S. S. Razi, R. Ali, R. C. Gupta, S. S. Yadav, G. Narayan and A. Misra, Anal. Chem., 2014, 86, 8693–8699 CrossRef CAS PubMed.
- S. S. Razi, R. Ali, R. C. Gupta, S. K. Dwivedi, G. Sharma, B. Koch and A. Misra, J. Photochem. Photobiol., A, 2016, 324, 106–116 CrossRef CAS.
- P. Srivastava, M. Shahid and A. Misra, Org. Biomol. Chem., 2011, 9, 5051–5055 RSC.
- I. Kim, N. E. Lee, Y. J. Jeong, Y. H. Chung, B. K. Cho and E. Lee, Chem. Commun., 2014, 50, 14006–14009 RSC.
- L. Zong, C. Wang, Y. Song, Y. Xie, P. Zhang, Q. Peng, Q. Li and Z. Li, Sens. Actuators, B, 2017, 252, 1105–1111 CrossRef CAS.
- W. Fang, G. Zhang, J. Chen, L. Kong, L. Yang, H. Bi and J. Yang, Sens. Actuators, B, 2016, 229, 338–346 CrossRef CAS.
- A. Aliberti, P. Vaiano, A. Caporale, M. Consales, M. Ruvo and A. Cusano, Sens. Actuators, B, 2017, 247, 727–735 CrossRef CAS.
- K. Zhong, X. Zhou, R. Hou, P. Zhou, S. Hou, Y. Bian, G. Zhang, L. Tang and X. Shang, RSC Adv., 2014, 4, 16612–16617 RSC.
- Z. Wu, Y. Zhang, J. S. Ma and G. Yang, Inorg. Chem., 2006, 45, 3140–3142 CrossRef CAS PubMed.
- B. K. Rani and S. A. John, J. Hazard. Mater., 2018, 343, 98–106 CrossRef CAS PubMed.
- S.-Y. Moon, N. J. Youn, S. M. Park and S.-K. Chang, J. Org. Chem., 2005, 70, 2394–2397 CrossRef CAS.
- M. H. Lee, S. W. Lee, S. H. Kim, C. Kang and J. S. Kim, Org. Lett., 2009, 11, 2101–2104 CrossRef CAS.
- L. Ding, M. Wu, Y. Li, Y. Chen and J. Su, Tetrahedron Lett., 2014, 55, 4711–4715 CrossRef CAS.
- K. C. Song, J. S. Kim, S. M. Park, K.-C. Chung, S. Ahn and S.-K. Chang, Org. Lett., 2006, 8, 3413–3416 CrossRef CAS PubMed.
- S. Angupillai, J.-Y. Hwang, J.-Y. Lee, B. A. Rao and Y.-A. Son, Sens. Actuators, B, 2015, 214, 101–110 CrossRef CAS.
- S. Madhu, S. Josimuddin and M. Ravikanth, New J. Chem., 2014, 38, 5551–5558 RSC.
- Y. Gao, T. Ma, Z. Ou, W. Cai, G. Yang, Y. Li, M. Xu and Q. Li, Talanta, 2018, 178, 663–669 CrossRef CAS PubMed.
- Y. Yang, R. Shen, Y.-Z. Wang, F.-Z. Qiu, Y. Feng, X.-L. Tang, D.-c. Bai, G.-L. Zhang and W.-S. Liu, Sens. Actuators, B, 2018, 255, 3479–3487 CrossRef CAS.
- J. Luo, Z. Xie, J. W. Y. Lam, L. Cheng, B. Z. Tang, H. Chen, C. Qiu, H. S. Kwok, X. Zhan, Y. Liu and D. Zhu, Chem. Commun., 2001, 37, 1740–1741 RSC.
- B. Yuan, D. X. Wang, L. N. Zhu, Y. L. Lan, M. Cheng, L. M. Zhang, J. Q. Chu, X. Z. Li and D. M. Kong, Chem. Sci., 2019, 10, 4220–4226 RSC.
- X.-Q. Ma, Y. Wang, T.-B. Wei, L.-H. Qi, X.-M. Jiang, J.-D. Ding, W.-B. Zhu, H. Yao, Y.-M. Zhang and Q. Lin, Dyes Pigm., 2019, 164, 279–286 CrossRef CAS.
- T. Gao, X. Huang, S. Huang, J. Dong, K. Yuan, X. Feng, T. Liu, K. Yu and W. Zeng, J. Agric. Food Chem., 2019, 67, 2377–2383 CrossRef CAS PubMed.
- X. Wen and Z. Fan, Sens. Actuators, B, 2017, 247, 655–663 CrossRef CAS.
- Y. Jiang, Y. Chen, M. Alrashdi, W. Luo, B. Z. Tang, J. Zhang, J. Qin and Y. Tang, RSC Adv., 2016, 6, 100318–100325 RSC.
- S. Ozturk and S. Atilgan, Tetrahedron Lett., 2014, 55, 70–73 CrossRef CAS.
- D. Xu, L. Tang, M. Tian, P. He and X. Yan, Tetrahedron Lett., 2017, 58, 3654–3657 CrossRef CAS.
- D. D. La, S. V. Bhosale, L. A. Jones and S. V. Bhosale, ACS Appl. Mater. Interfaces, 2018, 10, 12189–12216 CrossRef CAS PubMed.
- H. Gao, D. Xu, X. Liu, A. Han, L. Zhou, C. Zhang, Z. Li and J. Dang, Dyes Pigm., 2017, 139, 157–165 CrossRef CAS.
- L. Tang, D. Xu, M. Tian and X. Yan, J. Lumin., 2019, 208, 502–508 CrossRef CAS.
- H.-Q. Jin, H.-B. Liu, Y.-Y. Xie, Y.-G. Zhang, Q.-Q. Xu, L.-J. Mao, X.-J. Li, J. Chen, F.-C. Lin and C.-L. Zhang, Symbiosis, 2018, 74, 89–95 CrossRef CAS.
- E. Tiffany-Castiglioni, S. Hong, Y. Qian, Y. Tang and K. C. Donnelly, NeuroToxicology, 2006, 27, 835–839 CrossRef CAS PubMed.
- D. Dai, Z. Li, J. Yang, C. Wang, J.-R. Wu, Y. Wang, D. Zhang and Y.-W. Yang, J. Am. Chem. Soc., 2019, 141, 4756–4763 CrossRef CAS PubMed.
Footnote |
| † Electronic supplementary information (ESI) available. See DOI: 10.1039/c9ra04440j |
| This journal is © The Royal Society of Chemistry 2019 |

