DOI:
10.1039/C9RA03405F
(Paper)
RSC Adv., 2019,
9, 37450-37466
Europium doping effect on 3D flower-like SnO2 nanostructures: morphological changes, photocatalytic performance and fluorescence detection of heavy metal ion contamination in drinking water
Received
6th May 2019
, Accepted 15th October 2019
First published on 15th November 2019
Abstract
Pure and Eu-doped (1, 3, 5, 7 & 10 mol%) SnO2 nanostructures have been successfully synthesized by a facile and simple hydrothermal method. The properties of as-synthesized samples have been investigated by various analytical techniques. It was found that the morphology of as-synthesized flower-like SnO2 nanostructures made of intermingled small-size agglomerated nanorods can be precisely controlled by varying the Eu dopant concentration in a reasonable range. Moreover, the photocatalytic activity of SnO2 studied by the degradation of rhodamine-B (RhB) dye in aqueous media shows excellent performance on 10 mol% europium doping, which may be attributed to its specific morphology and larger surface area as seen from BET measurements. Furthermore, sensors based on 10 mol% Eu-doped SnO2 nanostructures show the highest fluorescence quenching efficiency (0.23) as compared to pure SnO2 and other doped samples for the lowest concentration of Cd2+ (10 ppb) in drinking water with a Limit of Detection (LOD) as low as 7 ppb; 0.007 μg mL−1. The formation mechanism of Eu-doped SnO2 nanostructures has been discussed in detail.
1. Introduction
In recent years, with prolonged urbanization and economic development, the problems arising from volatile organic reagents, toxic heavy metal ions, gases, and pollutants have become increasingly serious. Therefore, it is necessary to detect such toxic pollutants and chemicals without delay for the safety of people. Chemical sensors based on semiconductor oxides play a vital role in many areas nowadays, such as in medical diagnosis, environmental protection, and detection of toxic gases, pollutants and heavy metal ions.1 Heavy metal ions have always been a significant threat to human health and the environment, among which Cd is of major concern, mainly due to its presence at relatively high concentrations in drinking water and its effects on human health.2 Furthermore, according to the International Agency for Research and Cancer (IARC), Cd is found to be a human carcinogen.3 Cd contaminated drinking water leads to chronic renal failure.2 It can cause both acute and chronic intoxication.4 It is highly toxic to the kidneys. Upon long exposure at low concentrations, it could become deposited in the kidneys, leading to kidney disease, fragile bones and lung damage.5 Therefore, developing selective and sensitive methods to detect and quantify metal ions at low concentrations for environmental monitoring is of considerable importance. Moreover, for environmental purification and organic pollutant degradation, semiconductor photocatalysts receive continuous research attention for its advanced oxidation process and moderate reaction conditions. Among various metal oxide semiconductors, SnO2,6 CeO2,7 and Fe2O3 (ref. 1) are probably the most common materials used for heavy metal ion detection and as leading photocatalysts because of their photochemical stability, low cost, non-toxicity and simple preparation.
Among them tin oxide (SnO2), an n-type semiconductor with a wide direct band-gap (3.6 eV), has attracted extensive attraction due to its wide potential applications in photocatalysis,8 photodetectors,9 gas sensors,10 rechargeable batteries11 and heavy metal ion detection.12 Usually, the morphologies of nanosized metal oxide materials have an effect on their applications.13 Therefore, it is important to construct well controlled morphologies which possess high surface to volume ratio and have good performance and high reactivity.14
Till now, various SnO2 morphologies including nanoparticles,15 hollow spheres,16 nanosheets,17 nanoflowers,18 polyhedrons19 and 3D hierarchical nanostructures20 have been synthesized and extensively investigated. Among such classes of materials, three dimensional (3D) nanostructures are deemed to be the most effective, due to their large surface area, porous nanostructures formed by the adjacent building blocks, low density and better reactivity towards various applications such as photocatalysis, sensing etc. Wang et al. have prepared various morphologies of as synthesized SnO2 nanomaterials for photocatalytic applications.21 Liu and co-workers reported the synthesis of hierarchical SnO2 nanostructures made of ultrathin nanosheets.14 Ghosh et al. reported the synthesis of poppy flowerlike SnO2 nanoflower array on Sn–foil by solvothermal method.22 Wu et al. reported the synthesis of novel SnO2 nanoflowers by PEG and citric acid assisted hydrothermal method.23 Chen et al. have prepared 3D SnO2 nanoflowers with nanoporous petals using a controlled structure-preserving thermal-oxidation process.24 Tan et al. have prepared SnO2 hollow spheres via surfactant assisted hydrothermal method.25 He et al. have demonstrated the synthesis and gas sensing properties of 3D SnO2 nanostructures.26 Chen et al. synthesized SnO2 nanopolyhedrons assembled from ultrathin SnO2 nanowires by SDS assisted hydrothermal process.19
Although, several researchers have reported the synthesis, properties and applications of nanorods assembled flower-like 3D SnO2 nanostructures but mostly they had followed complicated experimental procedures as seen in literature.27,28 A simple hydrothermal method is used in the present research to synthesize 3D flower-like SnO2 nanostructures. As the sensing and photocatalytic properties of nanomaterials are highly dependent upon their morphology and size, so by tuning the morphology of nanorods assembled nanoflowers to smaller size dimension will significantly enhance their sensing and photocatalytic performance.
Therefore a challenging work is to control the morphology of 3D SnO2 nanostructures by tuning the shape and size of nanorods or nanosheets filling interspaces to smaller dimensions for their enhanced significant performance. Doping method has been extensively used in order to modify the electronic structure of nanoparticles, inducing narrow energy band gap to achieve improved optical, morphological, photocatalytic29 and sensing properties.30 Recent experimental studies have shown that the introduction of rare earth elements like La, Nd, Sm, Yb, Ce etc. in wide band-gap semiconductors such as ZnO, SnO2, TiO2 etc. results in their improved sensing31 and photocatalytic performance.32 Rare earth doped compounds have been studied because of their fast mobility of oxygen ions and catalytic properties which are one of the important factors in chemical sensing.31 Various authors had reported the effect of doping of Yb,31 La,33 Y34 and Ce35 on structural, optical, morphological, photocatalytic and sensing properties of SnO2 nanostructures. To the best of our knowledge, no attention has yet been focused on heavy-metal ion sensing and photocatalytic performance of Eu-doped SnO2 nanostructures. On the contrary, researchers tend to explore the synthesis, morphology, optical, electrical, gas-sensing and photoluminescence properties of Eu doped SnO2.36–39 So, it is necessary to investigate the photocatalytic and heavy-metal ion sensing properties of Eu-doped SnO2 nanostructures. Moreover, the photocatalytic activity of as-synthesized Eu-doped SnO2 nanostructures has been examined using rhodamine-B dye as a test contaminant in aqueous media. Furthermore, for sensing application, Eu-doped SnO2 nanostructures have been effectively used for the detection of toxic heavy metals like Cd2+ ion in water with the lowest concentration up to 10 ppb (parts per billion) level.
2. Experimental section
A simple hydrothermal method along with mild operating conditions (reaction temp. < 200 °C) has been used for the synthesis of pure and doped SnO2 nanostructures. The precise control over its synthesis conditions (temperature, duration, pH etc), low energy consumption and less air pollution reflect the simplicity of this method.
2.1 Synthesis of europium doped SnO2 samples
All the chemicals and organic-solvents are analytical grade reagents and used without any further purification. To synthesize europium-doped SnO2 samples, firstly 4 mmol SnCl4·5H2O and 8 mmol C6H5Na3O7·2H2O were dissolved into 30 mL of ethanol–water (1![[thin space (1/6-em)]](https://www.rsc.org/images/entities/char_2009.gif) :
:![[thin space (1/6-em)]](https://www.rsc.org/images/entities/char_2009.gif) 1) solution. The resulting solution was vigorously stirred for 1 h with the help of magnetic stirrer. After vigorous stirring for 1 h, the solution was loaded into Teflon-lined stainless steel autoclave and heated to 180 °C for 24 h.
1) solution. The resulting solution was vigorously stirred for 1 h with the help of magnetic stirrer. After vigorous stirring for 1 h, the solution was loaded into Teflon-lined stainless steel autoclave and heated to 180 °C for 24 h.
After heat treatment, the autoclave was naturally cooled down to room temperature. After cooling, the resultant product was washed several times with de-ionized water and ethanol. Finally, the obtained precipitates were annealed at 600 °C for 2 h. The same procedure was followed for the preparation of europium-doped SnO2 samples, with the addition of europium(III) nitrate pentahydrate (Eu (NO3)3·5H2O) to tin(IV) chloride solution before the addition of tri-sodium citrate (C6H5Na3O7·2H2O) and the concentration of Eu was varied from (1–10) mol%. Finally, europium-doped SnO2 samples were collected.
2.2 Characterization
The crystallographic, morphological, compositional and optical properties of as-synthesized samples were investigated by various analytical techniques. The crystallographic parameters of the prepared samples were examined by X-ray diffractometer (Rigaku Miniflex-600 powder X-ray diffractometer, Cu-Kα1, λ = 0.154 nm) in the 2θ range varying from 20–80°, with a scanning rate and step size of 4000° min−1 and 0.02° at (40 kV, 15 mA), respectively. The morphological features of the samples were studied by FEI Quanta 200 F SEM Field Emission Scanning Electron Microscope (FESEM). The chemical and elemental composition of the samples was investigated by Energy Dispersive Spectroscopy (EDS), attached with FESEM, respectively. The functional groups of the samples were determined by Fourier Transform Infrared Spectroscopy (FTIR, PerkinElmer spectrometer) in the range of 4000–400 cm−1. The surface analysis of the samples was carried out by BET (Autosorb-I Quatachrome Corp.). The optical properties were investigated by UV-vis absorption spectroscopy (Hitachi U-2900) and (PL) photoluminescence spectroscopy (Fluoromax-4 spectrofluorometer) at room temperature.
2.3 Photocatalytic experiment
The photocatalytic degradation of rhodamine-B (RhB) dye was performed using pure and Eu-doped SnO2 samples as the nano-photocatalysts under UV irradiation exposure at room temperature. An array of 4 UV tubes of 18 W each was served as the light source to provide UV-vis illumination. To carry out the experiment, firstly 40 mg of nano-photocatalyst was added into 100 mL of rhodamine-B (RhB) solution (3.2349 mg L−1). Prior to UV irradiation exposure, the suspension was stirred in dark for 60 min to reach an adsorption–desorption equilibrium among rhodamine-B (RhB) dye, nano-photocatalyst and water. At certain time intervals of irradiation, 3–5 mL of samples were collected and analyzed with UV-vis absorption spectrophotometer (Hitachi U-2900) to record the remnant concentration of rhodamine-B (RhB) by monitoring the corresponding absorbance of the characteristic peak at 554 nm.
2.4 Detection of Cd2+ ion contamination in water by sensing the fluorescence property of Eu-doped SnO2 nanostructures
The fluorescence detection of aqueous Cd2+ in water was studied using europium-doped SnO2 NP solution at room temperature. Various concentrations of Cd(NO3)2 (10 ppb, 20 ppb, 30 ppb, 40 ppb, 50 ppb, 80 ppb, 100 ppb) at Parts Per Billion (PPB) were prepared from stock solution by quantitative dilution. To demonstrate the effect of Cd2+ ion on Eu-doped SnO2 NPs, 500 μL portions of several concentrations of Cd2+ ion (0–100 ppb) were added one at a time to 3 mL of Eu-doped SnO2 NPs solution with continuous stirring and the resulting mixture was allowed to stand for 15 min at room temperature and the photoluminescence intensity of the resulting solution was recorded on spectrofluorometer at 340 V.
3. Results and discussion
3.1 The structural characteristics
The crystallographic features of as-prepared samples are investigated by X-ray diffractometer (XRD) as shown in Fig. 1(a). All the diffraction peaks are well indexed to tetragonal rutile structure of SnO2 (JCPDS no. 41-1445, a = b = 0.47382 nm and c = 0.31871 nm, space group P42/mnm (136)). Also, no diffraction peak due to any other impurity has been detected in the spectra, which indicates the purity of as-synthesized europium doped SnO2 samples. The crystallographic parameters calculated from XRD patterns and Debye's Scherrer formula are listed in Table 1. A decrease in the value of average crystallite size (D) and lattice parameters a, b and c has been observed with the increase in the doping concentration, indicating the successful incorporation of europium ions into SnO2 host lattice which leads to lattice distortion and suppressing the growth of larger SnO2 nanocrystallites.40 To investigate the effect europium doping on the crystallinity of as-prepared 3D flower-like SnO2 nanostructures, the 2θ for (110) and (101) diffraction peaks has been monitored. Fig. 1(b) shows the comparison in the shift of 2θ for (110) and (101) diffraction peaks which indicates a slightly right shift in Eu-doped SnO2 samples, as compared with pure SnO2 and the maximum the concentration is, the greater is the shift observed in the spectra. The right shift observed in Eu-doped SnO2 samples indicates the presence of compressive strain (as listed in Table 1), which is calculated using the following equation:41| |
 | (1) |
where θ is the Bragg angle of the peak, λ is the X-ray wavelength and β is the Full Width Half Maximum (FWHM) in radians. As seen in Fig. 1(d), an increase in the amount of compressive strain has been examined from −0.031 to −0.046 with the decrease in the value of average crystallite size for Eu-doped SnO2 samples. Furthermore, only a right shift towards higher angle has been observed in the case of Eu-doped SnO2 samples along with no peak broadening (as seen in Fig. 1(b)), which indicates the presence of homogenous strain in Eu-doped SnO2 samples, as in the case of homogenously strained crystallite, the crystallites in the sample were compressed by the same amount, which causes only a shift in diffraction peak but no peak broadening. Moreover, a decrease in the values of lattice parameters has been observed with the increase in doping concentration as seen in (Table 1 and Fig. 1(c)). According to vegard's law, the subsitutional incorporation of the dopant ions into host lattice, leads to the shrinkage of lattice, while the dopant incorporation in the interstitial sites between Sn and O atoms, however, will expand the lattice.42,43 So, the results predicted from Table 1, indicates the subsitutional doping of europium ions into SnO2 host lattice.
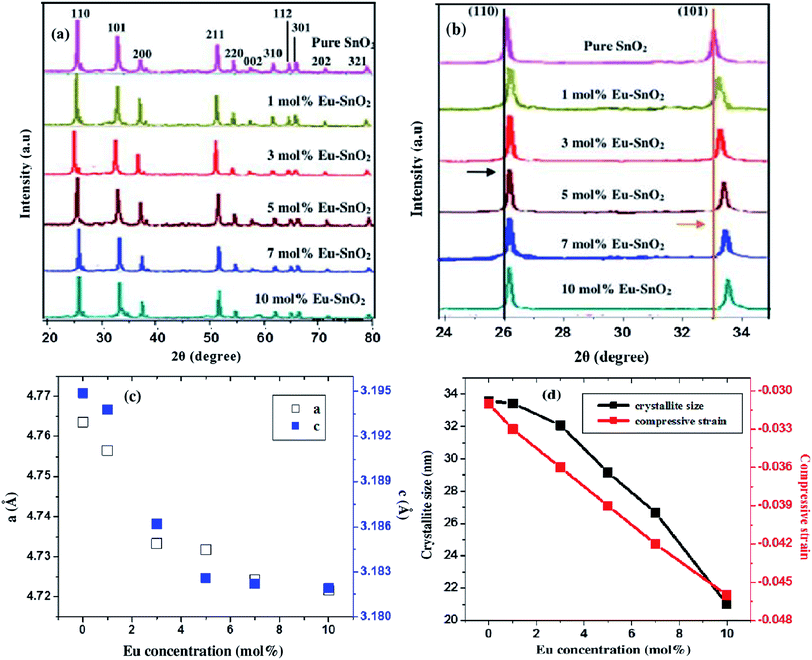 |
| | Fig. 1 XRD patterns of pure and Eu-doped SnO2 with different doping amount (a) 2θ in the range of 20–80°; (b) comparison the shift of (110) and (101) peaks; (c) plots showing the variation of lattice parameters with % Eu content and (d) plot showing the variation of crystallite size and compressive strain with Eu (mol%) content. | |
Table 1 Crystallographic parameters of pure and Eu-doped SnO2 samples calculated from XRD patterns
| Specimen |
Lattice constant a = b (Å) |
Lattice constant c (Å) |
Crystallite size D (nm) |
Strain (η) |
| Pure SnO2 |
4.7636 |
3.1949 |
33.58 |
−0.031 |
| 1 mol% Eu–SnO2 |
4.7566 |
3.1938 |
33.44 |
−0.033 |
| 3 mol% Eu–SnO2 |
4.7333 |
3.1862 |
32.09 |
−0.036 |
| 5 mol% Eu–SnO2 |
4.7318 |
3.1826 |
29.17 |
−0.039 |
| 7 mol% Eu–SnO2 |
4.7243 |
3.1822 |
25.67 |
−0.042 |
| 10 mol% Eu–SnO2 |
4.7216 |
3.1819 |
20.02 |
−0.046 |
| Std JCPDS 41-1445 |
4.7382 |
3.1871 |
— |
|
3.2 The morphological and compositional analysis
To study the elemental composition as-prepared of Eu-doped SnO2 samples, the EDS spectra of the samples have been recorded, as shown in Fig. 2(a) and (b). The peaks of tin (Sn), oxygen (O) and europium (Eu) are clearly observed in the spectra which confirm the presence of europium (Eu) in SnO2 host lattice. Pure SnO2 comprises 38.31% oxygen (O), 61.69% tin (Sn) and Eu-doped SnO2 samples comprises 55.92% oxygen (O), 34.81 tin (Sn) and 9.27% europium (Eu) by weight. The morphological features of as-prepared samples were investigated by Field Emission Scanning Electron Microscopy (FESEM), as shown in Fig. 3(a). As confirmed by FESEM images, pure SnO2 comprises flower-like morphology, grown in very high density. Further, it is observed that the flower-like structures are made of small-size agglomerated irregular-shape nanorods, which intermingle with each other having their one side connected with the side surface of other nanorods. The diameter of the nanorods is about 21–25 nm. The morphology of 1% Eu-doped SnO2 is shown in Fig. 3(b). Compared with the undoped sample, the products are composed of SnO2 nanoheets, in place of nanorods, with the average diameter of about ∼21 ± 3 nm. 3% Eu-doped SnO2 nanostructures, as shown in Fig. 3(c) consist of hollow triangle-shape SnO2 nanosheets, with an average diameter of ∼21 ± 4 nm. Mix morphology of small spheres and SnO2 nanorods has been observed in the case of 5% Eu-doped SnO2 SnO2 (Fig. 3(d)). By, increasing the Eu dopant concentration from 5 to 7%, the morphology comprises only SnO2 nanorods, in place of nanorods alongwith spheres (as observed in 3% Eu doped SnO2), with an average diameter of ∼19 ± 2 nm as seen in Fig. 3(e). Maximum dopant concentration of Eu (10 mol%) in SnO2 host lattice results in SnO2 nanorods of longer length (Fig. 3(f)) as compared to nanorods observed in the case of (Eu![[thin space (1/6-em)]](https://www.rsc.org/images/entities/char_2009.gif) :
:![[thin space (1/6-em)]](https://www.rsc.org/images/entities/char_2009.gif) SnO2 7%) with an average diameter reduced to ∼15 ± 3 nm.
SnO2 7%) with an average diameter reduced to ∼15 ± 3 nm.
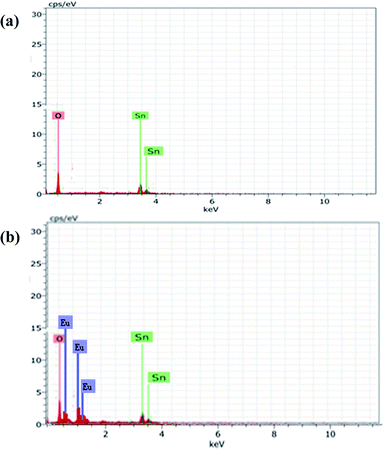 |
| | Fig. 2 (a) EDS spectra of pure SnO2; (b) 10 mol% Eu-doped SnO2. | |
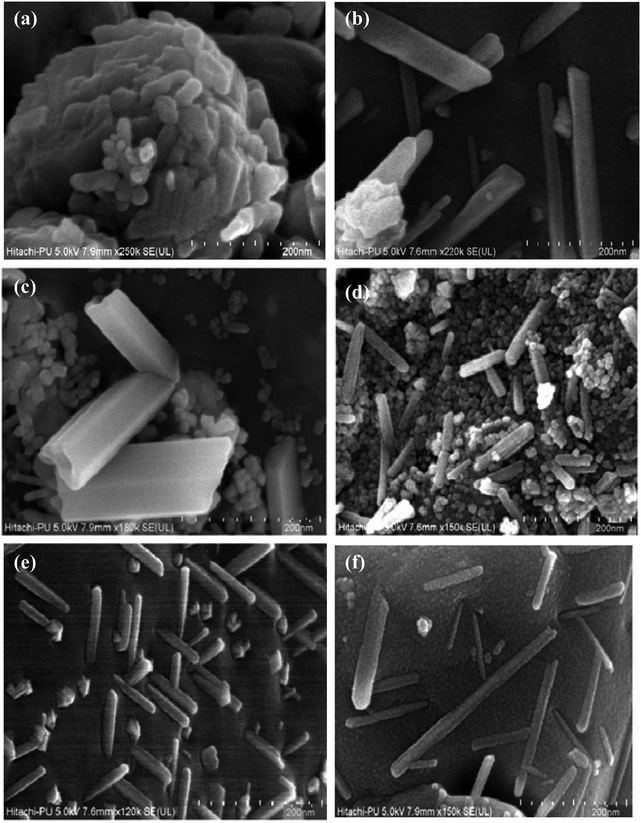 |
| | Fig. 3 FESEM images of (a) pure SnO2; (b) 1 mol%; (c) 3 mol%; (d) 5 mol%; (e) 7 mol% and (f) 10 mol% Eu-doped SnO2 samples. | |
Interestingly, from FESEM images, it has been observed that the morphology of SnO2 nanorods changes first into nanosheets, then from nanosheets to nanorods alongwith spheres and finally results into nanorods of longer length, after the doping of Eu element into pure SnO2. The basic reason behind this is the subsitutional incorporation of Eu ions into SnO2 host lattice, which modifies the local structure of host lattice, thereby leading to the variation in the surface energy of some crystal planes, which further changes their growth rate.44 Therefore, europium serves as a structure-modifying agent in the growth of nanorods. It can be observed from Fig. 3(a)–(f) that the diameter and thickness of various morphologies of nanostructures is reduced gradually with the increase in the amount of Eu doping, which is the result of suppression of grain boundary migration and increasing the energy barrier for grain growth.45
3.3 Growth mechanism
The formation mechanism of pure and europium-doped SnO2 nanostructures is explained in Fig. 4. Firstly, the nucleation of tiny SnO2 nanocrystals takes place from the hydrolysis of tin precursor. After nucleation process, the tiny crystals of SnO2 aggregated and grew into SnO2 nanorods by oriented attachment process.46 After that, the new particles formed will further grow into another nanorod by spontaneously landing on as-formed nanorods, in order to control their total surface energy,47,48 forming flower-like SnO2 nanostructures as illustrated in Fig. 4(a). Here, sodium citrate, which is added along with tin precursor plays an important role to control the morphology of as-synthesized samples. When added along with tin precursor, forms a complex with tin ions because of its strong coordination ability and will lead to decrease in the concentration of free tin ions in the solution. The as-formed new complex slows down the rate of reaction, thereby forming 3D flower-like nanostructures.14 Furthermore, it has been examined that the SnO2 morphology could be successfully controlled by varying the Eu dopant concentration in a reasonable range, which indicates the subsitutional doping of europium ions in SnO2 host lattice.
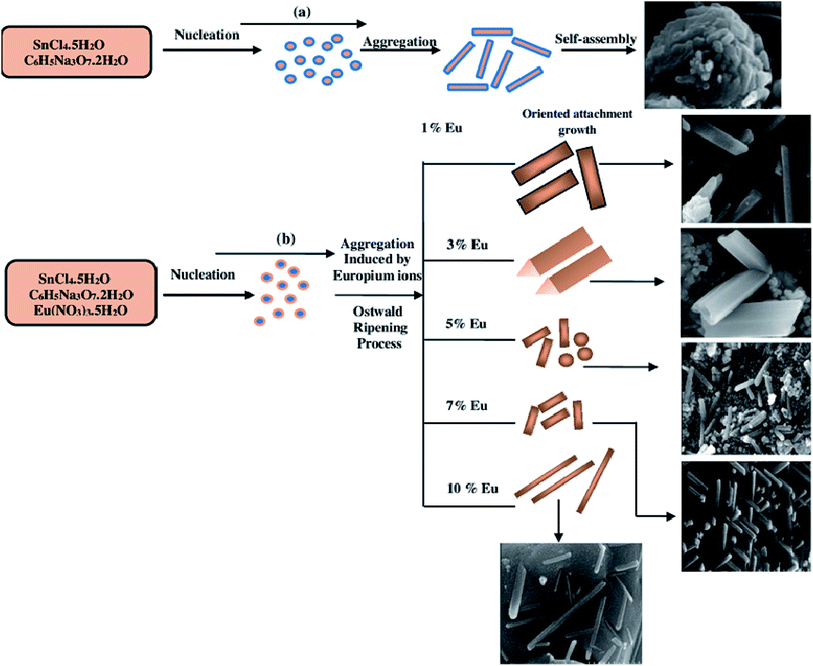 |
| | Fig. 4 (a) Schematic formation mechanism of pure SnO2 nanostructures; (b) (1, 3, 5, 7 & 10 mol%) Eu-doped SnO2 nanostructures. | |
Firstly, compound nuclei will be formed by introducing europium ions with different molar concentrations (1.3.5.7 & 10%) into the precursor solution, due to subsitutional incorporation of europium ions into SnO2 host lattice which takes place only with the addition of europium ions into precursor solution with the same molar ratio (1![[thin space (1/6-em)]](https://www.rsc.org/images/entities/char_2009.gif) :
:![[thin space (1/6-em)]](https://www.rsc.org/images/entities/char_2009.gif) 1). This will lead to the generation of double-ionized oxygen vacancies, which further changes the surface energy and density of charges of each crystal face49 and thereby leading to different growth rates of various crystal faces. Then, these primary SnO2 nanocrystals oriented grow with the driving force of decreasing surface energy into different structures through aggregation mechanism50 and Ostwald ripening process,51 under the influence of europium (Eu) as illustrated in Fig. 4(b).
1). This will lead to the generation of double-ionized oxygen vacancies, which further changes the surface energy and density of charges of each crystal face49 and thereby leading to different growth rates of various crystal faces. Then, these primary SnO2 nanocrystals oriented grow with the driving force of decreasing surface energy into different structures through aggregation mechanism50 and Ostwald ripening process,51 under the influence of europium (Eu) as illustrated in Fig. 4(b).
3.4 Functional group analysis
Fig. 5 shows the FTIR spectra of as-synthesized samples. The bands in 680–721 cm−1 region corresponds to the O–Sn–O bending vibration, while the bands observed in 471–618 cm−1 region are due to the antisymmetric vibration of Sn–O–Sn mode of tin oxide. The broad absorption peak at ∼3426 cm−1 attributed to the O–H stretching vibration.52 The peak at 1110 cm−1 is due to Sn–OH vibration.53 Peaks in the region 1448–1480 cm−1 are attributed to the CH2 bending vibrations. 1700–1729 cm−1 peaks corresponds to C![[double bond, length as m-dash]](https://www.rsc.org/images/entities/char_e001.gif) O stretch.
O stretch.
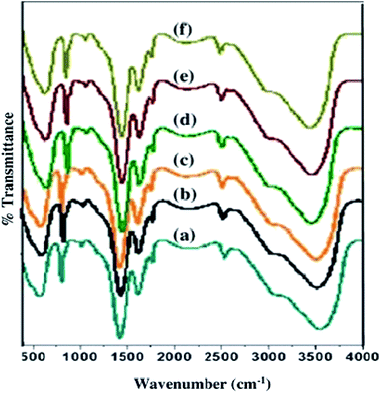 |
| | Fig. 5 FTIR spectra of (a) pure; (b) 1 mol%; (c) 3 mol%; (d) 5 mol%; (e) 7 mol% and (f) 10 mol% Eu-doped SnO2 samples. | |
Moreover, a small shift in Sn–O–Sn peak has been observed in the spectra, which can be explained by Hooke's law54 which states that the vibration frequency is indirectly proportional to the reduced mass i.e. the vibrational frequency shifts to the lower value with an increase in the reduced mass. A slight shift of Sn–O–Sn peak to lower value has been observed with a decrease in doping concentration from 10 mol% to 0 mol%.
3.5 Optical properties
To investigate the optical properties of europium doped SnO2 samples, the UV-vis absorption spectra has been recorded as shown in Fig. 6(a). The absorbance of light by nanoparticles is greatly influenced by the presence of impurity centers.55 All the samples exhibit absorbance in 300–340 nm region. Moreover, a blue-shift in the absorption edges of the samples has been observed with an increase in europium dopant concentration from 0 to 10 mol%. The band-gap of pure and Eu-doped SnO2 samples has been calculated using Tauc relation, as given below:where α is the absorption coefficient, A is constant, Eg is the band-gap of semiconductor and n = 1/2 for direct band-gap semiconductor.56 Fig. 6(b) shows the Tauc plot of (αhν)2 versus the photon energy (eV) of europium-doped SnO2 samples. The measured values of band-gap are found to be 3.60, 3.65, 3.80, 3.87, 3.90 and 4.07 eV for pure, 1%, 3%, 5%, 7% and 10% Eu-doped SnO2 samples. It has been found that with an increase in europium-doping concentration from 0 to 10 mol%, the band-gap increases. 10% europium-doped SnO2 samples possess larger band-gap value, which may be attributed to the variation in lattice defects.
In order to investigate the presence of defects in as-synthesized europium-doped SnO2 samples, the photoluminescence emission spectra have been recorded, keeping the excitation wavelength at 330 nm, as shown in Fig. 7. The emission spectra consist of two regions, one weak band in ultraviolet region (350 nm) and other strong band in visible region (666 nm). The first peak at 350 nm is assigned to Near Band Edge (NBE) emission, which is due to the radiative recombination of photo-generated charge carriers. Apart from this peak, another visible emission peak at 666 nm has been observed, which is attributed to oxygen defects related shallow and deep trap centers. Mostly, oxygen vacancies are known to be the most common defects present in metal oxide semiconductors, existing in three different charge states;57 V0O, VO+ and VO2+. The peak at 666 nm is attributed to the visible emission from deep trap centers, whose origin can be assigned to the radiative recombination of electrons in deep level states with the photo-excited holes in the valence band.
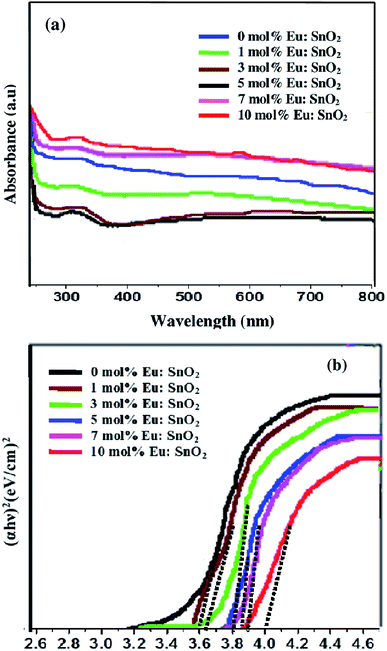 |
| | Fig. 6 (a) UV-vis absorption spectra; (b) Tauc plot of band gap energy for europium-doped SnO2 samples. | |
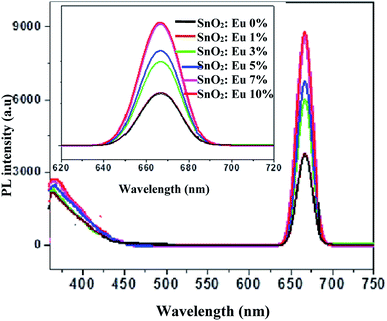 |
| | Fig. 7 PL emission spectra (inset; enlarged spectra) of pure and europium-doped SnO2 samples. | |
It has been observed that, with an increase in Eu dopant concentration from 1 to 10 mol%, the intensity of strong band at 666 nm gradually increases, while that of weak band at 350 nm tends to merge with each other.
During subsitutional incorporation of Sn4+ ions by Eu3+ ions, −1 charge of the substituted Sn4+ ion has to be compensated somewhere from the lattice in the form of oxygen vacancy. The oxygen vacancies thus created will act as radiative luminescence centers giving rise to defect levels, thereby enhancing the photoluminescence intensity of europium-doped SnO2 doped samples.
Increase in photoluminescence intensity will dominate the photocatalytic activity. But, in our study, 10 mol% europium-doped SnO2 sample exhibits highest photoluminescence intensity as well as highest photocatalytic activity (as seen in Fig. 10(a)). The reason behind the highest photocatalytic activity of 10% europium-doped SnO2 sample is its larger surface area (as seen from BET; Fig. 8(b)) and more UV absorbance (as seen in Fig. 6(a)). Larger surface area and absorption of light by 10 mol% europium-doped SnO2 leads to the presence of more photo-generated charge carriers on the surface and the carriers which are not trapped by the defect states may migrate towards the surface of nanoparticles through lattice, thereby enhancing the probability of charge transfer to the surface and dominating the radiative recombination between the carriers leading to enhancement in photocatalytic activity.
3.6 Nitrogen adsorption–desorption isotherms
The simple explanation for the enhanced photocatalytic activity of the europium-doped SnO2 samples is their increased surface area. To study the surface analysis of pure SnO2 by europium doping, nitrogen adsorption–desorption isotherm curves has been recorded for pure and 10 mol% europium-doped SnO2. As shown in Fig. 8(a) and (b), the isotherm exhibits a type V H2 hysteresis loop. The surface area of pure SnO2 from BET analysis is found to be 30.50 m2 g−1, whereas it is increased to 58.01 m2 g−1 in the case of 10 mol% Eu-doped SnO2. The pore size distribution curves of pure and 10 mol% Eu-doped SnO2 are shown inset in Fig. 8(a) and (b), which reveal the pore diameter for pure and doped SnO2 as 2.0 and 2.2 nm, respectively. The larger surface area of 10 mol% Eu-doped SnO2 leads to its enhanced photocatalytic activity.
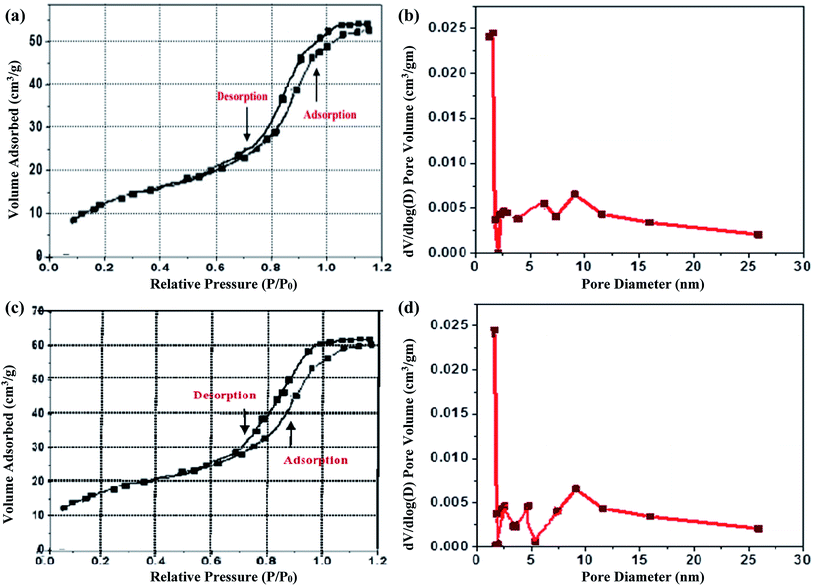 |
| | Fig. 8 (a) Nitrogen adsorption and desorption isotherms of pure SnO2; (b) 10% europium-doped SnO2; (c) pore size distribution curve of pure and (d) 10% Eu-doped SnO2. | |
3.7 Photocatalytic degradation of RhB dye by europium-doped SnO2 samples
In order to examine the photocatalytic performance of europium-doped SnO2 samples for the degradation of organic pollutants, photocatalytic degradation experiments of RhB dye has been carried out under UV exposure. The time-dependent absorption spectra of dye solution has been recorded after every 10 min time interval of UV exposure to measure the photocatalytic performance of as-synthesized Eu-doped SnO2 samples. Fig. 9(a)–(f) shows the variation in the time-dependent absorption spectra of RhB dye in the presence of Eu-doped SnO2 samples. As seen in Fig. 9, the intensity of absorption maxima (λ = 553 nm) of RhB dye has been greatly influenced by all the prepared pure and doped samples and decreases rapidly with the extension of exposure time. Fig. 10(a) shows the degradation of RhB dye as a function of time by pure and europium-doped SnO2 samples under UV exposure of 70 min. It can be seen that after 70 min of UV irradiation exposure, 10 mol% europium doped SnO2 exhibits the highest percentage of degradation (∼90%) as compared to other samples as shown in Fig. 10(b). The main reason behind the remarkable photocatalytic activity of 10% Eu-doped SnO2 nanostructures may be attributed to its specific morphology and smaller thickness of nanorods, as this leads to the adsorption of large no of reactive species and oxygen molecules by providing more active sites and allowing effective transport for the reactant molecules to get to the active sites. Moreover, the larger surface area of the 10% Eu-doped SnO2 (as seen from BET measurements; Fig. 8(b)) can help to diffuse the reactant molecules to the active sites, which further results into the enhancement of loading dye molecules and excellent photocatalytic degradation.6 Furthermore, larger surface to volume ratio of 10% Eu-doped SnO2 sample leads to more surface oxygen vacancies, thereby increasing its surface activity and hence photocatalytic performance.
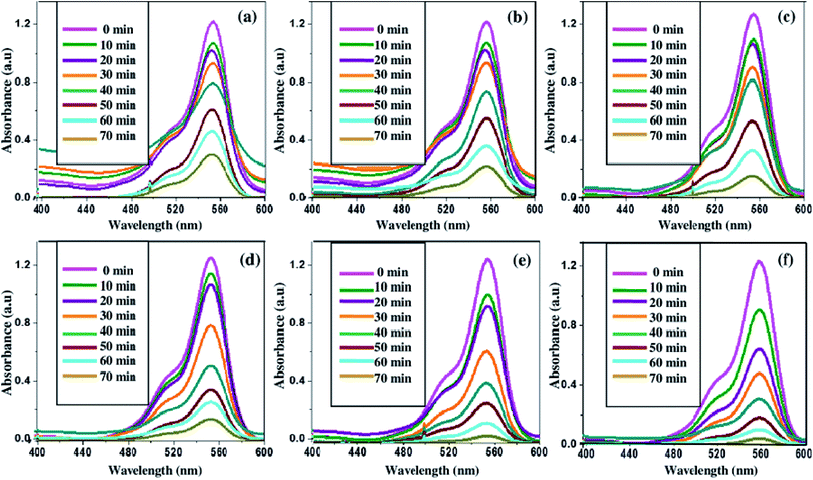 |
| | Fig. 9 Time dependent absorption spectra of rhodamine-B dye degraded in the presence of (a) pure SnO2; (b) 1% Eu-doped SnO2; (c) 3% Eu-doped SnO2; (d) 5% Eu-doped SnO2; (e) 7% Eu-doped SnO2 and (f) 10% Eu-doped SnO2 samples. | |
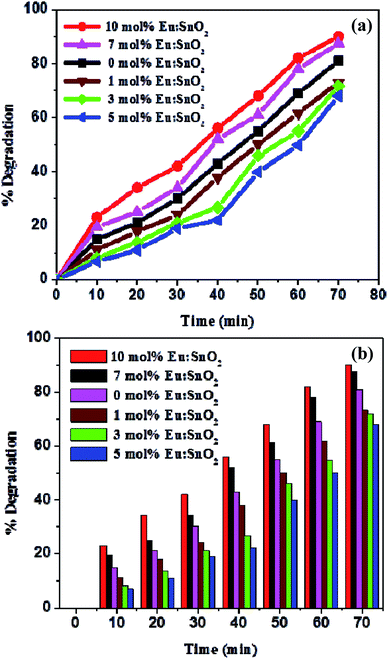 |
| | Fig. 10 (a) RhB degradation as function of time by europium-doped SnO2 samples; (b) plot showing the variation of degradation rate (%) by all the samples w.r.t time. | |
Fig. 11 shows the proposed schematic mechanism of RhB degradation by europium-doped SnO2 nanophotocatalysts under UV light exposure. The overall degradation process is as follows: at first, SnO2 absorbs photon energy greater than or equal to its band gap, which leads to the excitation of electrons from valence band to conduction band, generating electron–hole pairs. The excited electrons from conduction band of SnO2 may in turn migrate to surface deposited europium (Eu) nanoparticles because of higher energy level of conduction band of SnO2 as compared to Fermi level (Efe) of Eu–SnO2 and hence get trapped by the defect states introduced by europium doping. Therefore, europium nanoparticles will act as temporary trap centers for photogenerated electrons, preventing their recombination with holes. Moreover, UV irradiation exposure leads to the excitation of rhodamine-B (RhB) dye molecules, which are adsorbed onto the surface of SnO2 nanostructures. Upon excitation, the RhB dye molecules will transfer the electrons from LUMO into the conduction band of SnO2. The photogenerated electrons produced from above mentioned processes will than react with oxygen molecules (O2) molecules adsorbed on the surface of photocatalyst, forming superoxide anion radicals (O2˙−). The as formed O2˙− anion radicals will than react with (eCB−) electrons and proton (H+), forming hydrogen peroxide (H2O2). The hydrogen peroxide (H2O2), by taking an electron will dissociate into highly reactive hydroxyl radical (OH). Futhermore, the photogenerated holes will react with water molecules (H2O) forming hydroxyl radicals (OH˙). The hydroxyl radicals (OH˙) formed are known to be the powerful oxidizing agents, which will react with dye molecules leading to de-mineralization of products into harmless substances i.e. CO2 and H2O. The reactions of whole process are summarized as follow:58
| | |
SnO2 + hν → SnO2 (eCB− + hVB+)
| (3) |
| | |
O2˙ + eCB− + 2H+ → H2O2
| (7) |
| | |
H2O2 + eCB− → OH + OH˙
| (8) |
| | |
OH˙ + RhB˙+ → CO2 + H2O
| (9) |
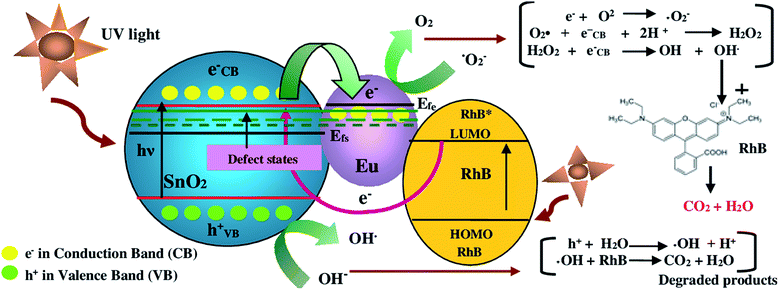 |
| | Fig. 11 Proposed schematic mechanism of RhB degradation over the surface of europium-doped SnO2 nanophotocatalyst under UV illumination. | |
3.8 The quenching effect of Cd2+ ion on PL of europium-doped SnO2 samples
In the present study, the optical response of pure and europium-doped SnO2 samples has been tested with regard to the possible fluorescence variations against the addition of different concentrations of Cd2+ ion (0, 10, 20, 30, 40, 50, 80 and 100 ppb; 0–100 ppb; 0–0.10 μg mL−1) in the aqueous solution at pH = 6. The prepared aqueous solution of europium-doped SnO2 samples exhibited a significant response to Cd2+ ion. Fig. 12(a)–(f) show the PL emission spectra at excitation wavelength λex = 330 nm of the reference aqueous suspension of europium-doped SnO2 samples in the presence of Cd2+ at different concentrations. As illustrated in Fig. 12, Cd2+ efficiently quenched the fluorescence signal ‘F’, which decreases gradually with an increase in ion concentration without having any appreciable change in the spectral profile of all the samples. The quenching of the fluorescence intensity can be quantified by a Stern–Volmer plot which describes the relationship between fluorescence intensity and quencher concentration. Fig. 12(g)–(l) shows the Stern–Volmer plots of the quenching experiment (calibration curve of F0/F versus Cd2+ ion concentration in the range 0–0.10 μg mL−1; 0–100 ppb) by europium-doped SnO2 samples. For a static quenching process, plotting relative fluorescence intensity (F0/F) against the concentration (Q) should produce a linear line.59 The graphs shows the onset of good linearity from 0–0.10 μg mL−1 Cd2+ concentration range describing static quenching with regression coefficient R2 = 0.997, 0.997, 0.996, 0.996, 0.995, 0.996 for 0%,1%, 3%, 5%, 7% & 10% europium-doped SnO2 samples. Here F0 is the fluorescence intensity of the samples at initial time t = 0 and F is the fluorescence intensity at time t. The Limit of Detection (LOD) has been calculated based on IUPAC definition (3σ of the reagent blank signal divided by the slope of the calibration curve, while σ represents standard deviation60) of all the samples, listed in Table 2. The LOD value of Cd2+ for 10% Eu-doped SnO2 sample (0.007 μg mL−1; 7 ppb) has found to be well below the lowest possible concentration of our experiment (10 ppb, 0.010 μg mL−1), as compared to other samples. Moreover, the quenching efficiency of all the samples has been calculated using the following equation:61where, I0 is the initial fluorescence intensity in the absence of analyte and I is the fluorescence intensity in the presence of corresponding analyte. Fig. 13(a)–(h) shows the bar graphs corresponding to fluorescence quenching efficiency obtained for pure and europium-doped SnO2 samples with Cd2+ concentration range (0–0.010 μg mL−1). Among all the samples, only 10% europium-doped SnO2 caused maximum fluorescence quenching at lowest level of Cd2+ concentration (10 ppb; 0.010 μg mL−1) with an efficiency of about 0.23 as compared to other samples (as seen in Fig. 13(h)), which shows that 10% europium-doped SnO2 sample exhibits highest sensitivity towards the lowest ppb level of Cd2+ concentration (0.010 μg mL−1; 10 ppb), with LOD of 0.007 μg mL−1; 7 ppb, which might be attributed to smaller size and thickness of Eu-doped SnO2 nanorods.
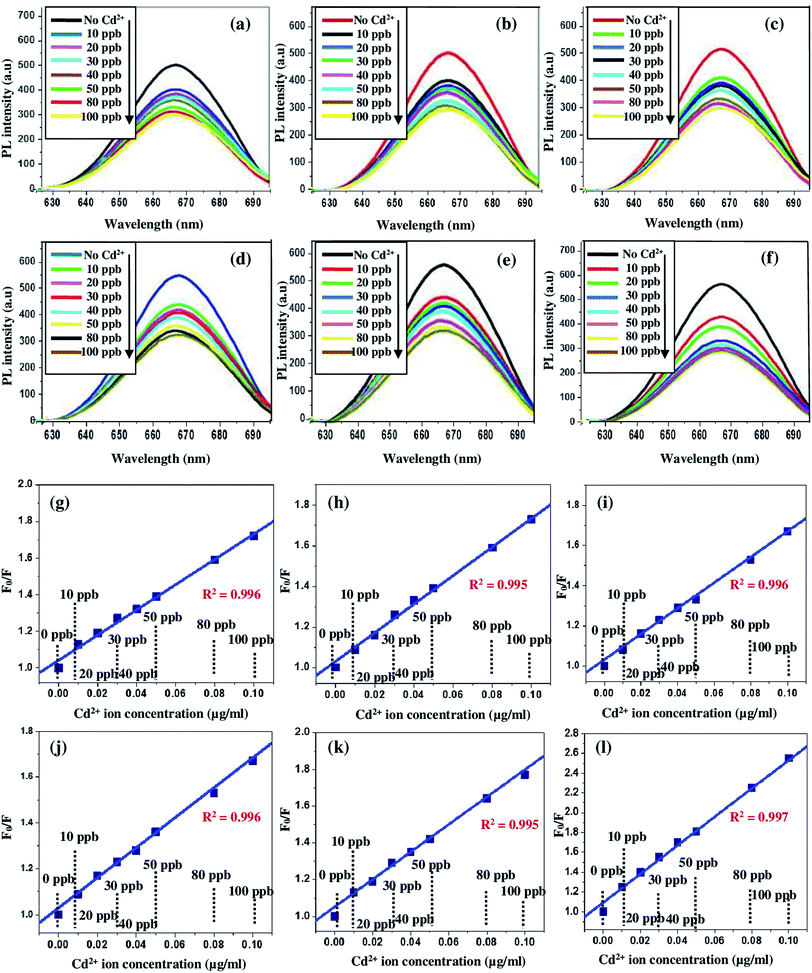 |
| | Fig. 12 PL emission spectra of the aqueous suspension of (a) pure SnO2; (b) 1 mol%; (c) 3 mol%; (d) 5 mol%; (e) 7 mol% and (f) 10 mol% Eu-doped SnO2 samples in the presence of Cd2+ at different concentrations; (g) calibration fitting curve of the linearity of Stern–Volmer plot for Cd2+ at different concentrations in the aqueous suspension of pure SnO2; (h) 1 mol%; (i) 3 mol%; (j) 5 mol%; (k) 7 mol% and (l) 10 mol% Eu-doped SnO2 samples. | |
Table 2 LOD and quenching efficiencies of europium-doped SnO2 samples
| Samples |
Limit of detection (μg mL−1) (LOD) |
Quenching efficiency at (10 ppb) |
0% Eu![[thin space (1/6-em)]](https://www.rsc.org/images/entities/char_2009.gif) : :![[thin space (1/6-em)]](https://www.rsc.org/images/entities/char_2009.gif) SnO2 SnO2 |
0.009; 9 ppb |
0.19 |
1% Eu![[thin space (1/6-em)]](https://www.rsc.org/images/entities/char_2009.gif) : :![[thin space (1/6-em)]](https://www.rsc.org/images/entities/char_2009.gif) SnO2 SnO2 |
0.010; 10 ppb |
0.17 |
3% Eu![[thin space (1/6-em)]](https://www.rsc.org/images/entities/char_2009.gif) : :![[thin space (1/6-em)]](https://www.rsc.org/images/entities/char_2009.gif) SnO2 SnO2 |
0.010; 10 ppb |
0.12 |
5% Eu![[thin space (1/6-em)]](https://www.rsc.org/images/entities/char_2009.gif) : :![[thin space (1/6-em)]](https://www.rsc.org/images/entities/char_2009.gif) SnO2 SnO2 |
0.010; 9 ppb |
0.10 |
7% Eu![[thin space (1/6-em)]](https://www.rsc.org/images/entities/char_2009.gif) : :![[thin space (1/6-em)]](https://www.rsc.org/images/entities/char_2009.gif) SnO2 SnO2 |
0.008; 8 ppb |
0.20 |
10% Eu![[thin space (1/6-em)]](https://www.rsc.org/images/entities/char_2009.gif) : :![[thin space (1/6-em)]](https://www.rsc.org/images/entities/char_2009.gif) SnO2 SnO2 |
0.007; 7 ppb |
0.23 |
It has been found that permissible limits of different heavy metal ions in drinking water has set by different agencies i.e. (WHO), (ISI), (USEPA), (CPCB) and (ICMR). But, a bias has been observed in the permissible limits of drinking water set by these different agencies. Permissible limits for drinking water parameters such as cadmium (Cd), mercury (Hg), iron (Fe), lead (Pb), arsenic (As), chlorides, fluorides, nitrite etc. are compared for different agencies in Table 3. The permissible limit of heavy metal ions and other parameters set by different agencies does not show uniformity. For cadmium (Cd), the permissible limit set by different agencies are (mg L−1; μg mL−1): USEPA 0.005, WHO 0.005, ISI 0.01, ICMR 0.01 and CPCB no relaxation.62 According to ISI and ICMR, the permissible limit of Cd in drinking water is 0.01 μg mL−1; 10 ppb. Moreover, the level of different heavy-metal ions like Cd, Ni, Hg, Mn, Pb, Cu, Fe and Co in drinking water in different places has been evaluated by various researchers (Table 4) by collecting the drinking water samples and the results were analyzed using Atomic Absorption Spectrometer (AAS). The results showed that concentration of cadmium (Cd) ranges from 0.0 to 0.06 mg L−1; μg mL−1, for cobalt (Co) ranges from 0.027 to 0.08 mg L−1; μg mL−1, for copper (Cu) ranges from 0.0 to 0.08 mg L−1; μg mL−1, for iron (Fe) ranges from 0.0 to 23.26 mg L−1; μg mL−1, for lead (Pb) ranges from 0.0 to 0.19 mg L−1; μg mL−1, for manganese (Mn) ranges from 0.035 to 1.79 mg L−1; μg mL−1, for mercury (Hg) ranges from 1.380 to 3.15 mg L−1; μg mL−1 and for nickel (Ni) ranges from 0.00 to 0.09 mg L−1; μg mL−1, among which the value for cadmium (Cd) exceeded the recommended level set by USEPA and WHO (0.005 mg L−1; μg mL−1).63 This implies that drinking water of these sampling regions is polluted and if used without any treatment, can cause polluted and if used without any treatment, can cause serious health effects to people around these areas. The detection limit of the sensor 10% Eu-doped SnO2 (0.007 μg mL−1; 7 ppb) is lower than the ISI and ICMR limit of Cd in drinking water (10 ppb; 0.01 μg mL−1) which indicates that it can be used as an efficient sensors for the detection of Cd (present below 10 ppb; 0.01 μg mL−1) in drinking water in such polluted areas.
Table 3 Permissible limits for different parameters of drinking water set by different agencies i.e. (WHO), (ISI), (USEPA), (CPCB) and (ICMR)62
| Parameters |
USEPA |
WHO |
ISI |
ICMR |
CPCB |
| pH (mg L−1; μg mL−1) |
6.5–8.5 |
6.5–8.5 |
6.5–8.5 |
6.5–9.2 |
6.5–8.5 |
| Iron (mg L−1; μg mL−1) |
— |
0.1 |
0.3 |
1.0 |
1.0 |
| Sulphate (mg L−1; μg mL−1) |
— |
— |
150 |
400 |
400 |
| Calcium (mg L−1; μg mL−1) |
— |
75 |
75 |
200 |
200 |
| Cadmium (mg L−1; μg mL−1) |
0.005 |
0.005 |
0.01 |
0.01 |
No relaxation |
| Magnesium (mg L−1; μg mL−1) |
— |
50 |
30 |
— |
100 |
| Copper (mg L−1; μg mL−1) |
1.3 |
1.0 |
0.05 |
1.5 |
1.5 |
| Arsenic (mg L−1; μg mL−1) |
0.05 |
0.05 |
0.05 |
0.05 |
No relaxation |
| Lead (mg L−1; μg mL−1) |
— |
0.05 |
0.10 |
0.05 |
No relaxation |
| Zinc (mg L−1; μg mL−1) |
— |
5.0 |
5.0 |
0.10 |
15.0 |
| Mercury (mg L−1; μg mL−1) |
0.002 |
0.001 |
0.001 |
0.001 |
No relaxation |
| Chromium (mg L−1; μg mL−1) |
0.1 |
— |
— |
— |
No relaxation |
Table 4 Comparison of measured heavy metal ions in different places63
| Location |
Measured concentration (mg L−1; μg mL−1) |
Sources |
| Cd |
Ni |
Hg |
Mn |
Pb |
Cu |
Fe |
Co |
| Gombe |
— |
— |
— |
0.12 |
— |
0.02 |
0.62 |
— |
64 |
| India |
0.002 |
0.003 |
— |
— |
0.003 |
— |
— |
— |
65 |
| Ethiopia |
0.017 |
— |
— |
— |
— |
BDL |
— |
0.018 |
66 |
| Pakistan |
0.067 |
0.00 |
— |
— |
0.351 |
0.433 |
1.676 |
— |
67 |
| Dutse |
0.003 |
0.043 |
2.283 |
0.273 |
0.015 |
0.015 |
1.824 |
0.041 |
63 |
3.9 Sensing of 10% Eu-doped SnO2 towards other heavy-metal ions
The fluorescence property of 10% Eu-doped SnO2 in the presence of different heavy-metal ions like Cd2+, Ca2+, Ba2+, Cu2+, Zn2+, Sr2+, Na+, K+, Hg2+, Co2+ and Pb2+ has been tested as seen in Fig. 14(a). The fluorescence intensity has been quenched in the presence of Cd2+ ions whereas for other heavy-metal ions such as Ca2+, Ba2+, Cu2+, Zn2+, Sr2+, Na+, K+, Hg2+, Co2+ and Pb2+, no change in the intensity has been observed. However, for some of the metal ions like Ca2+, Ba2+, Cu2+, Zn2+, Sr2+, Na+, K+, Hg2+, Co2+ and Pb2+ it shows minimal effect i.e. 5% of fluorescence quenching. Therefore, 10% Eu-doped SnO2 can be used as a fluorescent sensor to detect Cd2+ ions in drinking water.
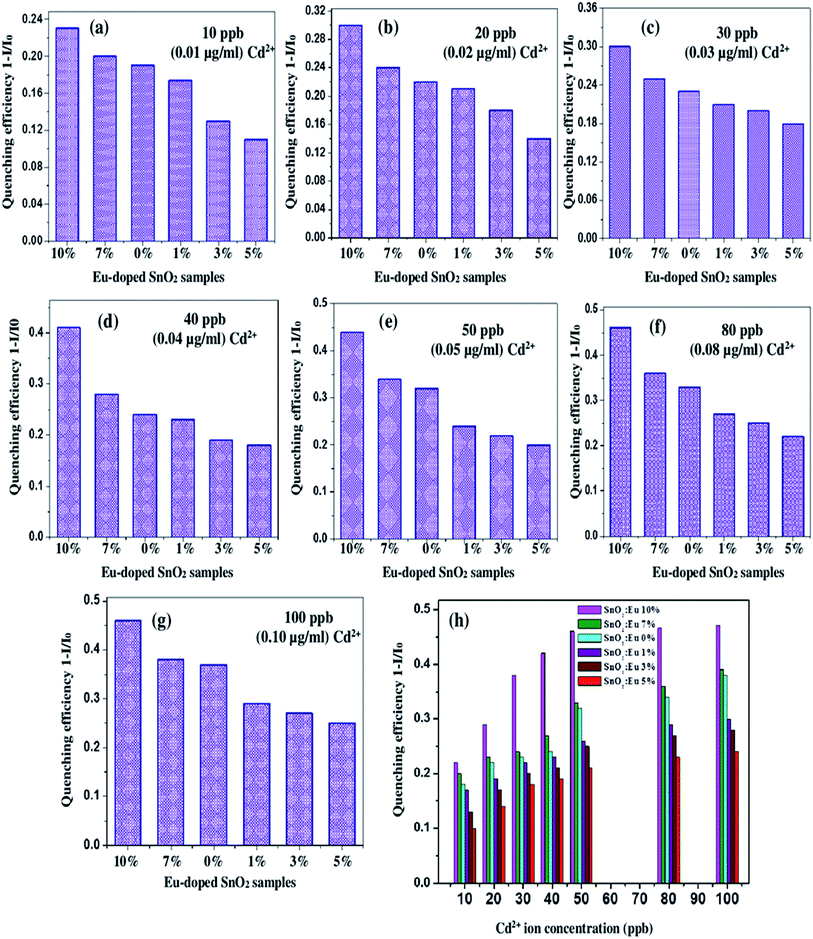 |
| | Fig. 13 Bar graphs representing fluorescence quenching efficiency obtained for Eu-doped SnO2 solution with Cd2+ at (a) 0.01 μg mL−1; (b) 0.02 μg mL−1; (c) 0.03 μg mL−1; (d) 0.04 μg mL−1; (e) 0.05 μg mL−1; (f) 0.08 μg mL−1; (g) 0.10 μg mL−1 and (h) comparison of quenching efficiencies of Eu-doped SnO2 samples at different Cd2+ ion concentrations. | |
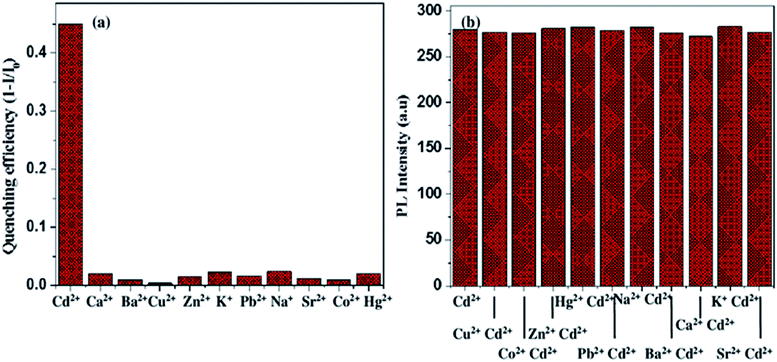 |
| | Fig. 14 (a) Selectivity bar diagram of the fluorescence quenching of 10% Eu-doped SnO2 (3 mL) towards Cd2+ and other heavy metal ions with a concentration of (0.10 μg mL−1); (b) the fluorescence intensity of 10% europium-doped SnO2 (3 mL) in the presence of 0.10 μg mL−1 of various metal ions with an added of 0.10 μg mL−1 Cd2+. | |
3.10 Selectivity of 10% Eu-doped SnO2 sensor
For the evaluation of the selectivity of probe towards Cd2+ ion, the fluorescence response of 10% Eu-doped SnO2 has been measured in the presence of other interfering metal ions individually as seen in Fig. 14(b). Some of the metal ions like Ca2+, Ba2+, Cu2+, Sr2+, Co2+ and Pb2+ does not cause any fluorescence quenching of probe even at 0.10 μg mL−1 and have no significant effect on the fluorescence spectrum, whereas Zn2+, Na+, K+ and Hg2+ ions have slight turn on effect. Hence, Cd2+ ions can easily be deducted by the probe in the presence of above metal ions with several-fold of concentrations.
4. Conclusions
Hydrothermal method is a facile and simple method for the synthesis of europium doped SnO2 nanostructures, providing a good yield of samples. It has been found that the dopant concentration plays an important in controlling the morphology, photocatalytic and sensing ability of the prepared products. 10% Eu-doped SnO2 has been observed as an efficient photocatalyst with the degradation ability of (∼89%), which is mainly due to its large surface area. Europium-doped SnO2 nanostructures have also been effectively used for the detection of Cd2+ ion in drinking water at ppb level by recording their fluorescence quenching. 10% Eu-doped SnO2 nanostructures shows highest quenching efficiency as compared to pure and other doped samples at lowest concentration of Cd2+ (10 ppb) with the Limit of Detection (LOD) as low as 7 ppb; 0.07 μg mL−1. This work demonstrates that this optimum concentration doping serves as an excellent photocatalyst for the degradation of organic pollutants and for the detection of heavy metal ions in drinking water, present even at lowest possible concentration.
Conflicts of interest
There are no conflicts to declare.
Acknowledgements
This work is financially supported by DST (Department of Science and Technology), New Delhi. Authors are grateful to SAIF, Panjab University; Chandigarh, SAI Lab Thapar University; Patiala, IIT Madras, IIT Kanpur for providing the necessary laboratory facilities to carry out this work.
References
- S. Deshmukh, G. Kandasamy, R. K. Upadhyay, G. Bhattacharya, D. Banerjee, D. Maity, M. A. Deshusses and S. S. Roy, Terephthalic Acid Capped Iron Oxide Nanoparticles for Sensitive Electrochemical Detection of Heavy Metal Ions in Water, J. Electroanal. Chem., 2017, 788, 91–98 CrossRef CAS.
- ATSDR (Agency for Toxic Substances and Disease Registry), Toxicological Profiles, Toxic Substances Portal , 2015 Search PubMed.
- IARC (International Agency for Research on Cancer), IARC monographs on the evaluation of carcinogens risks to humans, 1999, pp. 1–115 Search PubMed.
- D. Chakraborti, M. K. Sengupta, M. M. Rahman, S. Ahamed and U. K. Chowdhury, Groundwater Arsenic Contamination and its Health Effects in the Ganga-Meghna-Brahmaputra Plain, Environ. Sci.: Processes Impacts, 2004, 6, 74–83 RSC.
- A. Bernard, Cadmium and its Adverse Effects on Human Health, Indian J. Med. Res., 2008, 128, 557–564 CAS.
- N. Shanmugan, T. Sathya, G. Viruthagiri, C. Kalyanasundaram, R. Gobi and S. Ragupathy, Photocatalytic Degradation of Brilliant Green using Undoped and Zn doped SnO2 Nanoparticles under Sunlight Irradiation, Appl. Surf. Sci., 2016, 360, 283–290 CrossRef.
- A. R. Contreras Rodriguez, E. Casals, V. Puntes, D. P. Komilis, A. Sanchez and X. F. Segura, Use of Cerium Oxide (CeO2) Nanoparticles for the Adsorption of Dissolved Cadmium (II), Lead (II) and Chromium (VI) at two Different pHs in Single and Multi-component Systems, Global NEST J., 2015, 17(3), 536–543 Search PubMed.
- S. P. Kim, M. Y. Choi and H. C. Choi, Photocatalytic Activity of SnO2 Nanoparticles in Methylene Blue Degradation, Mater. Res. Bull., 2016, 74, 85–89 CrossRef CAS.
- H. Chen, L. Hu, X. Fang and L. Wu, General Fabrication of Monolayer SnO2 Nanonets for High Performance Ultraviolet Photodetectors, Adv. Funct. Mater., 2012, 22, 1229–1235 CrossRef CAS.
- J. Zang, S. Wang, Y. Wang, M. Xu, H. Xia, S. Zhang, W. Huang, X. Guo and S. Wu, Facile Synthesis of Highly Ethanol-Sensitive SnO2 Nanoparticles, Sens. Actuators, B, 2009, 139, 369–374 CrossRef.
- C. H. Xu, J. Sun and L. Gao, Direct Growth of Monodisperse SnO2 Nanorods on Graphene as High Capacity Anode Materials for Lithium Ion Batteries, J. Mater. Chem., 2012, 22, 975–979 RSC.
- S. Haq, W. Rehman, M. Waseem, M. Shahid, M. U. Rehman, K. H. Shah and M. Nawaj, Adsorption of Cd2+ Ions on Plant Mediated SnO2 Nanoparticles, Mater. Res. Express, 2016, 3, 105019 CrossRef.
- N. M. Flores, U. Pal, R. Galeazzi and A. Sandoval, Effects of Morphology, Surface Area and Defect Content on the Photocatalytic Dye Degradation Performance of ZnO Nanostructures, RSC Adv., 2014, 4, 41099–41110 RSC.
- Y. Liu, Y. Jiao, Z. L. Zhang, F. Y. Qu, U. Ahmed and X. Wu, Hierarchical SnO2 Nanostructures Made of Intermingled Ultrathin Nanosheets For Environmental Remediation, Smart Gas Sensor, and Supercapacitor Applications, ACS Appl. Mater. Interfaces, 2014, 6, 2174–2184 CrossRef CAS PubMed.
- S. Liu, L. Li, W. Jiang, C. Liu, W. Ding and W. Chai, Crystallinity and Morphology-Controlled Synthesis of SnO2 Nanoparticles for Higher Gas Sensitivity, Powder Technol., 2013, 245, 168–173 CrossRef CAS.
- J. Zhang, S. R. Wang, Y. M. Wang, W. Wang, B. L. Zhu, H. J. Xia, X. Z. Guo, S. M. Zhang, W. P. Huang and S. H. Wu, NO2 Sensing Performance of SnO2 Hollow-Sphere Sensor, Sens. Actuators, B, 2009, 135, 610–617 CrossRef CAS.
- S. J. Ding and X. W. Lou, SnO2 Nanosheet Hollow Spheres with Improved Lithium Storage Capabilities, Nanoscale, 2011, 3, 3586–3588 RSC.
- H. Wang, Q. Q. Liang, W. J. Wang, Y. R. An, J. H. Li and L. Guo, Preparation of Flower-like SnO2 Nanostructures and their Applications in Gas-sensing and Lithium Storage, Cryst. Growth Des., 2011, 11, 2942–2947 CrossRef CAS.
- D. Chen, J. Xu, Z. Xie and G. Z. Shen, Nanowires Assembled SnO2 Nanopolyhedrons with Enhanced Gas Sensing Properties, ACS Appl. Mater. Interfaces, 2011, 3, 2112–2117 CrossRef CAS PubMed.
- X. Kuang, T. Liu, W. Wang, S. Hussain and X. Peng, Controlled Synthesis of SnO2 Hierarchical Nanostructures made of Ultrathin Nanoflakes for Enhanced Ethanol Gas Sensing Properties, Appl. Surf. Sci., 2015, 351, 1087–1093 CrossRef CAS.
- M. Wang, Y. Gao, L. Dai, C. Cao, Z. Chen and X. Guo, Surfactant Free Hydrothermal Synthesis of SnO2 Powders with Controllable Morphologies and their Photocatalytic Water Treatment Application, Sci. Adv. Mater., 2013, 5, 1867–1876 CrossRef CAS.
- S. Ghosh, K. Das, K. Chakrabati and S. K. De, Template Free Synthesis of SnO2 Nanoflower Arrays on Sn Foil, CrystEngComm, 2012, 14, 927–932 Search PubMed.
- M. Wu and W. Zeng, Hydrothermal Synthesis of Novel SnO2 Nanoflowers and their Gas-Sensing Applications, Mater. Lett., 2017, 28, 2257–2266 Search PubMed.
- A. Chen, X. Peng, K. Koczkur and B. Miller, Super-Hydrophobic Tin Oxide Nanoflowers, Chem. Commun., 2004, 17, 1964–1965 RSC.
- L. Tan, M. S. Wang, Y. C. Liu, X. C. Xiao, L.-Z. Fan and Y. D. Wang, Synthesis of SnO2 Nanorods and Hollow Spheres and their Electrochemical Properties as Anode Materials for Lithium Ion Batteries, Mater. Technol., 2012, 27, 191–195 CrossRef CAS.
- Q. He, W. Zeng, M. Wu and Y. Wang, Hydrothermal Synthesis of Different 3D SnO2 Nanostructures and their Gas-Sensing Properties, J. Mater. Sci.: Mater. Electron., 2013, 24, 2390–2397 CrossRef CAS.
- R. H. Wei, K. Du, X. Y. Gong, Q. D. Chen, Z. X. Tang, J. H. You, L. B. Li and H. B. Yang, Optical Properties of Carbon Fiber/SnO2 Core Shell Structure Prepared by Surface Modification and Precipitation Process in Aqueous Solution, Appl. Surf. Sci., 2009, 255, 6464–6467 CrossRef CAS.
- G. Cheng, J. M. Wang, X. W. Liu and K. X. Huang, Self-Assembly Synthesis of Single-Crystalline Tin Oxide Nanostructures by a Poly(acrylic acid)-Assisted Solvothermal Process, J. Phys. Chem. B, 2006, 110, 16208–16211 CrossRef CAS PubMed.
- X. Jia, Y. Liu, X. Wu and Z. Zhang, A Low Temperature Situ Precipitation Route to Designing Zn-doped SnO2 Photocatalyst with Enhanced Photocatalytic Performance, Appl. Surf. Sci., 2014, 311, 609–613 CrossRef CAS.
- P. Song, Q. Wang and Z. Yang, Preparation, Characterization and Acetone Sensing Properties of Ce-doped SnO2 Hollow Spheres, Sens. Actuators, B, 2012, 173, 839–846 CrossRef CAS.
- T. T. Wang, S. Y. Ma, L. Cheng, J. Luo, X. L. Jiang and W. X. Jin, Preparation of Yb-doped SnO2 Hollow Nanofibers with an Enhanced Ethanol-Gas Sensing Performance by Electrospinning, Sens. Actuators, B, 2015, 216, 212–220 CrossRef CAS.
- V. Stengl, S. Bakardjieva and N. Murafa, Preparation and Photocatalytic Activity of Rare Earth Doped TiO2 Nanoparticles, Mater. Chem. Phys., 2009, 114(11), 217–226 CrossRef CAS.
- L. P. Chikhale, J. Y. Patil, A. V. Rajgure, F. I. Shaikh, I. S. Mulla and S. S. Suryavanshi, Structural, Morphological and Gas-Sensing Properties of Undoped and Lanthanum Doped Nanocrystalline SnO2, Ceram. Int., 2014, 40, 2179–2186 CrossRef CAS.
- L. Cheng, S. Y. Ma, X. B. Li, J. Luo, W. Q. Li, F. M. Li, Y. Z. Mao, T. T. Wang and Y. F. Li, Highly Sensitive Acetone Sensors Based on Y-Doped SnO2 Prismatic Hollow Nanofibres Synthesized by Electrospinning and their Gas Sensing Properties, J. Alloys Compd., 2014, 605, 80–88 CrossRef.
- P. Mohanapriya, H. Segawa, K. Watanabe, S. Samitsu, T. S. Natara-jan, N. V. Jaya and N. Ohashi, Enhanced Ethanol Gas-Sensing Performance of Ce-doped SnO2 Hollow Nanofibers Prepared by Electrospinning, Sens. Actuators, B, 2013, 188, 872–878 CrossRef CAS.
- A. Kar and A. Patra, Optical and Electrical Properties of Eu3+-Doped SnO2 Nanocrystals, J. Phys. Chem. C, 2009, 113, 4357–4380 CrossRef.
- N. F. Santos, J. Rodrigues, T. Holz, N. B. Sedrine, A. Sena, A. J. Neves, F. M. Costa and T. Manteiro, Luminescence Studies on SnO2 and SnO2
![[thin space (1/6-em)]](https://www.rsc.org/images/entities/char_2009.gif) :
:![[thin space (1/6-em)]](https://www.rsc.org/images/entities/char_2009.gif) Eu Nanocrystals Grown By Laser Assisted Flow Deposition, Phys. Chem. Chem. Phys., 2015, 17, 13512–13519 RSC.
Eu Nanocrystals Grown By Laser Assisted Flow Deposition, Phys. Chem. Chem. Phys., 2015, 17, 13512–13519 RSC. - Y. Zhao, X. Ren, F. Gao and H. Zhao, The Effect of Europium Doping on Microstructure, Morphology and Methanol-Sensing Performance of Highly Ordered SnO2 Nanorod Arrays, Nanomaterials, 2017, 7, 410 CrossRef PubMed.
- G. Singh, N. Kohli and R. C. Singh, Preparation and Characterization of Eu-Doped SnO2 Nanostructures for Hydrogen Gas-Sensing, J. Mater. Sci.: Mater. Electron., 2017, 28, 2257–2266 CrossRef CAS.
- I. T. Weber, A. Valentini, L. F. D. Probst, E. Longo and E. R. Leite, Influence of Noble Metals on the Structural and Catalytic Properties of Ce-doped SnO2 Systems, Sens. Actuators, B, 2004, 97, 31–38 CrossRef CAS.
- X. Xu, J. Zhuang and X. Wang, SnO2 Quantum Dots and Quantum Wires: Controllable synthesis, Self Assembled 2D Architectures and Gas-sensing Properties, J. Am. Chem. Soc., 2008, 130, 12527–12535 CrossRef CAS PubMed.
- L. Vegard, Die Konstitution der Mischkristalle und die Raumfüllung der Atome, Z. Phys., 1921, 5, 17 CrossRef CAS.
- G. L. Pearson and J. Bardeen, Phys. Rev., 1949, 75(5), 865 CrossRef CAS.
- Q. Zhao, D. Ju, X. Xeng, J. Huang, B. Cao and X. Xu, Morphology-Modulation of SnO2 Hierarchical Nanostructures by Zn Doping for Glycol Gas Sensing and Photocatalytic Applications, Sci. Rep., 2015, 7874, 1–9 Search PubMed.
- A. Tricoli, M. Graf and S. E. Pratsinis, Optimal Doping for Enhanced SnO2 Sensitivity and Thermal Stability, Adv. Funct. Mater., 2008, 18(13), 1969–1976 CrossRef CAS.
- D. S. Li, M. H. Nielsen, J. R. Lee, C. Frandsen, J. F. Banfield and J. J. De Yoreo, Direction-Specific Interactions Control Crystal Growth by Oriented Attachment, Science, 2012, 336, 1014–1018 CrossRef CAS.
- R. L. Penn and J. F. Banfield, Imperfect Oriented Attachment: Dislocation Generation in Defect-Free Nanocrystals, Science, 1998, 281, 969–971 CrossRef CAS PubMed.
- J. F. Banfield, S. A. Welch, H. Z. Zhang, T. T. Elbert and R. L. Penn, Aggregation-Based Crystal Growth and Microstructure Development in Natural Iron Oxyhydroxide Biomineralization Products, Science, 2000, 289, 751–754 CrossRef CAS PubMed.
- X. Ding, D. Zeng and C. Xie, Controlled Growth of SnO2 Nanorods Clusters Via Zn Doping and Its Influence on Gas-Sensing Properties, Sens. Actuators, B, 2010, 149, 336–344 CrossRef CAS.
- E. R. Leite, T. R. Giraldi, F. M. Pontens and E. Longo, Crystal Growth in Colloidal Tin Oxide Nanocrystals Induced by Coalescence at Room Temperature, Appl. Phys. Lett., 2003, 83, 1566–1568 CrossRef CAS.
- Z. Liu, S. Li, Y. Yang, S. Peng, Z. Hu and Y. Qian, Complex-Surfactant-Assisted Hydrothermal Route to Ferromagnetic Nickel Nanobelts, Adv. Mater., 2003, 15, 1946–1948 CrossRef CAS.
- N. Rajesh, J. C. Kannan, T. Krishnakumar, S. G. Leonardi and G. Neri, Sensing Behavior to Ethanol of Tin Oxide Nanoparticles Prepared by Microwave Synthesis with Different Irradiation Time, Sens. Actuators, B, 2014, 194, 96–104 CrossRef CAS.
- L. Abello, B. Bochu, A. GHaskov, S. Koudryavtseva, G. Lucazeau and M. Roumyantseva, Structural Characterization of Nanocrystalline SnO2 by X-ray and Raman Spectroscopy, J. Solid State Chem., 1998, 135, 78–83 CrossRef CAS.
- P. Donald, M. L. Gary and S. K. George Jr, Introduction to Spectroscopy, J. Chem. Educ., 1979, 56, A323 Search PubMed.
- A. S. Ahmad, S. M. Muhamed, M. L. Singla, S. Tabassum, A. H. Naqvi and A. Azam, Band Gap Narrowing and Fluorescence Properties of Nickel Doped SnO2 Nanoparticles, J. Lumin., 2011, 131, 1–6 CrossRef.
- M. Dehbashi and M. Aliahmad, Experimental study of structural and optical band gap of nickel doped Tin oxide nanoparticles, Int. J. Phys. Sci., 2012, 7(37), 5415–5420 CAS.
- M. Vanheusden, W. L. Warren, C. H. Seager, D. R. Tallant, J. A. Voigt and B. E. Gnade, Mechanisms Behind Green Photoluminescence in ZnO Phosphor Powders, J. Appl. Phys., 1996, 79, 7983 CrossRef.
- L. P. Singh, N. M. Luwang and S. K. Srivastava, Luminescence and Photocatalytic Studies of Sm3+ Ion Doped SnO2 Nanoparticles, New J. Chem., 2014, 38, 115–121 RSC.
- J. Lakowicz, Principals of Fluorescence Spectroscopy, Plenum Press, New York, 1983 Search PubMed.
- A. D. McNaught and A. Wilkinson, Compendium of Chemical Terminology: The “Gold Book”, Blackwell Science, Oxford, UK, 2nd edn, 2014, ISBN 0-9678550-9-8 Search PubMed.
- E. Ciotta, S. Paoloni, M. Richetta, P. Prosposito, P. Tagliatesta, C. Lorecchio, I. Venditti, I. Fratoddi, S. Casciardi and R. Pizzoferrato, Sensitivity to Heavy Metal Ions of Unfolded Fullerene Quantum Dots, Sensors, 2017, 17, 2614 CrossRef PubMed.
- M. Kumar and A. Puri, A review of Permissible Limits of Drinking Water, Indian J. Occup. Environ. Med., 2012, 6(1), 40–44 Search PubMed.
- S. Abdullahi, C. E. Ndikilar, A. B. Suleiman and H. Y. Hafeez, Evaluation of Heavy Metal Concentration in Drinking Water Collected from Local Wells and Boreholes of Dutse Town, North West, Nigeria, Adv. Phys. Theor. Appl., 2016, 51 Search PubMed.
- S. Ahmed, A. Haruna and U. Y. Abubakar, Assessment of Wash-Borehole Water Quality in Gombe Metropolis, Gombe State, Nigeria, J. Environ. Earth Sci., 2013, 3(1), 2224–3216 Search PubMed.
- B. Abida, S. Harikrishna and K. Irfanulla, Analysis of Heavy Metals in Water, Sediments and Fish Samples of Madiwala Lakes of Bangalore, Karnataka, Int. J. ChemTech Res., 2009, 1(2), 245–249 Search PubMed.
- M. Gebrekidan and Z. Samuel, Concentration of Heavy Metals in Drinking Water from Urban Areas of the Tigray Region, Northern Ethiopia, C N C S Mekelle University, 2011, vol. 3, 1, pp. 105–121 Search PubMed.
- N. Ruqia, K. Muslim, M. Muhammad, R. U. Hameed, R. U. Naveed, S. Surrya, A. Nosheen, S. Muhammad, U. Mohib, R. Muhammad and S. Zeenat, Accumulation of Heavy-Metals (Ni, Cu, Cd, Cr, Pb, Zn, Fe) in the Soil Water and Plants and Analysis of Physico-Chemical Parameters of Soil and Water Collected from Tanda Dam Kohat, J. Pharm. Sci. Res., 2015, 7(3), 89–97 Search PubMed.
|
| This journal is © The Royal Society of Chemistry 2019 |
Click here to see how this site uses Cookies. View our privacy policy here.  Open Access Article
 *,
Harbhajan Singh Bhatti and
Karamjit Singh
![[thin space (1/6-em)]](https://www.rsc.org/images/entities/char_2009.gif) :
:![[thin space (1/6-em)]](https://www.rsc.org/images/entities/char_2009.gif) 1) solution. The resulting solution was vigorously stirred for 1 h with the help of magnetic stirrer. After vigorous stirring for 1 h, the solution was loaded into Teflon-lined stainless steel autoclave and heated to 180 °C for 24 h.
1) solution. The resulting solution was vigorously stirred for 1 h with the help of magnetic stirrer. After vigorous stirring for 1 h, the solution was loaded into Teflon-lined stainless steel autoclave and heated to 180 °C for 24 h.

![[thin space (1/6-em)]](https://www.rsc.org/images/entities/char_2009.gif) :
:![[thin space (1/6-em)]](https://www.rsc.org/images/entities/char_2009.gif) SnO2 7%) with an average diameter reduced to ∼15 ± 3 nm.
SnO2 7%) with an average diameter reduced to ∼15 ± 3 nm.


![[thin space (1/6-em)]](https://www.rsc.org/images/entities/char_2009.gif) :
:![[thin space (1/6-em)]](https://www.rsc.org/images/entities/char_2009.gif) 1). This will lead to the generation of double-ionized oxygen vacancies, which further changes the surface energy and density of charges of each crystal face49 and thereby leading to different growth rates of various crystal faces. Then, these primary SnO2 nanocrystals oriented grow with the driving force of decreasing surface energy into different structures through aggregation mechanism50 and Ostwald ripening process,51 under the influence of europium (Eu) as illustrated in Fig. 4(b).
1). This will lead to the generation of double-ionized oxygen vacancies, which further changes the surface energy and density of charges of each crystal face49 and thereby leading to different growth rates of various crystal faces. Then, these primary SnO2 nanocrystals oriented grow with the driving force of decreasing surface energy into different structures through aggregation mechanism50 and Ostwald ripening process,51 under the influence of europium (Eu) as illustrated in Fig. 4(b).![[double bond, length as m-dash]](https://www.rsc.org/images/entities/char_e001.gif) O stretch.
O stretch.


![[thin space (1/6-em)]](https://www.rsc.org/images/entities/char_2009.gif) :
:![[thin space (1/6-em)]](https://www.rsc.org/images/entities/char_2009.gif) SnO2
SnO2![[thin space (1/6-em)]](https://www.rsc.org/images/entities/char_2009.gif) :
:![[thin space (1/6-em)]](https://www.rsc.org/images/entities/char_2009.gif) SnO2
SnO2![[thin space (1/6-em)]](https://www.rsc.org/images/entities/char_2009.gif) :
:![[thin space (1/6-em)]](https://www.rsc.org/images/entities/char_2009.gif) SnO2
SnO2![[thin space (1/6-em)]](https://www.rsc.org/images/entities/char_2009.gif) :
:![[thin space (1/6-em)]](https://www.rsc.org/images/entities/char_2009.gif) SnO2
SnO2![[thin space (1/6-em)]](https://www.rsc.org/images/entities/char_2009.gif) :
:![[thin space (1/6-em)]](https://www.rsc.org/images/entities/char_2009.gif) SnO2
SnO2![[thin space (1/6-em)]](https://www.rsc.org/images/entities/char_2009.gif) :
:![[thin space (1/6-em)]](https://www.rsc.org/images/entities/char_2009.gif) SnO2
SnO2![[thin space (1/6-em)]](https://www.rsc.org/images/entities/char_2009.gif) :
:![[thin space (1/6-em)]](https://www.rsc.org/images/entities/char_2009.gif) Eu Nanocrystals Grown By Laser Assisted Flow Deposition, Phys. Chem. Chem. Phys., 2015, 17, 13512–13519 RSC.
Eu Nanocrystals Grown By Laser Assisted Flow Deposition, Phys. Chem. Chem. Phys., 2015, 17, 13512–13519 RSC.


