 Open Access Article
Study of the modification mechanism of heavy metal ions adsorbed by biomass-activated carbon doped with a solid nitrogen source†
Wanlan Zheng,
Shuang Chen *,
Huie Liu,
Yudi Ma and
Wenlong Xu
State Key Laboratory of Heavy Oil Processing, College of Chemical Engineering, China University of Petroleum (East China), Qingdao, Shandong 266580, China. E-mail: chsh1030@163.com
First published on 15th November 2019
Abstract
In this study, the N-doping of biomass-activated carbon with dicyandiamide was performed via an ultrasonic method and a redox method. BET, SEM, EDS, FT-IR and XPS were used to determine the pore structures, morphologies and surface chemistry of the adsorbents obtained. The N-doping effect of the two modification methods on the same solid nitrogen source was evaluated and the simulated adsorption experiments of heavy metal ions in wastewater were conducted. The results showed that the N-doped biomass-activated carbon having the higher doping content was obtained by a redox method with nitric acid at 25 °C, a solid nitrogen source ratio of 1![[thin space (1/6-em)]](https://www.rsc.org/images/entities/char_2009.gif) :
:![[thin space (1/6-em)]](https://www.rsc.org/images/entities/char_2009.gif) 1 and charring at 800 °C for 2 hours. The adsorption efficiency for the divalent copper ion of the sample obtained by the redox method was 41.15% higher than that of the ultrasonic method sample, and proved that pyridinium nitrogens and amino groups play important roles in adsorption and complexation processes. The isothermal adsorption experiments of N-doped activated carbon conformed to the Freundlich model, which mainly depended on chemical adsorption. The kinetics for copper ion adsorption followed a pseudo-second-order kinetic model. Thermodynamic experiments showed that a higher temperature was advantageous to adsorption. Simultaneously, this study further analyzed the N-doping process of the redox method sample and suggested that improvements can be implemented in the N-doping of activated carbon with solid nitrogen sources.
1 and charring at 800 °C for 2 hours. The adsorption efficiency for the divalent copper ion of the sample obtained by the redox method was 41.15% higher than that of the ultrasonic method sample, and proved that pyridinium nitrogens and amino groups play important roles in adsorption and complexation processes. The isothermal adsorption experiments of N-doped activated carbon conformed to the Freundlich model, which mainly depended on chemical adsorption. The kinetics for copper ion adsorption followed a pseudo-second-order kinetic model. Thermodynamic experiments showed that a higher temperature was advantageous to adsorption. Simultaneously, this study further analyzed the N-doping process of the redox method sample and suggested that improvements can be implemented in the N-doping of activated carbon with solid nitrogen sources.
1. Introduction
Activated carbon is a porous and stable carbon material, which is widely used in chemical industry, agriculture, environmental protection, and other fields. Activated carbon can be used as a catalyst, adsorbent or a reaction carrier, thus realizing large-scale industrial applications.1 It can also be used as an electrode2 or an energy storage material,3 expanding the field of energy production and storage. However, the high cost of commercially activated carbon limits its applications to a certain extent. In recent years, there have been reports that agricultural or industrial wastes, such as peach nuts, fruit shells and sludge, are used as precursors for the preparation of activated carbon4–6 in order to seek unconventional and low-cost production processes. Because activated carbon can be produced from abundantly available and low-cost biowaste, biomass-activated carbon has been the focus of research.7,8 Products from different biosources also exhibit different properties, such as specific surface areas, pore size distributions and adsorption properties, due to the influence of precursor properties, the type of activator used, activation time, and pyrolysis temperature.As a common adsorbent, activated carbon has many advantages over zeolite and silica gel, such as high temperature resistance, radiation resistance and stability under acid–alkaline conditions. Due to its good adsorption performance and developed specific surface area, activated carbon has attracted considerable attention in gas separation, solvent recovery, water purification, and air deodorization. At present, it can be used to adsorb organic dyes, heavy metal ions, and volatile gases.9 In particular, activated carbon has good application prospects in the treatment of heavy metal ions in aqueous solutions. However, how to improve the adsorption performance of activated carbon is a challenging research topic. Common adsorption mechanisms include chemical adsorption, metal complexation, pore diffusion and ion exchange.10 It is generally believed that after pyrolysis or chemical modification, the nitrogen and oxygen functional groups on the surface of adsorbent materials can contribute to the complexation of heavy metal ions, thereby significantly enhancing the adsorption properties.11–14 Activated carbon modifications can be divided into dry and wet methods. Dry process was to modify activated carbon by pyrolysis in an atmosphere of ammonia, ozone and other gases. Wet process was modified with nitric acid, hydrogen peroxide, potassium permanganate and other strong oxidants under heating conditions.15 In addition, it has been reported that activated carbon can be also loaded with a sodium hydroxide/urea solution,16 aniline,17 and other additives.
Currently, the N-doping methods that can improve the adsorption capacity of activated carbon are attracting considerable attention. N-doped activated carbon has stable chemical properties and a high electron-donating ability. It exhibits a good application prospect in the treatment of single metal ions, such as Pb(II), Cr(VI), Hg(II) and organic–metal ion mixed contaminants.18–21 However, in literature reports and previous experimental studies, the direct impregnation of activated carbon with nitrogen reagents had some problems, such as long modification cycles and low doping amount, which led to adsorption performance of products that were not visibly improved obviously. The use of strong oxidants for modification at high temperatures not only posed high risks, but also excessively destroyed the original porous structure of activated carbon, resulting in a reduced adsorption capacity.22,23
In view of the above issues, this study explored the N-doped method of activated carbon using a solid nitrogen source. Dicyandiamide was used as the solid nitrogen source, and the activated carbon substrate was modified by an ultrasonic method and a redox method. The pore structure, elemental composition and the surface functional groups of two modified activated carbon samples were observed by BET, SEM, EDS, FT-IR and XPS and compared with those of unmodified activated carbon in order to find the effective N-doping law for modified activated carbon. An adsorption experiment on wastewater containing divalent copper ions was performed, and the adsorption effect and mechanism were investigated to optimize the modification method.
2. Experimental
2.1 Reagents and instruments
Dicyandiamide (C2H4N4) was of chemical grade. Zinc chloride (ZnCl2), hydrochloric acid (HCl), nitric acid (HNO3) and copper nitrate trihydrate (Cu(NO3)2·3H2O) were of analytical grade. The above chemical reagents were all purchased from Sinopharm Chemical Reagent Co., Ltd.The experimental equipment includes a DHG-9246A constant temperature drying oven (Shanghai Hao Experimental Equipment Co., Ltd.), an AL204 electronic balance, (METTLER TOLEDO (Shanghai) Co., Ltd.), a DF-101S collector type constant temperature heating magnetic stirrer (Gongyi City Yuhua Instrument Co., Ltd.), a DR2800 Hash Water Quality Analyzer (Hash Company, USA), a non-standard tube furnace, (Shandong Longkou Shouke Instrument Co., Ltd.), and a H2016D high-speed centrifuge (Shanghai Zhixin Experimental Instrument Technology Co., Ltd.).
The testing equipment includes a JSM-7500F scanning electron microscope (Japan Electronics), an Escalab 250Xi X-ray photoelectron spectroscope (American Thermo Fisher Scientific), a ASAP 2020M specific surface area and microporous physical adsorption analyzer (Micromeritics, USA) and a Nicolet 6700 Fourier Transform infrared spectrometer (Nikoli, USA).
2.2 Sample preparation and modification tests
Biomass-activated carbon was prepared from sawdust. The raw material was put into the oven and dried at 105 °C for 24 hours to remove moisture. After that, it was granulated in a mortar and sieved to obtain granules having a particle diameter of 40 mesh to 100 mesh. The activated material was impregnated with 3 mol L−1 ZnCl2 for 24 hours and dried at 105 °C for 2 hours. Then, the activated sample was put into a tubular heater with a nitrogen gas velocity of 100 mL min−1, a heating rate of 5 °C per minute and constant temperature carbonization of 60 minutes at 500 °C to promote the decomposition of cellulose and lignin in raw materials.7 The pyrolysis product was soaked with 2 mol L−1 HCl for 1 hour and then rinsed with deionized water until the pH of the solution was neutral. Lastly, the acid-washed sample was dried to constant weight at 105 °C. Biomass-activated carbon was obtained, recorded as BAC.![[thin space (1/6-em)]](https://www.rsc.org/images/entities/char_2009.gif) :
:![[thin space (1/6-em)]](https://www.rsc.org/images/entities/char_2009.gif) 1. The mixture was sonicated for 40 minutes and then dried at 60 °C for 2 hours. The dried sample was heated to 200 °C for 1 hour under N2 atmosphere, and then heated to 800 °C for 1 hour. N-doped biomass-activated carbon modified by ultrasounds was obtained and is referred to as BAC-U.
1. The mixture was sonicated for 40 minutes and then dried at 60 °C for 2 hours. The dried sample was heated to 200 °C for 1 hour under N2 atmosphere, and then heated to 800 °C for 1 hour. N-doped biomass-activated carbon modified by ultrasounds was obtained and is referred to as BAC-U.![[thin space (1/6-em)]](https://www.rsc.org/images/entities/char_2009.gif) :
:![[thin space (1/6-em)]](https://www.rsc.org/images/entities/char_2009.gif) 1. The reaction mixture was stirred for 4 hours and then filtered. After drying at 105 °C for 8 hours, BAC-N2 was obtained. Lastly, the dried sample was pyrolyzed at 800 °C for 2 hours in a tube furnace. N-doped biomass-activated carbon modified by redox reactions was obtained and is referred to as BAC-N.
1. The reaction mixture was stirred for 4 hours and then filtered. After drying at 105 °C for 8 hours, BAC-N2 was obtained. Lastly, the dried sample was pyrolyzed at 800 °C for 2 hours in a tube furnace. N-doped biomass-activated carbon modified by redox reactions was obtained and is referred to as BAC-N.2.3 Adsorption experiments
The performance of the adsorbents was evaluated by using Cu(II) solution as the target pollutant, and its natural occurring conditions were simulated by a copper nitrate solution. A 500 mg L−1 Cu(II) original solution was prepared and diluted according to the adsorption requirements. In the adsorption experiment, the mixture was stirred using a collector-type constant temperature heating magnetic stirrer. After sampling, the mixture was centrifuged, and the concentration of Cu(II) in the solution was measured by a Hash Water Quality Analyzer.
 | (1) |
Quasi-first-order dynamics and quasi-second-order dynamics25 were fitted by eqn (2) and (3), respectively. The kinetic model was determined by the correlation coefficient R2 and the standard deviation SD26 that can be calculated by eqn (4)
ln(qe − qt) = ln![[thin space (1/6-em)]](https://www.rsc.org/images/entities/char_2009.gif) qe − k1t qe − k1t
| (2) |
 | (3) |
 | (4) |
The IPD model is fitted with kinetic experimental data,27 calculated by eqn (5)
| qt = kidt0.5 + C | (5) |
 | (6) |
 | (7) |
| ΔG0 = ΔH0 − TΔS0 | (8) |
 | (9) |
| qe = KFCe1/n | (10) |
2.4 Characterization
The surface topography of the samples was determined by scanning electron microscopy (SEM). The specific surface areas and pore structures of the samples were determined by nitrogen adsorption–desorption (BET). Surface functional groups of the sample materials were investigated using Fourier transform infrared spectroscopy (FT-IR) and X-ray photoelectron spectroscopy (XPS). The surface elemental content of samples was measured via X-ray energy dispersive spectroscopy (EDS).3. Results and discussion
3.1 SEM
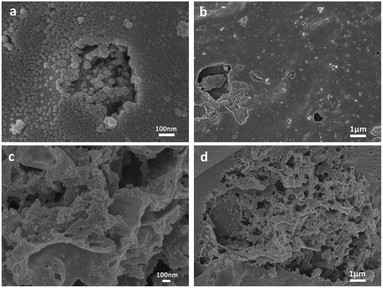
As shown in Fig. 1, a large number of spherical carbon particles are distributed on the surface of the N-doped activated carbon. Carbon in solid nitrogen source is evenly dispersed in solution during mixing and formed after carbonization at high temperature. The presence of carbon particles can increase the specific surface area of the sample and enhance the adsorption capacity.30The electron micrographs of BAC-U (a and b) and BAC-N (c and d) show that the surface of BAC-U is relatively flat and dense. The pore structure of the sample surface is destroyed by the ultrasonic dispersion process, which reduces the adsorption capacity to a certain extent. The pore structure of BAC-N is extremely well-developed and the surface is rough and porous due to the corrosive action of nitric acid in the redox process. The internal pores of BAC-N are exposed in a large amount, which makes the material more conducive to the diffusion and the adsorption of metal ions.
3.2 BET
The specific surface areas and pore size distributions of N-doped adsorbents are shown in Fig. S1† and Table 1. It can be seen that the specific surface area and pore volume of BAC-U prepared by ultrasonic method are larger. The pore structure of BAC-U is developed and the micropore content accounts for 93.09% of total pores. However, in the process of adsorption, heavy metal ions tend to cooperate with the adsorbents. The well-developed physical channels of these samples have no advantage in the adsorption process.31| SBET (m2 g−1) | VT (cm3 g−1) | Vmic (cm3 g−1) | Vmic/VT (%) | Dp (nm) | |
|---|---|---|---|---|---|
| a SBET-BET surface area, VT-total pore volume, Vmic-micropore volume, Vmic/VT-micropore percentage, Dp-average pore diameter. | |||||
| BAC-U | 1489.88 | 0.695 | 0.647 | 93.09 | 2.802 |
| BAC-N | 1029.26 | 0.566 | 0.056 | 9.89 | 2.523 |
After the redox process, the pores of BAC-N are severely damaged due to the strong oxidation and corrosion by nitric acid. The microporous structures collapsed or merged, resulting in a significant reduction in specific surface area.31 Compared with the ultrasonic method, the specific surface area and total pore volume are reduced by 30.92% and 18.56% respectively, and mainly exists in the form of mesoporous. In the carbonization process, the specific surface area and pore volume reduced with the increase in the N-doping content. This is because the C–O/C![[double bond, length as m-dash]](https://www.rsc.org/images/entities/char_e001.gif) O bonds on activated carbon gradually converted to C–N/C
O bonds on activated carbon gradually converted to C–N/C![[double bond, length as m-dash]](https://www.rsc.org/images/entities/char_e001.gif) N during the doping process. The original carbon skeleton arrangement is changed so that the micropores are changed to mesopores.32
N during the doping process. The original carbon skeleton arrangement is changed so that the micropores are changed to mesopores.32
3.3 EDS
Surface elemental composition of N-doped activated carbon was measured by X-ray energy dispersive spectroscopy. As shown in Table 2, the sample is mainly composed of three elements: C, N, and O. H in the samples cannot be identified with this method. N-doping mainly occurs during pyrolysis in the ultrasonic method and the relative content of N element is only 5.92% in BAC-U. The sublimation temperature of the solid nitrogen source, dicyandiamide, is about 205 °C. When the sample is calcined at 200 °C, dicyandiamide is slowly decomposed to form a gaseous nitrogen source and combines with the carbon skeleton.| C (%) | N (%) | O (%) | |
|---|---|---|---|
| BAC-U | 74.52 | 5.92 | 19.57 |
| BAC-N | 67.77 | 14.13 | 18.11 |
The doping extent in BAC-N prepared by the redox method is enhanced and the relative content of N element is 14.13%. This is due to the following reasons: first, the surface of the activated carbon is oxidized by nitric acid, resulting in the formation of a large number of weak acidic carboxyl groups33 and some –NO2 groups. These acidic groups are capable of the acid–base neutralization of dicyandiamide during the reduction process. A large amount of the nitrogen source is bonded to the surface of activated carbon, and N-doping gets enhanced. Second, the C–O/C![[double bond, length as m-dash]](https://www.rsc.org/images/entities/char_e001.gif) O bonds formed by oxidation on the surface of the sample is more easily replaced by N element, and will be converted to C–N/C
O bonds formed by oxidation on the surface of the sample is more easily replaced by N element, and will be converted to C–N/C![[double bond, length as m-dash]](https://www.rsc.org/images/entities/char_e001.gif) N during carbonization.32 However, in the actual pyrolysis process, there is volatile loss of dicyandiamide, reducing the effect of mixing N.
N during carbonization.32 However, in the actual pyrolysis process, there is volatile loss of dicyandiamide, reducing the effect of mixing N.
3.4 FT-IR and XPS
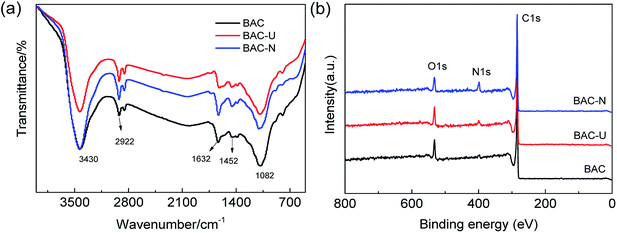
FT-IR spectroscopy was performed to investigate the chemical bonds in BAC, BAC-U and BAC-N. In order to eliminate the influence of nitrogen atmosphere during carbonization, BAC is used as a blank control sample. As shown in Fig. 2(a), BAC shows the characteristic peak of a weak C–NO2 stretching vibration and the N–H bending vibration of amines around 1384 cm−1 and 1632 cm−1, respectively. Compared with BAC, the N–H bending vibration of BAC-U and BAC-N is more prominent at 1632 cm−1. Simultaneously, the relative intensity of the peak at 3430 cm−1 increases in BAC-U and BAC-N, which proves the enhancement of the N–H stretching vibration. The stretching and bending vibrations of the C–H bonds in the modified samples are enhanced at 1452 cm−1 and 2922 cm−1, respectively. At approximately 1082 cm−1, a difference in the intensities of the stretching vibrations of C–O bonds is not obvious.The elemental composition and chemical bond types in the sample materials were established using X-ray photoelectron spectroscopy. As shown in Fig. 2(b), the three signal peaks for BAC-U correspond to C 1s (284.6 eV), N 1s (398.6 eV), and O 1s (532.6 eV). The N 1s peak of BAC-U is weak, while that of BAC-N is obviously increased. This indicates that the N element was successfully doped, and the doping amount with the redox method is higher.
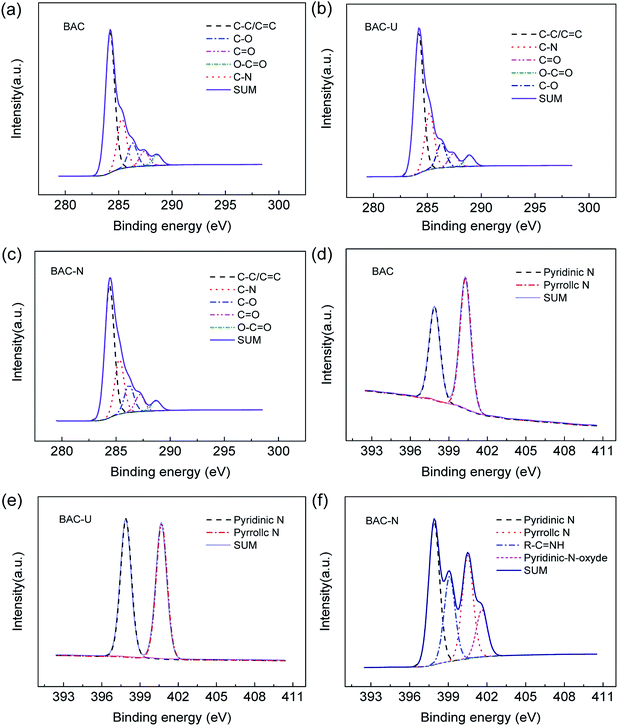
Fig. 3(a–c) shows the C 1s spectra of samples. Obviously, there is no change in the type of chemical bonds before and after doping. In the C 1s spectra, three major peaks with binding energy at 284.2 eV, 285.2 eV and 286.3 eV can be identified as C–C/C![[double bond, length as m-dash]](https://www.rsc.org/images/entities/char_e001.gif) C, C–N and C–O, respectively. There are also two weaker peaks corresponding to C
C, C–N and C–O, respectively. There are also two weaker peaks corresponding to C![[double bond, length as m-dash]](https://www.rsc.org/images/entities/char_e001.gif) O and O–C
O and O–C![[double bond, length as m-dash]](https://www.rsc.org/images/entities/char_e001.gif) O at 287.4 eV and 288.9 eV, respectively. The doping of N could improve electronic conductivity and stability, and optimize electronic structure.34
O at 287.4 eV and 288.9 eV, respectively. The doping of N could improve electronic conductivity and stability, and optimize electronic structure.34
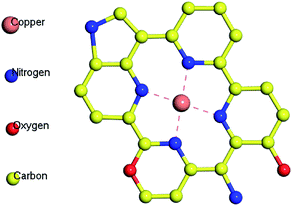
Fig. 3(d–f) shows the N 1s spectrum of samples. The chemical bond of N has been significantly changed. Affected by the N2 atmosphere in the carbonization process, BAC is loaded with trace amounts of N element, mainly in the form of pyridinium nitrogen (397.9 ± 0.3 eV) and pyrrole nitrogen (400.5 ± 0.3 eV). The N element in BAC-U is in the same form as in the original material, but the relative content of pyridinium nitrogen is obviously increased. The sp2 hybridized orbital of pyridinium nitrogen is occupied by a lone pair of electrons, which can react with metal ions to form complexes and improve the adsorption capacity of this activated carbon species.35 Fig. 4 is a partial structural model of Cu(II) adsorption by activated-carbon (H atoms have been omitted).13,21,36 The common coordination number of copper(II) is 4. It can easily coordinate with pyridine nitrogen atoms on four adjacent six-membered rings to form a planar square structure. Pyrrole N is linked by a hydrogen atom and needs to be protonated to be utilized such as by changing the pH.21,36
As shown in Fig. 3(f), the N element form of BAC-N significantly changed. In addition to the pyridinium and pyrrole nitrogens, R–C![[double bond, length as m-dash]](https://www.rsc.org/images/entities/char_e001.gif) NH and R–NH2 are formed at 399.1 (±0.3 eV) and 401.6 (±0.3 eV). The N atom on side chain amines also plays an important role in complexing metal ions. The electron cloud density of the N atom is higher due to electron migration from adjacent carbon rings, which makes it more attractive to copper(II).37
NH and R–NH2 are formed at 399.1 (±0.3 eV) and 401.6 (±0.3 eV). The N atom on side chain amines also plays an important role in complexing metal ions. The electron cloud density of the N atom is higher due to electron migration from adjacent carbon rings, which makes it more attractive to copper(II).37
3.5 Adsorption experiments
The adsorption rate of Cu(II) on different samples is investigated by adsorption kinetics. The pseudo first-order and pseudo-second-order dynamics model curves are shown in Fig. 5. The kinetic model is determined by the correlation coefficient R2 and the standard deviation SD. As can be seen from Table 3, the calculated correlation coefficient value for PSO is much higher than that for PFO, and the standard deviation of PSO is much smaller than for PFO, indicating that the pseudo-second-order model is suitable to describe the adsorption kinetics of Cu(II) on N-doped activated carbon. Simultaneously, the quasi-second-order kinetic constant (k2) can be used to compare the adsorption rates of the same adsorption process. Since the kinetic diameter of Cu(II) is close to the pore size of micropores, the adsorption rate on BAC-U that with a large number of micropores is faster and the k2 value is higher. Comparing the actual effects of the two adsorbents at the same initial concentration, the equilibrium adsorption of Cu(II) by the redox method sample was 42.19% higher than that of the ultrasonic method sample.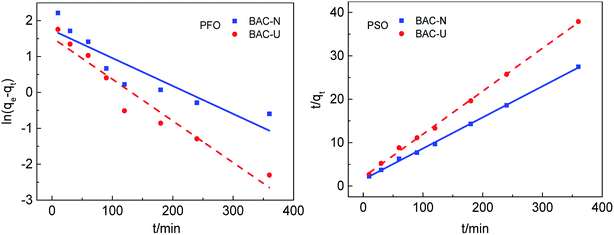 | ||
| Fig. 5 Kinetic models of Cu(II) adsorption by BAC-U and BAC-N at 298 K. The adsorption time points are 10, 30, 60, 90, 120, 180, 240 and 360 min, respectively. | ||
| qexp (mg g−1) | PFO | PSO | |||||||
|---|---|---|---|---|---|---|---|---|---|
| qcal (mg g−1) | k1 (min−1) | R2 | SD (%) | qcal (mg g−1) | k2 (g mg min−1) | R2 | SD (%) | ||
| BAC-U | 9.60 | 4.62 | 11.62 × 10⁻³ | 0.9321 | 306.82 | 10.10 | 4.75 × 10⁻³ | 0.9983 | 7.35 |
| BAC-N | 13.65 | 5.68 | 7.78 × 10⁻³ | 0.8101 | 482.92 | 13.95 | 3.47 × 10⁻³ | 0.9988 | 3.73 |
The diffusion of Cu(II) on the adsorbents is further analyzed by the IPD model. Combining the data from Fig. 6 and Table 4, the adsorption process of Cu(II) by N-doped activated carbon is mainly divided into two steps. The first step is the diffusion of Cu(II) from the solution onto the BAC-U/BAC-N macroporous surfaces. In the second step, Cu(II) slowly diffuses into the internal micropores and mesopores of BAC-U/BAC-N, and is adsorbed on their active sites. Comparing the Kid1 and Kid2 values of the activated carbon, the diffusion rates via macropores in the first step are obviously higher than those through micropores and mesopores in the second step, which indicates that the diffusion in micropores and mesopores is the main rate control step.38 Comparing the Kid1 and Kid2 values of differently activated carbons, the diffusion rate of BAC-N for both stages is obviously better than that of BAC-U. This may be attributed to the large number of macropores and mesopores on the BAC-N surface, which is beneficial to the diffusion of Cu(II).
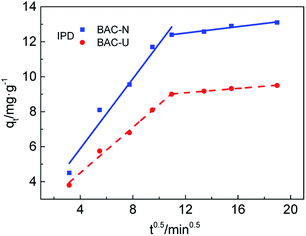 | ||
| Fig. 6 IPD fitting for BAC-U and BAC-N at 298 K divided into two steps: macroporous diffusion and micro-mesoporous diffusion. | ||
| Step 1 | Step 2 | |||
|---|---|---|---|---|
| Kid1 | R12 | Kid2 | R22 | |
| BAC-U | 0.6514 | 0.9897 | 0.0625 | 0.9866 |
| BAC-N | 0.9999 | 0.9615 | 0.0911 | 0.9454 |
The thermodynamic parameters such as Gibbs free energy, entropy and enthalpy during the adsorption reaction can be used to study the adsorption mechanism of nitrogen-doped activated carbon for Cu(II). The thermodynamic fitting curves of N-doped activated carbons are shown in Fig. S2.† The thermodynamic parameters are calculated, as shown in Table 5. As shown in Table 5, the enthalpies of both N-doped activated carbons are greater than zero, indicating that the adsorption of Cu(II) is an endothermic process. The ion motion in solution is more intense with the increase in temperature, which is beneficial to the adsorption process. The entropies being positive numbers illustrates that the disorder degree of the adsorbent surface increases during the adsorption process. When the temperature is 293 K, the Gibbs free energy of BAC-U is greater than zero, indicating that the adsorption process at this time cannot be spontaneously performed, and the external environment is required to provide energy. In contrast, the adsorption process of BAC-N at normal temperature can proceed spontaneously because all Gibbs free energies are less than zero.24
| ΔH0 (kJ mol−1) | ΔS0 (J mol−1 K−1) | ΔG0293 (kJ mol−1) | ΔG0298 (kJ mol−1) | ΔG0308 (kJ mol−1) | ΔG0318 (kJ mol−1) | ΔG0328 (kJ mol−1) | |
|---|---|---|---|---|---|---|---|
| BAC-U | 6.29 | 21.13 | 0.098 | −0.006 | −0.218 | −0.429 | −0.640 |
| BAC-N | 17.77 | 66.67 | −1.764 | −2.097 | −2.764 | −3.431 | −4.097 |
The adsorption abilities and adsorption capacities of the two N-doped activated carbons are compared by isothermal adsorption experiments. The fitting curves of two isothermal adsorption models are shown in Fig. 7. The best theoretical model is determined by the correlation coefficient R2. As shown in Table 6, the correlation coefficients for the Freundlich curve are larger, which means that the adsorption process of N-doped activated carbons for copper(II) ions is more consistent with the Freundlich model. The adsorption process is dominated by monolayer chemical adsorption, and various nitrogen-containing groups on the surface of adsorbent particles form complexes with heavy metal ions in solution, thereby achieving effective adsorption.
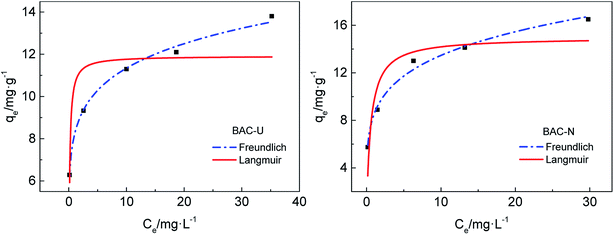 | ||
| Fig. 7 Isothermal adsorption models for the adsorption of Cu(II) by BAC-U and BAC-N at 298 K, adsorption time 24 h. | ||
| Langmuir | Freundlich | |||||
|---|---|---|---|---|---|---|
| qm (mg g−1) | Kα (L mg−1) | R2 | KF | 1/n | R2 | |
| BAC-U | 11.9160 | 7.6022 | 0.6724 | 8.2158 | 0.1401 | 0.9933 |
| BAC-N | 14.9722 | 1.7846 | 0.7592 | 8.5059 | 0.1993 | 0.9875 |
The Freundlich model is based on an empirical formula that can be used to explain part of experimental facts, but does not fully explain the adsorption mechanism. KF is the Freundlich model constant, which is related to the affinity between adsorbent and adsorbate,39 indicating the adsorption capacity of the adsorbent. The KF of BAC-N is larger than that of BAC-U, which proves that BAC-N has stronger affinity with Cu(II) and higher adsorption capacity. Compared with BAC-U, the content of pyridinium nitrogens and amine groups that play a major role during the adsorption process is higher in BAC-N.
The function of temperature 1/n is used to describe the adsorption strength and is only related to the adsorption affinity.39 At 0.1 < 1/n < 1, the adsorbate can be easily adsorbed by the adsorbent material in solution. On the contrary, the adsorption reaction is difficult if 1/n is greater than 1. Obviously, the adsorption process is reversible at 1/n = 1. It can be seen from Table 6 that 1/n values of both adsorbents are in the range of 0.1–1, indicating that the adsorption process for Cu(II) proceeds easily at normal temperature.
3.6 Adsorption performance of redox method
The changes of surface functional groups after different steps of the redox process are analyzed by FT-IR and adsorption experiments. As can be seen from Fig. 8(a), the nitrogen–oxygen functional groups in the structure of BAC-N1 significantly increase after nitric acid oxidation. A small amount of C![[double bond, length as m-dash]](https://www.rsc.org/images/entities/char_e001.gif) O stretching vibration appears in the sample at 1706 cm−1. The single peak around 3430 cm−1 can be assigned to the N–H stretching vibration associated with primary and secondary amines, and the two peaks at approximately 1626 cm−1 and 1540 cm−1 are attributed to the N–H in-plane bending vibration of amines. The broad peak at about 1330 cm−1 is due to the N–O stretching vibration of the nitro compound. Simultaneously, the stretching vibration of the sp3 C–H at 2922 cm−1 is enhanced, and the weak peak at 1459 cm−1 confirms the presence of C–H bending vibrations. The peak at around 1104 cm−1 is ascribed to the C–O stretching vibration.
O stretching vibration appears in the sample at 1706 cm−1. The single peak around 3430 cm−1 can be assigned to the N–H stretching vibration associated with primary and secondary amines, and the two peaks at approximately 1626 cm−1 and 1540 cm−1 are attributed to the N–H in-plane bending vibration of amines. The broad peak at about 1330 cm−1 is due to the N–O stretching vibration of the nitro compound. Simultaneously, the stretching vibration of the sp3 C–H at 2922 cm−1 is enhanced, and the weak peak at 1459 cm−1 confirms the presence of C–H bending vibrations. The peak at around 1104 cm−1 is ascribed to the C–O stretching vibration.
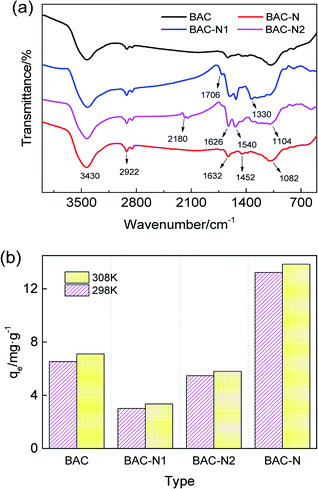 | ||
| Fig. 8 FT-IR (a) and histogram (b) for the changes of surface functional groups and equilibrium adsorption capacity during redox modification process, respectively. | ||
BAC-N2, obtained by the reaction with dicyandiamide, exhibits a new N![[triple bond, length as m-dash]](https://www.rsc.org/images/entities/char_e002.gif) C stretching vibration at around 2180 cm−1. The N–H stretching vibration at 3430 cm−1 and the N–H bending vibrations at 1626 cm−1 and 1540 cm−1 are all further enhanced. The enhancement of the N–H stretching vibration at 3430 cm−1, the increase in the intensity of the N–H bending vibrations at 1626 cm−1 and 1540 cm−1, and the attenuation of the N–O vibration for C–NO2 at 1330 cm−1 indicate that the load of N element is increased during the reaction, and the functionalities that involve nitrogen are transformed. The intensity of the peak at 1706 cm−1 is weakened, but the peak at 1104 cm−1 is strengthened, which means that C
C stretching vibration at around 2180 cm−1. The N–H stretching vibration at 3430 cm−1 and the N–H bending vibrations at 1626 cm−1 and 1540 cm−1 are all further enhanced. The enhancement of the N–H stretching vibration at 3430 cm−1, the increase in the intensity of the N–H bending vibrations at 1626 cm−1 and 1540 cm−1, and the attenuation of the N–O vibration for C–NO2 at 1330 cm−1 indicate that the load of N element is increased during the reaction, and the functionalities that involve nitrogen are transformed. The intensity of the peak at 1706 cm−1 is weakened, but the peak at 1104 cm−1 is strengthened, which means that C![[double bond, length as m-dash]](https://www.rsc.org/images/entities/char_e001.gif) O groups are converted to C–O during the reaction process, and dicyandiamide acts as the reductant.
O groups are converted to C–O during the reaction process, and dicyandiamide acts as the reductant.
After high temperature carbonization, the N element of sample is redistributed, accompanied by the transformation of nitrogen-containing functional groups. The N![[triple bond, length as m-dash]](https://www.rsc.org/images/entities/char_e002.gif) C stretching vibration disappears at 2180 cm−1 on the spectrum, and the vibration peak of N–O for C–NO2 at 1384 cm−1 is correspondingly weakened. The N–H bending vibration at 1632 cm−1 and the N–H stretching vibration at 3430 cm−1 are more obvious than those for BAC-N2. Simultaneously, the peak at 1632 cm−1 can be assigned to the C
C stretching vibration disappears at 2180 cm−1 on the spectrum, and the vibration peak of N–O for C–NO2 at 1384 cm−1 is correspondingly weakened. The N–H bending vibration at 1632 cm−1 and the N–H stretching vibration at 3430 cm−1 are more obvious than those for BAC-N2. Simultaneously, the peak at 1632 cm−1 can be assigned to the C![[double bond, length as m-dash]](https://www.rsc.org/images/entities/char_e001.gif) N stretching vibration of carbocyclic rings, indicating that N exists mainly in the form of pyridine or pyrrolidine. In summary, there must be some loss of N during high temperature carbonization.
N stretching vibration of carbocyclic rings, indicating that N exists mainly in the form of pyridine or pyrrolidine. In summary, there must be some loss of N during high temperature carbonization.
As can be seen from Fig. 8(b), the equilibrium adsorption amount of BAC-N is greatly improved compared to unmodified activated carbon. However, the adsorption performance of BAC-N1 oxidized by nitric acid at 25 °C is significantly reduced. According to the chemical reaction (11), concentrated nitric acid with strong oxidizing properties has severe corrosive effects on the surface of activated carbon. The performance of this adsorbent has been proved to be extremely low since the original pore structure collapsed or the pores were clogged. In general, the adsorption performance of activated carbon modified by concentrated nitric acid is enhanced and most of the reactions occur at high temperature.
| BAC + HNO3 → BAC–COOH + CO2 + NO2 | (11) |
| BAC–COOH + C2H4N4 → BAC–CO–NH–R | (12) |
| BAC–CO–NH–R → BAC–N | (13) |
The adsorption performance of the product loaded with our solid nitrogen source has a certain recovery (Fig. 8(b)). The weak acidic surface of the oxidized activated carbon tends to react with basic nitrogen sources by following the reaction in eqn (12), which makes activated carbon load a certain amount of nitrogenous groups, which then easily form metal complexes with copper ions. However, the pore channels are blocked in the oxidation process, and the active sites for the complexation of Cu(II) are not completely exposed. The adsorbent, which has been loaded with a large amount of N element, expands and regenerates the blocked pores after high-temperature carbonization. As shown by formula (13), the adsorptive active sites are exposed with the redistribution of nitrogen groups, so the adsorption capacity of the sample is visibly increased by 102.68% compared to unmodified activated carbon.
4. Conclusions
Using dicyandiamide as a solid nitrogen source, a biomass-activated carbon was N-doped by an ultrasonic method and a redox method, and the doping extent was analyzed by Cu(II) adsorption experiments.The impregnation time of the nitrogen source can be shortened to 40 minutes by simply operating this ultrasonic method. However, ultrasounds can destroy the pore channels on the surface of the activated carbon. The doping content of the as-prepared product is only 5.92%, due to the obvious loss of the nitrogen source during carbonization. In the redox process, nitric acid mainly plays a role in oxidation and corrosion. Compared with the ultrasonic method, after redox reactions mesopores account for a large proportion in the product. However, the surface of oxidized activated carbon contains a large amount of acidic groups, which can stabilize nitrogen sources and reduce the loss of N in the carbonization process. The N-doping amount of redox products is up to 14.13%, which realizes the effective load of nitrogen element.
The adsorption performance of the samples after oxidation by nitric acid is significantly reduced, and then is improved after reaction with the nitrogen source. Lastly, it is necessary to pyrolyze the sample to achieve channel expansion and nitrogenous group redistribution. In subsequent studies, a solid nitrogen source with stronger alkalinity can be selected to react with oxidized activated carbons to enhance the combination of nitrogen source and sample. Moreover, it is conceivable to reduce carbonization temperature and control the carbonization time in order to reduce the loss of loaded nitrogen source and the conversion to effective adsorbent groups while reopening the pores.
According to our adsorption experiment results, the kinetic models of N-doped activated carbons conform to the quasi-secondary kinetics. The adsorption isotherms conform to the Freundlich model, and the adsorption process proceeds at higher temperatures. The adsorption capacity of N-doped activated carbon produced with the redox method is significantly higher than that of the ultrasonic method sample, indicating that the adsorption of heavy metal ions is weak on single developed microporous structures and pyrrole groups, while pyridinium nitrogens and amine groups play an important role in the adsorption process.
Conflicts of interest
There are no conflicts to declare.Acknowledgements
The authors thank the financial supports of the Natural Science Foundation of Shandong Province (ZR2017MB015), the PetroChina Innovation Foundation (2017D-5007-0601) and the State Key Laboratory of Heavy Oil Research (SLKZZ-2017002).Notes and references
- N. Arena, J. Lee and R. Clift, J. Cleaner Prod., 2016, 125, 68–77 CrossRef CAS.
- E. Y. L. Teo, L. Muniandy, E.-P. Ng, F. Adam, A. R. Mohamed, R. Jose and K. F. Chong, Electrochim. Acta, 2016, 192, 110–119 CrossRef CAS.
- J. Fernandez, J. Bonastre, J. Molina and F. Cases, Eur. Polym. J., 2018, 103, 179–186 CrossRef CAS.
- S. Alvarez Torrellas, R. Garcia Lovera, N. Escalona, C. Sepulveda, J. Luis Sotelo and J. Garcia, Chem. Eng. J., 2015, 279, 788–798 CrossRef.
- H. Chen, D. Chen and L. Hong, Appl. Energy, 2015, 156, 767–775 CrossRef CAS.
- O. Pezoti Junior, A. L. Cazetta, R. C. Gomes, E. O. Barizao, I. P. A. F. Souza, A. C. Martins, T. Asefa and V. C. Almeida, J. Anal. Appl. Pyrolysis, 2014, 105, 166–176 CrossRef.
- M. Danish and T. Ahmad, Renewable Sustainable Energy Rev., 2018, 87, 1–21 CrossRef CAS.
- A. Jain, R. Balasubramanian and M. P. Srinivasan, Chem. Eng. J., 2016, 283, 789–805 CrossRef CAS.
- W. M. A. W. Daud and A. H. Houshamnd, J. Nat. Gas Chem., 2010, 19, 267–279 CrossRef CAS.
- L. Monser and N. Adhoum, Sep. Purif. Technol., 2002, 26, 137–146 CrossRef CAS.
- K. M. Doke and E. M. Khan, Arabian J. Chem., 2017, 10, S252–S260 CrossRef CAS.
- Y. Liu, X. Liu, W. Dong, L. Zhang, Q. Kong and W. Wang, Sci. Rep., 2017, 7, 12437 CrossRef PubMed.
- F. Shen, J. Liu, Z. Zhang, Y. Dong and C. Gu, Fuel Process. Technol., 2018, 171, 258–264 CrossRef CAS.
- Y. Zhang, K. Zhang, Y. Luo, C. Li and L. Jiang, Huaxi Yike Daxue Xuebao, 1995, 26, 322–325 CAS.
- J. Jaramillo, P. Modesto Alvarez and V. Gomez-Serrano, Fuel Process. Technol., 2010, 91, 1768–1775 CrossRef CAS.
- Z. Cai, X. Yang, G. Lin, C. Chen, Y. Chen and B. Huang, RSC Adv., 2018, 8, 20327–20333 RSC.
- Z. Ye, F. Wang, C. Jia and Z. Shao, J. Mater. Sci., 2018, 53, 12374–12387 CrossRef CAS.
- S. Chen, D. Chen, W. Wang, H. Quan, X. Luo and L. Guo, J. Mater. Sci., 2017, 52, 5117–5132 CrossRef CAS.
- L. Huang, M. He, B. Chen and B. Hu, ACS Sustainable Chem. Eng., 2018, 6, 10191–10199 CrossRef CAS.
- Y. Wang, W. Zhao, W. Zheng, S. Chen and J. Zhao, Nanomaterials, 2019, 9, 265 CrossRef CAS PubMed.
- Q. Qin, X. Wu, L. Chen, Z. Jiang and Y. Xu, RSC Adv., 2018, 8, 1744–1752 RSC.
- J. Liu, H. Fan, G. Gong and Q. Xie, in Energy and Environment Materials, ed. X. F. Tang, Y. Wu, Y. Yao and Z. Z. Zhang, 2013, vol. 743–744, pp. 545–550 Search PubMed.
- P. Milich, F. Moller, J. Piriz, G. Vivo and N. Tancredi, Sep. Sci. Technol., 2002, 37, 1453–1467 CrossRef CAS.
- S. Gao, T. Luo, Q. Zhou, W. Luo, H. Li and L. Jing, J. Colloid Interface Sci., 2018, 517, 9–17 CrossRef CAS PubMed.
- D. Mohan, S. Rajput, V. K. Singh, P. H. Steele and C. U. Pittman Jr, J. Hazard. Mater., 2011, 188, 319–333 CrossRef CAS PubMed.
- T. L. Silva, A. Ronix, O. Pezoti, L. S. Souza, P. K. T. Leandro, K. C. Bedin, K. K. Beltrame, A. L. Cazetta and V. C. Almeida, Chem. Eng. J., 2016, 303, 467–476 CrossRef CAS.
- S. Zhang, T. Shao, H. S. Kose and T. Karanfil, Environ. Toxicol. Chem., 2012, 31, 79–85 CrossRef CAS PubMed.
- O. Pezoti, A. L. Cazetta, K. C. Bedin, L. S. Souza, A. C. Martins, T. L. Silva, O. O. Santos Junior, J. V. Visentainer and V. C. Almeida, Chem. Eng. J., 2016, 288, 778–788 CrossRef CAS.
- A. Ei-Sikaily, A. El Nemr, A. Khaled and O. Abdelwehab, J. Hazard. Mater., 2007, 148, 216–228 CrossRef PubMed.
- A. Durairaj, T. Sakthivel, S. Ramanathan, A. Obadiah and S. Vasanthkumar, Cellulose, 2019, 26, 3313–3324 CrossRef CAS.
- T. Zhou, X. Zhao, S. Wu, L. Su and Y. Zhao, J. Environ. Sci., 2019, 77, 104–114 CrossRef PubMed.
- Y. Liu, S. Wang, S. Xu and S. Cao, Mater. Res. Bull., 2015, 65, 27–35 CrossRef CAS.
- Z. Tu, Q. He, X. Chang, Z. Hu, R. Gao, L. Zhang and Z. Li, Anal. Chim. Acta, 2009, 649, 252–257 CrossRef CAS PubMed.
- L.-L. Li, X.-Q. Feng, R.-P. Han, S.-Q. Zang and G. Yang, J. Hazard. Mater., 2017, 321, 622–628 CrossRef CAS PubMed.
- A. Juneja, T. S. Macedo, D. R. Magalhaes Moreira, M. B. Pereira Soares, A. C. Lima Leite, J. K. de Andrade Lemoine Neves, V. R. Alves Pereira, F. Avecilla and A. Azam, Eur. J. Med. Chem., 2014, 75, 203–210 CrossRef CAS PubMed.
- X.-P. Ye, G.-J. Wang, P. Pan, Z.-P. Zhang, W.-N. Wu and Y. Wang, Chin. J. Inorg. Chem., 2014, 30, 2789–2795 CAS.
- Y. Gutha, Y. Zhang, W. Zhang and X. Jiao, Int. J. Biol. Macromol., 2017, 97, 85–98 CrossRef CAS PubMed.
- Y. Huang, H. Liu, Y. Ma, Y. Wang and S. Chen, Chem. Ind. Eng. Prog., 2018, 37, 3092–3099 Search PubMed.
- Y. Huang, H. Liu, Z. Wang, J. Zhu and S. Chen, J. Chem. Eng. Chin. Univ., 2018, 32, 940–948 CAS.
Footnote |
| † Electronic supplementary information (ESI) available. See DOI: 10.1039/c9ra07191a |
| This journal is © The Royal Society of Chemistry 2019 |

