 Open Access Article
Innovative flat-plate solar collector (FPC) with coloured water flowing through a transparent tube†
Sedong Kim a,
Hyomin Jeongb,
Jin Young Parkc,
Seung Yeop Baeka,
Ajeong Leea and
Soon-Ho Choi
 *b
*b
aDept. of Energy and Mech. Eng., Graduate School, Gyeongsang National University, South Korea. E-mail: sdkim@gnu.ac.kr
bDept. of Energy and Mech. Eng., Institute of Marine Industry, Gyeongsang National University, Cheondaegukchi-Gil 38, Tongyeong, 53064, South Korea. E-mail: hmjeong@gnu.ac.kr; choi_s_h@naver.com
cDept. of Energy Sci. and Eng., DGIST, Daegu, 72988, South Korea
First published on 5th August 2019
Abstract
Of all types of solar collector, the flat-plate collector (FPC) has the lowest performance, but is the most widely used because of its low cost and easy maintenance. To effectively collect solar light in the conventional FPCs, metal tubes with a high thermal conductivity are installed under an absorption plate. However, in this study, in order to take advantage of the sunlight absorption capacity of coloured water flowing through a tube, a transparent tube was installed on the absorbing plate. The resulting new FPC suggested in this study is a direct absorption solar collector (DASC). To investigate its performance as a function of the colours of the working fluid, four colours of water were supplied to the FPC: transparent (pure water), red, violet and black. From the experimental results, the new FPC suggested in this study was found to have about 5% higher performance than those of the conventional types of FPC, which means that the new concept of FPC can profitably replace the conventional FPCs.
Introduction
It is well known that global warming and its consequent climate change will be a serious threat to the future of humanity.1–3 The causes of global warming are various, however, one of the main causes is that the concentration of carbon dioxide (CO2) in the atmosphere has been increased by the continued use of fossil fuels since the Industrial Revolution.4–6 The CO2 contained in the atmosphere absorbs light from a specific band of incident sunlight and reflects this light back to the atmosphere and the Earth's surface again.7–9 Today, the reduction of CO2 emissions is an indispensable task to maintain human civilization, and is part of the agenda of sustainable social development.10–12 To contain and reduce the CO2 concentration in the atmosphere, the application of renewable energies should be extended. Unlike other renewable energy resources, solar energy can be collected by apparatus without moving parts, allowing it to be extracted solely through passive equipment. This means that solar energy applications are cost-effective in terms of maintenance, repair, overhaul, extension etc.At present, solar energy is predominantly used for generating electricity and heating; the former converts the sunlight directly into electricity by using photovoltaic solar cells and the latter indirectly converts sunlight into heat energy by using solar collectors with a working fluid. Solar collectors can also generate electricity through a conventional generating system coupled with a linear Fresnel collector (LFC), parabolic trough collector (PTC), paraboloid dish collector (PDC), and so on.13–15 Although the applications of solar thermal power systems have steadily increased, at present, most solar energy applications are in water heating systems for houses and buildings. However, in recent years, solar heating technologies have been expanded even to air-conditioning systems by coupling with an absorption system.16–18
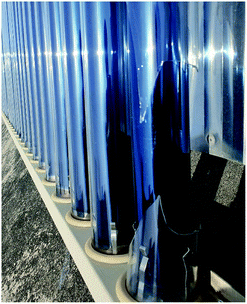
Of many different types of solar collectors, the flat-plate collector (FPC) and evacuated tube collector (ETC) are the most common for heating of homes and buildings.19–22 According to Choi,21 Struckmann23 and Humam et al.,24 FPC type solar collectors have the merits of a simple structure, a low installation cost and long-term durability while they have the two disadvantages of a relatively low thermal efficiency and a low temperature rise of the working fluid when compared to ETCs. ETC type solar collectors made of glass can achieve a temperature of the working fluid higher than that of the FTC type, but are easily damaged by a small external impact as shown in Fig. 1. Therefore, up to now, FPC has been the most popular type for domestic solar water heaters.
However, due to the low heat collection performance of FPCs, they have been combined with various technologies to improve their thermal efficiency in products on the market in recent years, in which the tubes passing through the working fluid are made of highly thermally conductive metals;25,26 those tubes are located under a dark coloured absorbing metal sheet based on copper;27,28 or the metal tubes are laser welded under the absorbing metal sheet in order to reduce the thermal resistance between the tubes and the metal sheet.29,30 Such improvements for increasing the thermal efficiency of FPCs inevitably raise their cost.
This study was conducted to suggest a new type of FPC with low cost and easy construction, which directly absorbs sunlight. The starting point is to make use of the dependence of light absorption rate on the colour of an object. As is well known, if electromagnetic waves are incident on an object, some of the incident electromagnetic waves are reflected from the surface, others pass through and the rest is absorbed by the object.31,32
What distinguishes visually an object to the human eye is that our brain perceives the visible light reflected from the object's surface through the receptor cells.33,34 Since visibly different colours indicate the different light absorbance rates of objects, it can be said that the light absorption rate varies depending on the surface colour of an object. The new FPC suggested in this study maximizes the light absorption by using a coloured liquid. In order for the coloured working fluid to directly absorb sunlight, the tubes passing through the working fluid should be transparent and should be installed on an absorption plate. Detailed information regarding the FPCs used in this study is presented in Section 3.
Furthermore, in this study the pump power was considered when evaluating the thermal efficiencies of FPCs. In a survey of previous studies, the authors noticed that many studies on solar collectors have not considered the input energy of the circulating pump when evaluating the solar collector efficiencies.35–40 Since most FPCs operate with the working fluid of water circulated by a small pump, the electrical power supplied to the pump is eventually dissipated in the form of heat energy into the working fluid. Therefore, when assessing the efficiencies of FPCs with forced circulation, this power consumed by the pump should be considered. For this, in this study, the inlet and outlet temperatures of the circulating pump were measured and incorporated when calculating the FPC's efficiency.
From this experimental study, it was seen that the thermal efficiency of the direct absorption type of FPC was seriously influenced by the colours of the working fluid, and black coloured working fluid showed the best thermal efficiency. In addition, it was confirmed that the suggested FPC with a transparent tube and black coloured working fluid had better heat collection capability than those of the conventional FPCs, which implies that the new FPC, characterized by low cost and easy production, could profitably replace the conventional FPCs.
Absorption and reflection of sunlight
Solar irradiance
The surface temperature of the Sun is about 5800 K (ref. 41 and 42) and the energy density per each wavelength radiated from the Sun's surface can be theoretically predicted by the theory of black body radiation given by eqn (1).43,44
 | (1) |
 | (2) |
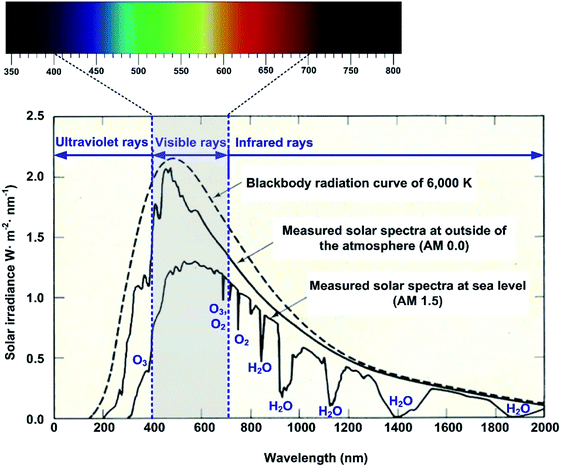
Fig. 2 shows the theoretical solar irradiance spectrum calculated from eqn (1), and the measured spectra outside of the atmosphere and at the Earth's surface. Notably, the solar irradiance measured on the Earth's surface is quite different from the theoretical irradiance curve due to the light absorbance of the various gas components of the atmosphere such as O3, O2, N2, H2O, CO2, Ar and so on.45,46 The difference between the theoretical irradiance and the measured irradiance mainly results from the light absorption by O3, O2 and H2O in the atmosphere.
As seen in Fig. 2, visible rays, which can be perceived through the human eye, are approximately distributed from 400 to 700 nm (ref. 47 and 48) and their power fraction at ground level is about 40% to 50%, which varies from region to region and depends on the air mass (AM). According to Moan, (ch. 7, ref. 49) in the total solar insolation at sea level, about 6% is ultra-violet (UV), over 50% is visible (VIS) and the rest, about 40%, is infrared (IR). Therefore, the colour reflected from the surface of an object, as visually perceived through the human eye, will directly indicate the light energy absorption capacity of the object.
Comparison of the light absorption by coloured water
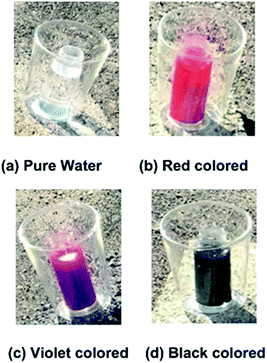
As briefly mentioned in the previous section, humans can visually perceive objects through visible light reflected from the surface of the object. This means that a substance with a certain colour cannot absorb light corresponding to that colour. Prior to the experiments for evaluating the new FPC suggested in this study, the authors investigated the absorbance capacities of visible light by different coloured liquids. The prepared coloured liquids were water mixed with pigments as shown in Fig. 3. Each sample in a glass bottle was placed into a glass cup to reduce the heat loss to the surrounding air and exposed to the sunlight for equal periods of 3 hours on the top of a building, placed about 30 cm apart from one another to avoid interference by their own shadows.The sample colours in the small glass bottles were transparent (pure water), white, violet, blue, green, yellow, red and black. Before the sunlight exposure experiment, the samples were left in a dark room, which guaranteed that all samples were under identical conditions at the start of the sunlight exposure experiment. The temperature rises of the samples were checked every hour during the sunlight exposure experiment.
Fig. 4 shows the temperature variations of the samples from 11:00 to 14:00 in the exposure experiment. This experiment was intentionally performed in late November, during the winter, and the atmospheric temperatures were about 14 to 22 °C during the experiment. In the experiment, since the clouds began to block the Sun after 12:00, the temperature rises of the samples were not noticeable from 12:00 to 14:00. As seen from the temperature rises of the coloured waters from 11:00 to 12:00 when the sky was clear, the temperature rise of the black coloured water was the highest and that of the white coloured water was the lowest, which was just as expected. Noteworthily, however, the white coloured water and the pure water (transparent) showed the same temperature rises. For an object that appears white to the human eye, most visible light is reflected from the surface of the object being viewed, while if an object appears transparent to the human eye this means that most visible light passes through the object. Therefore, the same temperature rises occurred for the pure water and the white coloured water during the sunlight exposure experiment.
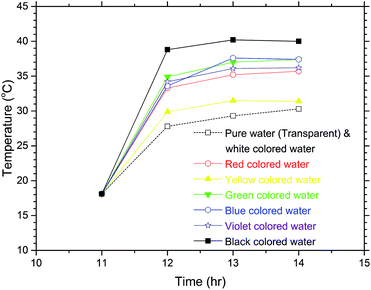 | ||
| Fig. 4 Temperature increases of the coloured water samples after sunlight exposure for 3 hours in the winter. The white coloured water shows nearly the same temperature variation as the pure water, which is transparent as seen in (a) of Fig. 3. | ||
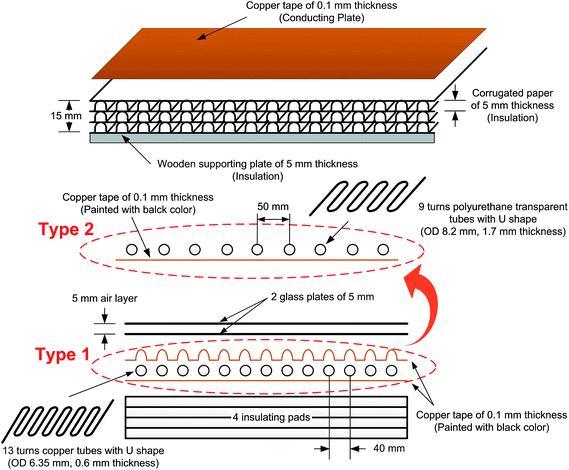
Flat-plate solar collector and experimental apparatus
In this experimental study, two FPCs were prepared, which will be called the Type 1 FPC and Type 2 FPC respectively hereinafter. The type 1 FPC is similar to the conventional one as shown in Fig. 5, and consisted of two transparent glass plates of 5 mm thickness; an upper black coloured copper plate to play the role of the absorbing plate; a U-shaped copper tube with 13 turns; a lower copper plate, not coloured; three insulating corrugated paper pads of 5 mm thickness; and one wooden bottom pad of 5 mm thickness. Although the conventional FPCs consist of the multi-pass flow configuration, the experimental FPCs of this study were made with a single pass flow configuration for fabrication convenience in the laboratory.After completely adhering the copper tape of 0.1 mm thickness to the first insulating pad, which was made of corrugated thick paper, the copper tube with 13 turns was placed on the copper tape and fixed with glue. The dimensions of the copper tube are 0.6 mm thick and 6.35 mm outer diameter (OD). Because the absorbing plate of the Type 1 FPC was also made of copper tape, the copper tape could be firmly attached to the copper tube. The copper tube (fixed on the copper tapes attached to the first insulating pad) was tightly covered with copper tape once more, and then spray-painted with black paint to absorb sunlight effectively. The total length of the copper tube for the Type 1 FPC is about 3.7 m (13 turns), only counting the length directly placed on the absorbing plate.
Since the Type 2 FPC directly absorbs sunlight through the working fluid of coloured water, the tube should be transparent and placed on the absorbing plate unlike in a Type 1 FPC. The material used for the transparent tube is polyurethane with a thickness of 1.7 mm and OD of 8.2 mm, which is the most similar size available on the market to that of the copper tube of the Type 1 FPC. The other components of the Type 2 FPC are the same as the Type 1 FPC and the total length of the transparent tube for the Type 2 FPC is about 3.0 m (9 turns).
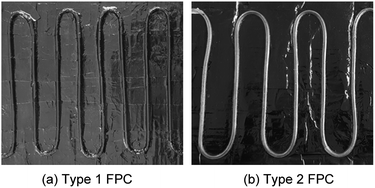
Fig. 6 shows the tubes of the two FPCs. The tube length difference of the two FPCs resulted from the material difference. Unlike a copper tube, if a polyurethane tube is bent with the same bending radius as the copper tube on the absorbing plate, the U bending section of the transparent polyurethane tube is folded. That is, the cross section of the polyurethane tube of a bending section cannot be maintained in a perfect circle due to folding. Consequently, the two FPCs of Type 1 and Type 2 were not constructed with the same tube length. However, by introducing the dimensionless area ratio of the tube surface area to the absorption plate area (AR = tube surface area/FPC surface area), we can eliminate any inconsistency in comparing the efficiencies of the two FPCs. The surface area of the absorbing plate, which is a copper plate painted black, is 0.16575 m2 (525 mm × 310 mm). Table 1 is a summary of the tube specifications used in the Type 1 and Type 2 FPCs.
| Type 1 FPC | Type 2 FPC | |
|---|---|---|
| Material | Copper | Polyurethane |
| OD (mm) | 6.35 | 8.2 |
| Thickness (mm) | 0.60 | 1.70 |
| ID (mm) | 5.15 | 4.80 |
| Tube length (m) | 3.7 | 3.0 |
| Turning of U shape | 13 | 9 |
| Absorbing plate area (m2) | 0.1675 | 0.1675 |
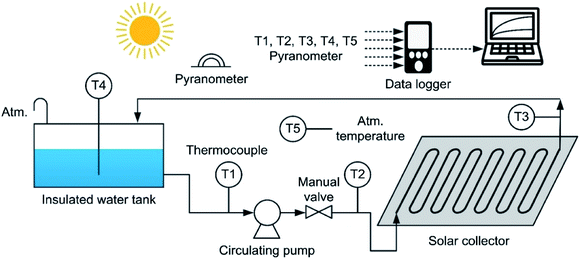
Fig. 7 shows the experimental apparatus, which consisted of an insulated water tank, a circulating pump, an FPC with a U-shaped heating tube, thermocouples to measure the water temperature at each point, a pyranometer, a data logger and a recording device.
Before the FPC performance test, the working fluid flowrates passing through each FPC tube were measured by using a measuring cylinder of 2 liter capacity and a stopwatch. The flowrate measurements were performed three times for each FPC, and then averaged. In the three flowrate measurements for each FPC, the deviations were only within ±0.1%. The thermocouples used for temperature measurement are T-type (copper–constantan) and have an accuracy of ±0.4%, which corresponds to ±0.5 °C. The temperatures were measured at 5 points: the pump suction side (T1), the pump discharge side (T2), which corresponds to the heating tube inlet, the heating tube outlet (T3), the water contained in the storage tank (T4) and the atmospheric air (T5). The thermocouples of T1 and T2 were installed to measure how much of the temperature rise of the working fluid was due to the pump power input. The pyranometer is a thermopile type and its accuracy is ±10 W m−2 based on the solar irradiation of 1000 W m−2. The measured data were recorded and saved in the data logger at the sampling period of 2 seconds.
Experimental results and discussion
It is well known that the thermal efficiencies of FPCs are greatly affected by the ambient air temperature, outdoor wind and the tilting angles.50,51 Although the sunlight exposure test shown in Fig. 3 was done in late November, the performance tests of the FPCs were intentionally carried out in January to obtain the conservative experimental results. Additionally, for collecting more conservative data, the FPCs were horizontally installed on the roof floor without tilting. Obviously, these experimental conditions would force the FPCs to have the worst performance. The FPC performance can be easily assessed by comparing the solar heat energy absorbed by the FPC surface to the thermal energy absorbed by the working fluid. The solar heat energy absorbed by the collector can be calculated through the following steps.
 | (3) |
Sabs = Stot![[thin space (1/6-em)]](https://www.rsc.org/images/entities/char_2009.gif) Apl, Apl,
| (4) |
| Qabs = Mcp(ave)ΔT, | (5) |
Since the working fluid is circulated by a centrifugal pump during the experiments, the pump power is eventually dissipated to the pumped liquid in the form of heat energy. Therefore, when evaluating the heat energy absorbed by the working fluid, the pump power should be subtracted from the temperature rise of the working fluid passing through the FPC. For this, the temperatures of the working fluid at two locations (T1 and T2) as shown in Fig. 7 were measured during all experiments. In every experiment, the temperatures measured at T2 were consistently 0.4 to 0.5 °C higher than the temperatures measured at T1, which confirms that the pump power should be considered in the calculation of the solar collector efficiency. The pump power dissipated in the form of heat energy can be calculated from eqn (6).52
| Qpp = ṁcp(ave)ΔTt, | (6) |
Normally, the working fluid of FPCs is forced to circulate by a pump. However, it was found that most previous studies did not consider the pump input energy at all. Since the pump power Qpp was eventually dissipated in the form of heat energy into the working fluid of the FPC, it should be subtracted from Qabs for evaluating the net heat energy gain of the working fluid. Therefore,
| Qnet = Qabs − Qpp. | (7) |
Then, the thermal efficiency of the FPC can be evaluated from53,54
 | (8) |
As mentioned in an earlier section, the areas of the Type 1 FPC and Type 2 FPC are identical while the dimensions of each tube used in the two FPCs are different. Therefore, the performance of the two FPCs cannot be directly compared. However, if the ratio of the FPC area to the total surface area of the tubes installed in the FPCs is introduced, this problem can be easily avoided. For this, the area ratio (eqn (9)) was newly defined.55–57
 | (9) |
 | (10) |
Fig. 8 shows the temperature variation of the working fluid (pure water) contained in the water storage tank of the Type 1 FPC and the solar irradiation data during the experiment lasting 2.5 hours. Table 1 is the summary of the data obtained from the experiment of the Type 1 FPC.
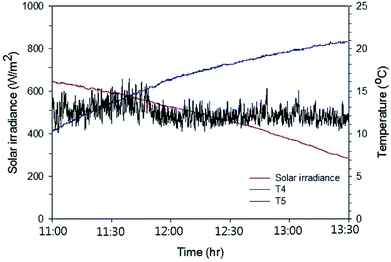 | ||
| Fig. 8 Solar irradiation and the temperature rise of the pure water passing through Type 1 FPC. The experiment was carried out for 2.5 hours from 11:00 and the water temperature and the ambient air temperature were measured through T4 (the working fluid temperature) and T5 (the ambient temperature) shown in Fig. 7. | ||
Since the experiment was performed in January and the FPC with the single pass flow configuration was placed horizontally on the roof floor, the water temperature rise was only about 10.5 °C. It can be seen in Table 1 that the heat energy (Qabs) absorbed by the working fluid is more than the heat energy (Sabs) irradiated on the FPC, which is apparently unphysical. This unrealistic measurement resulted from the pump power dissipated in the working fluid. However, when accounting for the pump power Qpp supplied to the working fluid, Qabs is certainly smaller than Sabs. Therefore, the pump power supplied to the working fluid should not be ignored when evaluating the thermal efficiency of an FPC with forced circulation of the working fluid. The thermal efficiency of the Type 1 FPC calculated from the measured data was about 36.5% in the ambient temperature range of 10 to 15 °C, which is about half the efficiency compared with the conventional tilted FPC with the multi-pass flow configuration.21
The same tests were carried out on the Type 2 FPC with the following colours of water: pure water, red, violet and black. Fig. 9 shows the temperature rise when the black coloured water was used in the Type 2 FPC and Table 3 is a summary of the measured data and calculated data for the Type 2 FPC with all of the tested water colours.
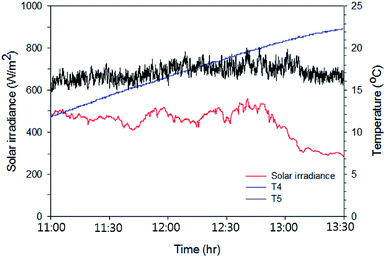 | ||
| Fig. 9 Solar irradiation and the temperature rise of the black coloured water passing through Type 2 FPC. The experiment was carried out for 2.5 hours from 11:00 and the water temperature and the ambient air temperature were measured through T4 (the working fluid temperature) and T5 (the ambient temperature) shown in Fig. 7. | ||
Comparing Tables 2 and 3, it can be seen that the heat input from the circulating pump to the working fluid caused a large difference in temperature even when the mass flowrate was very low. Possibly, this resulted from the measurement accuracy of the thermocouples. As already mentioned, the thermocouples used in this study were T-type (copper–constantan) with the accuracy ±0.5 °C. Although the pump outlet temperatures were always 0.4 to 0.5 °C higher than the pump inlet temperature in every experiment, the temperature difference between the pump inlet and outlet was unfortunately within the accuracy of the thermocouples. As shown in eqn (6), for the calculation of Qpp, the temperature difference between the pump inlet and outlet must be multiplied over the total experimental time. This means that even the small temperature difference of 0.1 °C will cause a large difference in the estimation of Qpp. Therefore, while it is clear that the pump outlet temperatures are higher than the pump inlet temperature, the precision of the temperature difference between the pump inlet and outlet is not guaranteed due to the accuracy limitation of the thermocouples used in this study. Since the data in Tables 2 and 3 were only based on the measured values, it should be noted that the Qpp calculated by eqn (6) includes quite a large deviation.
| Stota [kJ m−2] | Sabsb [kJ] | Tic [°C] | Tfd [°C] | cpe [kJ (kg °C)−1] | ρe [kg m−3] | ṁf [kg s−1] | Qppg [kJ] | Qabsh [kJ] | Qneti [kJ] | ηthj (%) |
|---|---|---|---|---|---|---|---|---|---|---|
| a Total solar irradiation per unit area during the experimental time, which was calculated by eqn (3).b Solar heat energy absorbed by the FPC and the FPCs area 0.16275 m2. Sabs is calculated by eqn (4).c Initial temperature of the water contained in the tank when the experiment is started, which is measured through T4 shown in Fig. 6.d Final temperature of the water contained in the tank when the experiment is ended, which is measured through T4 shown in Fig. 7.e cp and ρ are based on the average water temperature Tave = (Tf + Ti)/2.f Mass flowrate of water passing through the FPC.g Heat energy supplied to the circulating water by the centrifugal pump, which is calculated by eqn (6).h Heat energy absorbed by the water based on the water volume contained in the tank. It can be calculated from Mcp(ave)ΔT where M is the total mass of water contained in the tank and M = 18.19 kg.i Net solar heat energy absorbed by the working fluid, which is calculated by eqn (7).j The ratio of the net solar heat energy absorbed by the working fluid to the solar heat energy absorbed by the plate type collector, which is the thermal efficiency of the FPC and calculated by eqn (8). | ||||||||||
| 4369.32 | 711.11 | 10.30 | 20.80 | 4.189 | 998.9 | 0.03568 | 540.75 | 800.06 | 259.31 | 36.5 |
| Colour of working fluid | Stot [kJ m−2] | Sabs [kJ] | Ti [°C] | Tf [°C] | cp [kJ (kg °C)−1] | ρ [kg m−3] | ṁ [kg s−1] | Qpp [kJ] | Qabs [kJ] | Qnet [kJ] | ηth (%) |
|---|---|---|---|---|---|---|---|---|---|---|---|
| a Refer to the footnotes of Table 2.b Transparent colour means pure water. | |||||||||||
| Transparentb | 6523.09 | 1061.63 | 10.1 | 18.9 | 4.190 | 999.1 | 0.03546 | 485.40 | 670.70 | 185.30 | 17.5 |
| Red | 6177.27 | 1005.35 | 11.5 | 23.9 | 4.187 | 998.5 | 0.03546 | 736.23 | 944.36 | 208.12 | 20.7 |
| Violet | 6292.02 | 1024.03 | 11.5 | 24.1 | 4.187 | 998.5 | 0.03546 | 652.05 | 959.59 | 307.54 | 30.0 |
| Black | 4010.91 | 652.77 | 11.8 | 22.3 | 4.187 | 998.6 | 0.03546 | 682.88 | 944.50 | 261.61 | 40.1 |
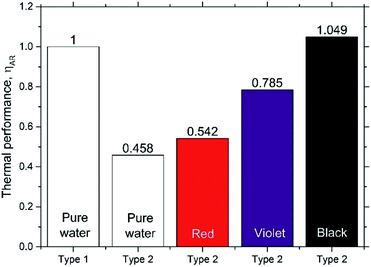
Fig. 10 shows the thermal efficiencies ηth calculated from eqn (8) and Fig. 11 shows the thermal performance ηAR evaluated from eqn (10), including a comparison of the Type 1 FPC containing pure water with the Type 2 FPC containing coloured water including pure water.
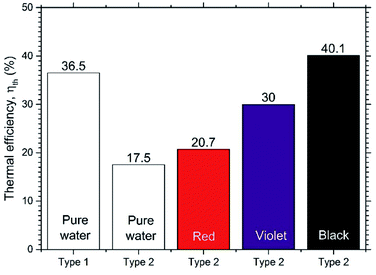 | ||
| Fig. 10 Comparison of the thermal efficiencies of Type 1 and Type 2 FPCs. The pure water of Type 2 FPC is transparent. | ||
In Fig. 11, ηAR of the Type 1 FPC with pure water is set to 1.0 and will be used as a reference for the comparison of the two FPCs. From the tube dimensions of Table 1, AR of the Type 1 FPC is about 0.0738 and AR of the Type 2 FPC is about 0.0773. Although the tube length of Type 2 is shorter than that of Type 1, AR of Type 2 is larger than AR of Type 1 because the OD of Type 2 is thicker than the OD of Type 1. The AR ratio of Type 1 to Type 2 is about 0.955.
In Fig. 11, it is shown that the thermal efficiency of the Type 2 FPC operated with pure water was about half compared to the Type 1 FPC. This low thermal efficiency of 45.8% may have to do with the transmission of visible light. Since the Type 2 FPC was made with a transparent polyurethane tube installed on the absorbing copper plate painted black, the pure water passing through the tube also looks transparent. Considering that most visible light will pass through the pure water in the tube, the solar energy incident to the FPC will be accumulated on the absorbing plate. Then, the heat energy stored on the absorbing plate will be transferred to the pure water through the tube wall, which will result in low thermal efficiency.
In contrast, when the black coloured water was used in the Type 2 FPC, visible light was absorbed by both the water and the absorbing plate and, as a result, the thermal efficiency of the Type 2 FPC was increased.
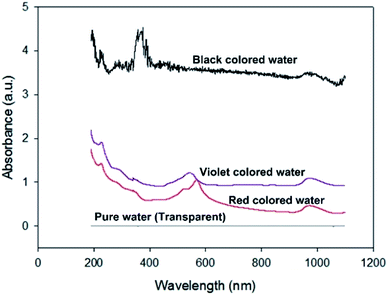
Fig. 12 shows the absorbances of the coloured water samples measured by UV-VIS spectrophotometry (200–1100 nm). Since the absorbance values were referred to that of pure water, the absorbances of the coloured water samples are the relative values to pure water. As expected, the black coloured water strongly absorbs all bands of visible light, which causes the high thermal efficiency of the Type 2 FPC with black water. Meanwhile, the thermal efficiency of the violet water is higher than the red water because violet objects absorb the visible light band more efficiently than red objects.
Conclusion
This experimental study was performed to suggest a completely new innovative FPC, which utilizes the capacity of direct sunlight absorption by a coloured working fluid passing through a transparent tube installed on the absorbing plate.In the conventional FPCs, the metallic heating tubes are usually placed under the absorbing plate made of copper, and the heat energy is transferred from the absorbing plate to the metallic heating tube. However, in this study, the heating tube is transparent and placed on the absorbing plate to utilize the direct sunlight absorption by coloured water. To investigate the absorption capacity of solar energy depending on the colour of water, sunlight exposure tests were performed with double glass containers, as shown in Fig. 3, prior to the FPC performance test. As seen in Fig. 4, the black coloured water showed the highest temperature rise. In the sunlight exposure test, it was a very interesting finding that the white coloured water and the clear water showed nearly the same temperature rise. Possibly, this implies that the almost total reflection of visible light by the white coloured water is physically equivalent to the almost total passing of visible light through the clear water.
To benchmark the FPC newly suggested in this study (Type 2 FPC), the usual type of FPC (Type 1 FPC) was separately prepared, which is similar to the conventional FPC except for the one-pass configuration. However, the heating tubes of the Type 2 FPC are transparent and attached on the absorbing plate. Therefore, the solar energy is wholly absorbed by the absorbing plate in the Type 1 FPC while it is directly absorbed by the coloured water passing through the transparent tubes in the Type 2 FPC.
Since the tube materials used in the two FPCs are different, the tube lengths installed on the absorbing plates of the same area are also different due to differences in the minimum allowable radius of curvature of the material types. To evaluate the thermal performances of the two FPCs on the same basis, the area ratio given by eqn (10) was newly introduced, which is the ratio of the absorbing plate area to the surface area of the tube installed on the absorbing plate. This concept of the area ratio will be highly useful when comparing the thermal efficiencies of FPCs with different sizes and types.
In this study, a small centrifugal pump was used to circulate the working fluid. The pump power is eventually dissipated into the water in the form of heat energy, but most studies on FPCs with a circulating pump have not considered the temperature rise of the working fluid caused by the pump power input. Although it was unfortunately difficult to determine the exact quantitative contribution to the water temperature rise from the pump power, due to the accuracy of the thermocouples used in this study, it is definite that the pump power contributes to the increase in the temperature in a closed loop circulating system as seen in Tables 1 and 2. From the experimental results, it was confirmed that the thermal performance of the Type 2 FPC is higher than that of the Type 1 FPC. The thermal performance of the Type 2 FPC is only about 5% higher than that of the Type 1 FPC, which may seem small. However, compared with a metal tube, it should be noted that the transparent polyurethane tube used in this study is very cheap, easy to bend, and simple to install on the absorbing plate.
The experimental apparatus of this study was made by obtaining the necessary materials from nearby hardware stores at a cost of less than US$ 200 except for the electronic instrumentation. Since the whole experimental apparatus was constructed from scratch in just one week by the students who participated in this study, the newly suggested FPC can be easily constructed even if the FPC size is increased and even by an unskilled person. Therefore, the authors are convinced that the results of this study will greatly contribute to the improvement of the living environment of people in undeveloped countries. Additionally, the authors strongly hope that this study will stimulate other researchers' motivation to study the development of new types of FPCs.
Author contributions
The corresponding author S.-H. Choi first suggested the research idea and planned the experimental method and schedule including the final preparation of this manuscript. Additionally, he fully supervised the whole experiment and checked all experimental results. The co-first author Prof. H. M. Jeong not only fully supported this experiment by supplying all his available research resources, but also provided his professional knowledge and experience on the UV-VIS experiment including his advice on the experimental results. The first author S. D. Kim led all experiments and prepared the first draft of this manuscript. He periodically reported the experimental results and contributed to the progress reports of the research meetings. The co-authors J. Y. Park, S. Y. Baek and A. J. Lee participated in fabricating the experimental apparatus and in all experiments. They also contributed to the data collection and summary including the draft manuscript preparation.Conflicts of interest
This manuscript has not been published or presented elsewhere in part or in entirety and is not under consideration by another journal. We have read and understood your journal's policies, and we believe that neither the manuscript nor the study violates any of these. There are no conflicts of interest to declare.Acknowledgements
This research was supported by Basic Science Research Program through the National Research Foundation of Korea (NRF) funded by the Ministry of Science, ICT and future Planning (No. 2017R1A2B4007620).References
- T. R. Karl and K. E. Trenberth, Science, 2003, 302(5651), 1719–1723 CrossRef CAS PubMed.
- T. L. Root, J. T. Price, K. R. Hall, S. H. Schneider, C. Rosenzweig and J. A. Pounds, Nature, 2003, 421, 57–60 CrossRef CAS PubMed.
- C. D. Thomas, A. Cameron, R. E. Green, M. Bakkenes, L. J. Beaumont, Y. C. Collingham, B. F. N. Erasmus, M. F. d. Siqueira, A. Grainger, H. Lee, L. Hughes, B. Huntley, A. S. van Jaarsveld, G. F. Midgley, L. Miles, M. A. Ortega-Huerta, A. Townsend Peterson, O. L. Phillips and S. E. Williams, Nature, 2004, 427, 145–148 CrossRef CAS PubMed.
- J. H. Mercer, Nature, 1978, 271, 321–325 CrossRef.
- A. Kasman and Y. S. Duman, Econ. Model., 2015, 44, 97–103 CrossRef.
- T. J. Battin, S. Luyssaert, L. A. Kaplan, A. K. Aufdenkampe, A. Richter and L. J. Tranvik, Nat. Geosci., 2009, 2, 598–600 CrossRef CAS.
- J. F. B. Mitchell, Rev. Geophys., 1989, 27, 115–139 CrossRef.
- A. F. Bouwman, Soils and the greenhouse effect, John Wiley & Sons, New York, USA, 1990 Search PubMed.
- R. U. Ayres and J. Walter, Environ. Resour. Econ., 1991, 1(3), 237–270 CrossRef.
- S. N. Habisreutinger, L. Schmidt-Mende and J. K. Stolarczyk, Angew. Chem., Int. Ed., 2013, 52(29), 7372–7408 CrossRef CAS PubMed.
- M. Gattrell, N. Gupta and A. Co, J. Electroanal. Chem., 2006, 594(1), 1–19 CrossRef CAS.
- W. Zhu, R. Michalsky, Ö. Metin, H. Lv, S. Guo, C. J. Wright, X. Sun, A. A. Peterson and S. Sun, J. Am. Chem. Soc., 2013, 135(45), 16833–16836 CrossRef CAS PubMed.
- I. Lillo, P. Elena, S. Moreno and M. Silva, Energies, 2017, 10(3), 1–22 CrossRef.
- D. Mills, Sol. Energy, 2004, 76, 19–31 CrossRef.
- O. Behar, K. Abdallah and K. Mohammedi, Renewable Sustainable Energy Rev., 2013, 23, 12–39 CrossRef.
- A. Syed, M. Izquierdo, P. Rodríguez, G. Maidment, J. Missenden, A. Lecuona and R. Tozer, Int. J. Refrig., 2005, 28, 859–871 CrossRef CAS.
- I. Atmaca and A. Yigit, Renewable Energy, 2003, 28, 1277–1293 CrossRef CAS.
- K. R. Ullah, R. Saidur, H. W. Ping, R. K. Akikur and N. H. Shuvo, Renewable Sustainable Energy Rev., 2013, 24, 499–513 CrossRef CAS.
- M. A. Sabiha, R. Saidur, S. Mekhilef and O. Mahian, Renewable Sustainable Energy Rev., 2015, 51, 1038–1054 CrossRef.
- S. A. Kalogirou, Prog. Energy Combust. Sci., 2004, 30, 231–295 CrossRef CAS.
- S.-H. Choi, Energy, 2017, 141, 1332–1349 CrossRef.
- K. Omar, M. Merzouk, N. K. Merzouk and S. El Metenan, Energy Procedia, 2015, 74, 130–138 CrossRef.
- S. Fabio, Heat and Mass Transport, Project Report, 2008, p. MVK160 Search PubMed.
- H. Kayali and H. Alibaba, Sustainability in Environment, 2017, 2(1), 36–66 CrossRef.
- J. K. Thorne, G. L. Province, and C. W. Siltanen, US Pat. no. 4023557, U.S. Patent and Trademark Office, Washington DC, 1977.
- C. D. MacCracken, US Pat. no. 4,112,921, U.S. Patent and Trademark Office, Washington, DC, 1978.
- A. H. Alami and K. Aokal, Energy Convers. Manage., 2018, 156, 757–764 CrossRef CAS.
- Y. Tripanagnostopoulos, M. Souliotis and T. H. Nousia, Sol. Energy, 2000, 68(4), 343–356 CrossRef.
- A. Springer, P. Kallage, M. Hustedt, S. Barcikowski, V. Wesling and H. Haferkamp, J. Laser Appl., 2012, 24(5), 052002 CrossRef.
- L. A. Spyrou and N. Aravas, J. Manuf. Sci. Eng., 2015, 137(1), 011016 CrossRef.
- L. Tsang, J. A. Kong and K. H. Ding, Scattering of electromagnetic waves: theories and applications, John Wiley & Sons, New York, USA, 2004 Search PubMed.
- J. A. Kong, Theory of electromagnetic waves, Wiley-Interscience, New York, 1975 Search PubMed.
- C. D. Wickens, J. Lee, Y. Uu and S. G. Becker, An Introduction to Human Factors Engineering, Pearson Prentice Hall, New Jersey, USA, 2004, ch. 1 Search PubMed.
- M. D. Fairchild, Color Appearance Models, John Wiley & Sons, New York, USA, 2005 Search PubMed.
- G. Colangelo, E. Favale, A. De Risi and D. Laforgia, Appl. Energy, 2013, 111, 80–93 CrossRef CAS.
- F. Assilzadeh, S. A. Kalogirou, Y. Ali and K. Sopian, Renewable Energy, 2005, 30(8), 1143–1159 CrossRef CAS.
- E. Azad, Exp. Therm. Fluid Sci., 2008, 32(8), 1666–1672 CrossRef CAS.
- T. Yousefi, F. Veisy, E. Shojaeizadeh and S. Zinadini, Exp. Therm. Fluid Sci., 2012, 39, 207–212 CrossRef CAS.
- A. Georgiev, Energy Convers. Manage., 2005, 46(9–10), 1423–1442 CrossRef.
- T. Yousefi, F. Veysi, E. Shojaeizadeh and S. Zinadini, Renewable Energy, 2012, 39(1), 293–298 CrossRef CAS.
- D. J. Mullan, Physics of the Sun, CRC press, New York, USA, 2009 Search PubMed.
- R. Vasquez Padilla, A. Fontalvo, G. Demirkaya, A. Martinez and A. Gonzalez Quiroga, Appl. Therm. Eng., 2014, 67, 1–8 CrossRef.
- R. Eisberg and R. Resnick, Quantum Physics of Atoms, Molecules, Solids, Nuclei, and Particles, John Wiley & Sons, New York, USA, 1985 Search PubMed.
- K. Ourabah and M. Tribeche, Phys. Rev. E: Stat., Nonlinear, Soft Matter Phys., 2014, 89, 062130 CrossRef PubMed.
- D. R. Myers and K. E. Emery, Terrestrial Solar Spectral Modeling Tools and Applications for Photovoltaic Devices (NREL/CP-520-31407), National Renewable Energy Laboratory, Colorado, USA, 2002 Search PubMed.
- ASTM Subcommittee G03.09, ASTM G173-03, 2003.
- O. Zhernovaya, O. Sydoruk, V. Tuchin and A. Douplik, Phys. Med. Biol., 2011, 56, 4013–4021 CrossRef CAS PubMed.
- Y. Lu, Y. Lin, D. Wang, L. Wang, T. Xie and T. Jiang, Nano Res., 2011, 4(11), 1144–1152 CrossRef CAS.
- D. Brune, R. Hellborg, B. R. R. persson and R. Pääkkönen, Radiation at home, outdoors and in the workplace, Scandinavian Science Publishers, Oslo, Sweden, 2001 Search PubMed.
- A. Shariah, M. A. Al-Akhras and I. A. Al-Omari, Renewable Energy, 2002, 26(4), 587–598 CrossRef.
- R. Tang, Y. Yang and W. Gao, Sol. Energy, 2011, 85(7), 1381–1389 CrossRef CAS.
- Y. A. Çengel and J. M. Cimbala, Fluid Mechanics: Fundamentals and Application, MacGrow Hill, Newyork, 2018 Search PubMed.
- Y. Deng, Y. Zhao, Z. Quan and T. Zhu, Energy Procedia, 2015, 70, 41–48 CrossRef.
- H. Chen, J. Huang, H. Zhang, K. Liang, H. Liu and S. Liang, Appl. Therm. Eng., 2019, 166, 83–95 Search PubMed.
- Y. S. Kim, D. H. Han, H. Chung, H. Jeong and S.-H. Choi, Energy Build., 2017, 139, 232–241 CrossRef.
- D.-H. Han, S. Kim, J. H. Choi, Y. S. Kim, H. S. Chung, H. Jeong, N. Watjanatepin, C. Ruangpattanawiwat and S.-H. Choi, Energy Build., 2018, 177, 1–11 CrossRef.
- Y. S. Kim, H. Chung, H. Jeong, S.-K. Song, C. Yi and S.-H. Choi, Int. J. Air-Cond. Refrig., 2016, 24(3), 1650016 CrossRef.
Footnote |
| † Electronic supplementary information (ESI) available. See DOI: 10.1039/c9ra03442k |
| This journal is © The Royal Society of Chemistry 2019 |

