 Open Access Article
Vanadium doped few-layer ultrathin MoS2 nanosheets on reduced graphene oxide for high-performance hydrogen evolution reaction†
Ashwani Kumar Singh‡
 *ab,
Jagdees Prasad‡b,
Uday Pratap Azadc,
Ashish Kumar Singh
 c,
Rajiv Prakashc,
Kedar Singh*b,
Amit Srivastavad,
Andrei A. Alaferdova and
Stanislav A. Moshkaleva
aCenter for Semiconductor and Nanotechnology Components, UNICAMP, SP, Brazil. E-mail: ashwanikumarsingh143@gmail.com
bSchool of Physical Sciences, Jawaharlal Nehru University, New Delhi, India
cSchool of Material Science and Technology IIT BHU, Varanasi, India
dDepartment of Physics, TD PG College, VBS Purvanchal University, Jaunpur, India
First published on 17th July 2019
Abstract
In this paper, we demonstrate a facile solvothermal synthesis of a vanadium(V) doped MoS2-rGO nanocomposites for highly efficient electrochemical hydrogen evolution reaction (HER) at room temperature. The surface morphology, crystallinity and elemental composition of the as-synthesized material have been thoroughly analyzed. Its fascinating morphology propelled us to investigate the electrochemical performance towards the HER. The results show that it exhibits excellent catalytic activity with a low onset potential of 153 mV versus reversible hydrogen electrode (RHE), a small Tafel slope of 71 mV dec−1, and good stability over 1000 cycles under acidic conditions. The polarization curve after the 1000th cycle suggests there has been a decrement of less than 5% in current density with a minor change in onset potential. The synergistic effects of V-doping at S site in MoS2 NSs leading to multiple active sites and effective electron transport route provided by the conductive rGO contribute to the high activity for the hydrogen evolution reaction. The development of a high-performance catalyst may encourage the effective application of the as-synthesized V-doped MoS2-rGO as a promising electrocatalyst for hydrogen production.
Introduction
The ever rising energy crisis on a global scale with increasing environmental concerns has compelled the scientific community to pursue the paradigm of new and renewable energy sources. Rapidly depleting fossil fuel is a further concern, as a source of energy for the next generation which creates a necessity to develop clean energy technology. Great efforts and progresses have been made to produce electrical power from new unconventional and renewable sources, such as solar, wind, and biomass, in the past few decades.1–3 Hydrogen offers itself as a promising renewable energy source due to its high energy density and zero emission of greenhouse gases, among other available fuels.4–6 Nevertheless, industrial hydrogen is produced by a process called the steam reforming technique which further involves the use of fossil fuel and results in the production of greenhouse gasses. Therefore, considering the gradual increase in the average temperature of the planet, there is a growing need to develop clean and cost effective methods for hydrogen production. However, some serious concerns related to production and storage7–12 hinder the practical application of hydrogen as fuel.Among various other strategies available for hydrogen production namely chlor-alkali electrolysers,13 proton exchange membrane (PEM) electrolysers and solar water splitting devices,14 splitting water molecule using electricity has emerged as an optimistic approach due to its high energy conservation efficiency and low cost. This evolution of hydrogen requires a catalyst enable to produce high current density at very low overpotential and platinum is found to be one of the most suitable catalyst to serve the purpose in acidic medium.15–17 However, its application as a catalyst is limited due to its high cost as well as low abundance. A number of catalysts like metals, metal oxides, and carbides have also been studied for this purpose.18–21 Among these catalysts, in recent years, nanostructured molybdenum disulphide attracted considerable attention due to its inherent properties. Nanostructured MoS2 produces hydrogen at very low overpotential with high current density. This enhanced hydrogen evolution vests in the reason that ionised hydrogen co-ordinates with sulphur edge sites, while its basal planes remain catalytically inert.22–24 One other prominent factor governing the rate of hydrogen evolution is the fact that the basal plane of 2D MoS2 exhibits semiconducting nature, causes low conductivity for electron. It further results in poor electron transport and lowering hydrogen production. Therefore, higher hydrogen evolution can be achieved by exposing more number of active S atom sites as well as improving the conductivity of MoS2 nanosheets. The former can be achieved by doping a suitable atom in MoS2 crystal or producing more defect rich MoS2 sheets, while later can be addressed by supporting 2D MoS2 semiconducting crystal through a proper conducting material. Various materials including metals, carbon allotropes, and carbonitride compounds have been used to improve the conductivity of MoS2 by promoting electron transfer for enhanced hydrogen evolution. Mesoporous carbon nanospheres have been used for selective growth of dispersed nanostructured MoS2.25 Many other groups reported reduced graphene oxide as a support for MoS2 nanostructures to enhance hydrogen evolution.26,27 Graphene has shown remarkable properties in various field of advanced technology since its discovery.28 The attribute of graphene both as the source and sink for electrons has been well established and therefore can improve the interfacial charge transfer.29 Further, graphene provides an excellent conducting path for generated electrons in the process of hydrogen evolution. Due to the aforementioned properties, graphene comes out to be a transpire candidate for the support of nanostructured MoS2, among various other materials.
In this paper, we report a simple and facile solvothermal method for the synthesis of vanadium doped MoS2 nanosheets on the surface of reduced graphene oxide. We have used both the strategies (enhanced active sites as well as conducting support) for enhancing hydrogen evolution. It is believed that doping of vanadium in MoS2 nanosheets may increase the interplaner distance (d spacing) which enables us to explore more active sites for hydrogen evolution.
Results and discussion
Characterization
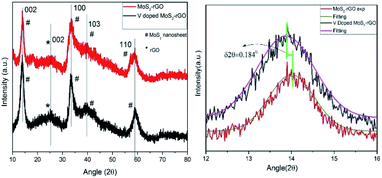
XRD patterns of as-synthesized MoS2-rGO and 10% V doped MoS2-rGO) hybrid are being displayed in Fig. 1. XRD profile matches well with hexagonal 2H MoS2 crystal structure, inferring the phase as well as (hkl) reflections in term of d-values of the materials.These patterns manifest the hybrid nature of synthesized materials as can be seen due to the presence of individual peak for both MoS2 nanosheets and rGO. Furthermore, the peak at ∼14.1° corresponds to (002) set of planes in both the samples with d spacing 0.61 and 0.64 nm, respectively. Compared to bulk MoS2 (ESI Fig. S1†), the intensity of (002) reflection plane is too low to compare, indicating the lowering crystallinity of MoS2-rGO hybrid. The perpetuated growth of (002) plane confirms the formation of a few layered MoS2 in the hybrid structure. However, a small peak at 18.6° (dhkl = 4.75 Å) disappears after the 10% doping of vanadium (in the lower spectrum). This disappeared peak can be attributed to a slight distortion in the lattice of MoS2.30 It is very important to note here that the basal plane plays a crucial role in HER and except for (002) plane, all other peaks at 2θ = 33.4°, 39.7°, and 58.9° have their origin from (100), (113), (113) basal planes, respectively, for MoS2 present in hybrid. Some of these peaks are dominantly asymmetric in nature stipulating a partial turbostratic disorder.31 It can further be discernible that diffraction peaks from higher orders ((104), (105), (106), (008) etc.) are absent in the spectrum due to lowering in crystallinity and short range disorder in the samples which further provides more active sites for HER. Peak centred at 2θ = 25.1° can be accredited to (002) reflection of rGO,32 and in consistent with an interlayer spacing of 0.34 nm.
Right panel of Fig. 1 depicts the Gaussian fitting of 002 peak (2θ = 14.1°) of doped and undoped MoS2-rGO hybrid. A careful observation of this fitting shows a shift in diffraction maxima of V doped MoS2-rGO towards lower angle side. This lowering of angle around 0.184°, is akin to an increasing shift in the interplaner separation of 0.13 Å. Increase in interplaner spacing is due to vanadium doping as vanadium atom has larger size than that of sulphur atom. This widening in spacing further offers more active sites for HER. Le-bail profile fitting has been performed on all the samples which demonstrates an expansion in the unit cell with V-doping (ESI Fig. S4, S5, S6 and Table S1†).
The resultant MoS2-rGO and V-doped MoS2-rGO hybrid were further investigated using SEM and TEM to understand the morphology and details of microstructures. As shown in Fig. S3(a–f),† the MoS2-rGO displays a flower-like morphology, which consists of interlaced MoS2 sheets. In the SEM images of 10% V-doped MoS2-rGO also, flower like morphology in which curled MoS2 sheets anchored on the graphene sheets has been observed. These curled MoS2 sheets lead to rich exposed active sites of MoS2 for HER. However, as a p-type semiconductor, MoS2 exhibits low conductivity between adjacent S–Mo–S layers, leading to poor charge transfer.19 In addition, the van der Waals interactions between adjacent MoS2 layers inevitably result in the aggregation phenomenon, which decreases the number of active sites as well as the overall electrocatalytic activity.20 However, doping of V led to change in morphology as well as an increase in the interlayer spacing, results in enhanced catalytic activity. Elemental mapping of various elements has also been shown in Fig. S3(g–j)† along with EDX spectra S3 (k).
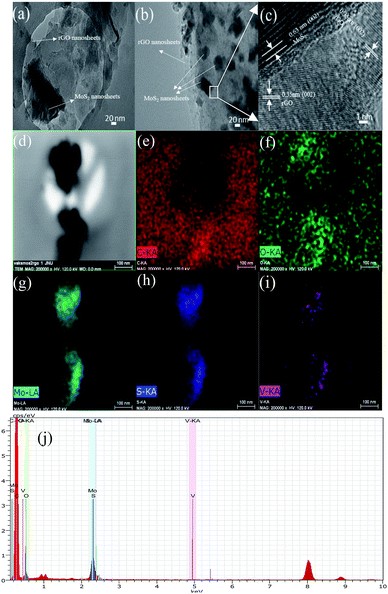
Fig. 2(a) is a representative TEM micrograph of MoS2-rGO on a carbon-coated copper holey grid. The large flat surface of rGO can clearly be seen as marked with an arrow over which MoS2 nanosheets with dark contrast are lying. After doping (Fig. 2(b)), MoS2-rGO hybrid holds its basic morphology with smaller flake sizes of MoS2 nanosheets (NSs). This micrograph shows well dispersed large number of MoS2 NSs over the surface of rGO.
A small section of hybrid (marked in box) was selected for high resolution (HR) imaging as shown in Fig. 2(c). This HR image shows two different patterns of lattice fringes mainly due to rGO and MoS2 NSs. These different spacings attribute to better performance of doped catalyst than the pure MoS2-rGO.
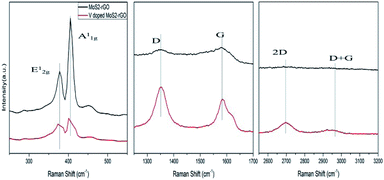
Fig. 3 represents three different regions of Raman spectra for MoS2-rGO and V doped MoS2-rGO hybrid. In these spectra, MoS2 exhibits two characteristic peaks at 377 cm−1 and 405 cm−1, labelled as E12g (in the plane) and A1g (out of the plane, along c axis) modes of vibrations of S atoms.33 As is known from previous studies, the separation between these modes fairly estimates the layer thickness and stacking of material.33 Narrow separation of these two peaks (28 cm−1) reveals the formation of few (5–7) layers of MoS2-rGO hybrid.
However, the separation of E12g and A1g mode of vibrations is further reduced (2 cm−1) with doping of vanadium, suggesting flakes to be multi-layered with decreased number.4,5 Further, there is a shift in wave number for both peaks towards the lower side as well as lowering in intensity, after doping. This lowering intensity is caused by the change in lattice symmetry which further affects the matric elements along with selection rules for Raman active vibrational modes.34 Meanwhile, the shift in wavenumber is the consequence of the interaction between S and V atoms which lowers the Mo–S vibration.35 The intensity of A1g mode is higher than that of E12g mode, indicating that V doped MoS2-rGO hybrid has decreased the number of layers and terminated structure.35 The stacked phonons scattered from rGO generate two main bands namely D-band (∼1352 cm−1) and G-band (∼1581 cm−1). D-band at 1352 cm−1 has its origin from in-plane vibration of hexagonal graphitic layers and arises from disordered band edge structure of k-point phonons of A1g symmetry of C atoms,36 whereas, G-band attributes to E2g mode of sp2 hybridization of C atoms. A1g (D-band) is usually absent from pure graphene due to the perfect graphene symmetry (no distortion).
The ratio of intensities of D and G band (ID/IG) fairly assess the quality of rGO crystal. In our V doped MoS2-rGO sample, ID/IG ratio changes significantly (from 0.99 to 1.2) compared to undoped MoS2-rGO. It infers the increased number of defects sites leading to the opening of some more active sites for enhanced HER.
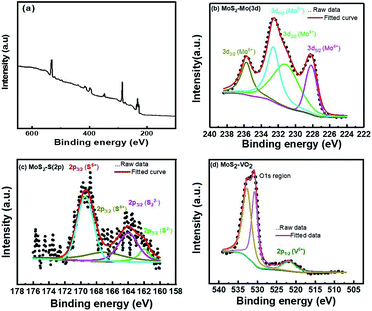
High resolution X-ray photoelectron spectroscopy (XPS) has been evidenced to gain further insights into chemical character and bonding states of vanadium doped catalysts. Fig. 4 represents the full survey scan of the as-synthesized sample. Fig. 4(b) shows the core levels binding energy spectra of Mo 3d. The doublet peak of Mo 3d at 228.2 eV and 231.3 eV attribute to Mo 3d5/2 and 3d3/2 states, respectively. It primarily owes to Mo4+ oxidation states, and be in accordance with the XPS data in the prior reported studies.37–39 The presence of an additional single peak at ∼234.17 eV corresponds to the oxidation state Mo6+. Moreover, deconvoluted peaks at 161.9 eV (2p3/2), 163.8 eV (2p3/2) and 169.1 eV (2p3/2) correspond to S2−, S22− and S6+, respectively whereas an additional peak at 166.1 eV corresponds to S4+ as depicted in Fig. 4(c), Ahmed et al.40,41 reported this additional peak is due to vanadium doped MoS2 composite formation. Fig. 4(d) displays the high resolution core-level XPS spectra of as synthesized MoS2-VO2, the peaks at 532.8 and 530.7 eV ascribe to O 1s peak, which is due to the pre hydroxyl group and formation of hydrogenated VO2 in an acidic environment.42,43 It also exhibits a peak at 521.8 eV which may be ascribed to the V5+ (2p1/2).44
Electrochemical study
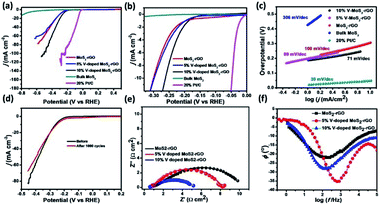
Electrochemical measurements have been performed using catalytically modified glassy carbon electrode as working electrode, Pt disc electrode as counter electrode and Ag/AgCl electrode as reference electrode in 0.5 M H2SO4 medium45,46 Linear Sweep Voltammetry (LSV) of MoS2-rGO, 5% V-doped MoS2-rGO, 10% V-doped MoS2-rGO, bulk MoS2 and 20% Pt/C have been shown in Fig. 5(a and b). It has been observed that an increase in 5% doping of V in MoS2-rGO leads to a slight increase in current density and a slight decrement in onset potential. However, 10% doping of V in MoS2-rGO leads to better catalytic performance (high current density and lower onset potentials as clear from Fig. 5, Table 1). However, remarkably higher current density has been observed for both undoped and doped samples than the bulk MoS2. Increased HER performance of MoS2 in combination with rGO could possibly due to the effect of nanosize as well as the synergistic effect of MoS2 and rGO sheets. rGO serves as conducting support for the transport of electrons, whereas V-doping leads to enhanced active sites for hydrogen evolution reaction. Further, the catalytic activity has also been analysed by Tafel slope measurement. From the Tafel slope, it is clear that the reaction follows the Volmer–Heyrovsky mechanism.47 As shown in Fig. 5(c), the linear regions fits well with the Tafel equation (η = b log j + a, where b defines Tafel slope and j represents the current density). In aqueous acidic medium, there may be two possible reaction steps, one primarily the discharge reaction followed by combination with another H atom and second leading to the desorption of hydrogen gas molecules.| Sample name | Onset potential (mV) | η10 (mV) | η20 (mV) | Tafel slope (mV dec−1) | TOF (10−5 s−1 at η = 300 mV) | Rct (Ω cm2) |
|---|---|---|---|---|---|---|
| MoS2-rGO | 197 | −0.301 | −0.350 | 100 | 372 | 10.061 |
| 5% V-doped MoS2 | 168 | −0.297 | −0.355 | 89 | 564 | 8.012 |
| 10% V-doped MoS2 | 153 | −0.262 | −0.301 | 71 | 747 | 3.384 |
| Bulk MoS2 | 349 | −0.766 | — | 306 | 8.92 | — |
| 20% Pt/C | 17 | −0.047 | −0.064 | 30 | — | — |
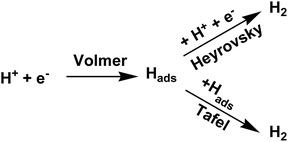
Generally, a fast discharge reaction (Fig. 6) followed by a rate-limiting combination reaction (eqn (2) in ESI†) leads to a Tafel slope of ∼30 mV dec−1. When it (Step 1, Fig. 6) is fast and followed by a slow electrochemical desorption reaction (Step 3), a Tafel slope has a value ∼40 mV dec−1. If eqn (2)† is rate-limiting or the surface coverage is close to one, the Tafel slope has ∼120 mV dec−1. Tafel slope obtained from Fig. 5(c) have the values 71, 89 and 100 mV dec−1, thereby suggests the desorption to be a rate-limiting step. This indicates that the reaction eqon (2)† is rate-limiting step.14 Moreover, if we look at doped as well as undoped samples, HER performance of doped catalysts are found to be better than that with undoped catalyst. As reported earlier, the better catalytic performance of MoS2-rGO sample compared to bulk MoS2 is due to the synergistic effect of MoS2 sheet and rGO. Tafel slopes, onset potential and other electrochemical parameters of the prepared samples have been summarized in Table 1. In the present study, among all the catalysts, 10% V-doped MoS2-rGO HPOM-rGO annealed exhibits the lowest onset potential of 153 mV and Tafel slope as 71 mV dec−1, hence it shows the best activity.14,24 Further, electrochemical stability of 10% V-doped MoS2-rGO (the best found catalyst, as referred) has been investigated through continuous cycling it up to 1000 cycles from 0 to −0.4 V vs. Reversible Hydrogen Electrode (RHE). As shown in Fig. 5(d) from the polarization curve after the 1000th cycle, there has been a decrement of less than 5% in current density with a minor change in onset potential. This demonstrates the high electrochemical stability of the incumbent HER catalyst.
In order to deal with the kinetics of HER and catalytic behavior of the prepared catalysts, Electrochemical Impedance Spectroscopy (EIS) measurements in 0.5 M H2SO4 has been done. Fig. 5(e) illustrates the impedance plots with the proposed equivalent electrical circuit at a constant potential (η = 300 mV). Table 2 summarizes the parameters deduced through the analysis of the Nyquist diagram. Here, Rs is basically a series of resistance which consists of contact resistance and electrolyte resistance. The table shows that Rct (the charge transfer resistance associated with the HER process) follows the inverse order of catalytic activity. Hence, 10% of V-doped MoS2-rGO has the least Rct among all the catalysts.
| Rs | Rct | Q | R | Q | |||
|---|---|---|---|---|---|---|---|
| Yo | n | Yo | n | ||||
| MoS2-rGO | 0.7147 | 10.061 | 0.0001818 | 0.8 | 2.521 | 0.002265 | 0.8 |
| 5% V-doped MoS2-rGO | 0.01 | 8.012 | 0.0007914 | 0.47 | 1.159 | 0.0006383 | 0.77 |
| 10% V-doped MoS2-rGO | 0.5285 | 3.384 | 0.03302 | 0.43 | 1.314 | 0.01417 | 0.62 |
In order to understand the role of vanadium in the improvement of catalytic performance for HER reaction, we have carried out an extensive literature survey on properties of doped MoS2 as well as on theoretical study on the mechanism of HER over MoS2 sheets. Recent studies on vanadium-based composites and related DFT calculations have inferred that intralayer vanadium doping in a MoS2 system introduces defect states with small energy differences which makes it easy for the valence electrons to be activated to the defect states, just like in the case of a semimetal.47–49 Moreover, the introduction of vanadium in host material enhances the planar conductivity leading to its higher carrier concentration.
Ahmed and coworker studied the effect of V doping on inducing high coercivity in hydrothermally synthesized MoS2 and V doped MoS2 nanosheets.40 It indicates that V doping promotes the activity for the formation of MoS2. Studies by other analytical methods suggest a cumulative effect of localized charge transfer between V and S ions, pinning effect due to the in-between defects, stress induced by doping, and shape anisotropy due to two-dimensional nature of MoS2 ribbons result in ferromagnetism with 5% vanadium doping. This cumulative effect might be responsible for the better catalytic performance of V-doped MoS2 in our case also, as charge transfer between V and S ions and production of defects in MoS2 nanosheets provide extra sites for the catalytic reaction.
Recent studies have explored the 1T phase of transition-metal dichalcogenides (TMDs) to display excellent catalytic activity for hydrogen evolution reaction (HER), and catalytic mechanism. Jiang and co-workers47 have used 1T MoS2 as prototypical TMD material and studied it's HER activity on the basal plane of MoS2 from periodic density functional theory (DFT) calculations (Fig. 7). The catalytic activity of the basal plane of 1T phase MoS2 arises mainly due to its affinity for binding H at the surface S sites. They considered binding free energy (ΔGH) of H as the descriptor and found that the optimum evolution of H2 takes place at surface H with coverage of 12.5% to 25%. The reaction energy and barrier for the three elementary steps of the HER process have been examined within the considered coverage. It has been reported that Volmer steps to be facile, whereas the subsequent Heyrovsky reaction to be kinetically more favorable than the Tafel reaction and considering all these findings a mechanism has been proposed as shown in Fig. 6. It suggests that at a low overpotential, HER can take place readily on the basal plane of 1T MoS2 via the Volmer–Heyrovsky mechanism. They further studied dopants such as Mn, Cr, Cu, Ni, and Fe and clearly reported metals as a substitutional dopant for Mo to possess better HER activity.
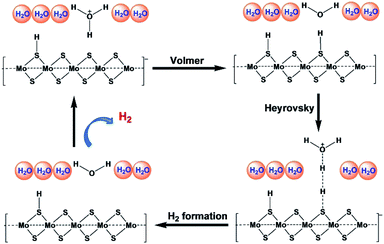 | ||
| Fig. 7 Proposed reaction mechanism for HER by Jiang and coworkers. (Redrawn with permission from ref. 47.) | ||
Another density functional theoretical study (Fig. 8) by Veisi and coworkers suggests that the pure graphene like (GL) 1H MoS2 is a non-magnetic semiconductor with a direct energy gap of 1.7 eV.49 The introduction of V atom to 1H MoS2 GL structure modifies its electronic behavior to half-metal having a magnetic moment of 0.789 μB. It also modifies its energy gap to 1.6 eV and 1.4 eV for up and down spins, respectively. This modification of semiconductor to half-metal might be considered as another reason for better catalytic behavior due to fast charge-transfer. The remarkable electrocatalytic performance can also be explained by the superior contact of the electrolyte with active sites on the heterostructure formed by the doping of vanadium as well as graphene.50,51
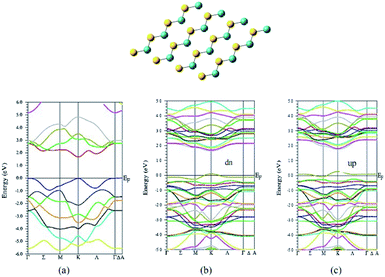 | ||
| Fig. 8 Structure of MoS2 and band structure for MoS2 and V-doped MoS2 by Veisi and coworker. (Reused with permission from ref. 49.) | ||
A detailed comparative study of some other catalysts for HER has been done in shown in Table S2.†52–58
Conclusions
Summarily, we present a scalable synthesis method for vanadium doped few layer ultrathin MoS2 nanosheets on reduced graphene oxide for high-performance hydrogen evolution reaction. Electrochemical studies of the as-synthesized materials show a better activity as well as durability, as a catalyst in comparison to other reported catalysts. Doping of vanadium basically increases the catalytic centres, which may be the most probable reason for this observation and findings. The best HER performance with an onset potential of 153 mV and minimum Tafel slope of 71 mV dec−1, has been found for 10% V-doped MoS2-rGO HPOM-rGO hence it exhibits the best activity among all the synthesized catalysts. It has the least Rct (charge transfer resistance associated with the HER process). The polarization curve after the 1000th cycle suggests, there has been a decrement of less than 5% in current density with a minor change in onset potential. This demonstrates the high electrochemical stability of the incumbent 10% V-doped MoS2-rGO hybrid HER catalyst.Experimental
Sodium molybdate dihydrate (Na2MoO4·2H2O), thiourea ((NH2)2CS), ethanol, and graphite powder (99.99%) were procured from Sigma Aldrich whereas vanadium(III) chloride (VCl3) was purchased from Alfa Aesar. All chemicals were of reagent grade and used as received without further purification. Aqueous solutions were prepared using high purity deionised (DI) water (Merck Millipore, USA).Synthesis of MoS2 nanosheets rGO nano hybrid
40 mg graphite oxide (GO) powder was dissolved in 60 ml DI water under continuous vigorous stirring for 1 h at room temperature to form a uniform and homogeneous solutions. 1.5 mmol (363 mg) Na2MoO4·2H2O and 7.5 mmol (571 mg) thiourea were added and stirred for 15 min. Next, the as-received homogeneous suspension was transferred in a Teflon lined stainless steel autoclave and held in a furnace at 200 °C for 24 h. Then, the autoclave was allowed to cool down to room temperature naturally and the precipitate was obtained. Further, the precipitate was washed several times with DI water and ethanol to remove residual ions and impurities. Finally, the obtained material was dried in a vacuum oven at 60 °C for overnight.Synthesis of vanadium doped MoS2nanosheets rGO nano hybrid
Vanadium(III) chloride (VCl3) (13 mg and 26 mg, for 5% and 10% doping, respectively) was dissolved in 60 ml DI water by ultrasonication for 30 min. 40 mg GO powder was added to the suspension and stirred for 1 h at room temperature. Further, 1.5 mmol (363 mg) Na2MoO4·2H2O and 7.5 mmol (571 mg) thiourea were added while stirring. After 15 min, the sample was transferred in a Teflon lined stainless steel autoclave held at 200 °C in a furnace for 24 h. A similar procedure was adopted for purification as discussed in the previous section. The as-obtained sample was collected for further characterization and studies.Characterizations
X-ray diffraction patterns were recorded on Rigaku MiniFlex table top X-ray diffractometer using CuKα radiation (λ = 1.54 Å) with a tube voltage and current at 45 kV and 35 mA, respectively and a step size of 0.02°. The insight of the microstructural and morphological features were studied by employing a scanning electron microscope (SEM) and a JEOL 2100 F transmission electron microscope, operated at an accelerating voltage of 200 kV. Samples for TEM measurements were prepared by ultrasonically suspending the powder in double distilled water and placing a drop of the suspension on a carbon-coated copper grid. The grids were further dried and used for transmission electron microscopy (TEM) analysis. Raman spectra were collected on a micro-Raman spectrometer (Wi-Tec alpha 300 R.A. Raman system) with an argon ion laser (λ = 536 nm) in a wavenumber range of 500–3000 cm−1. Electrochemical measurements were assessed on the as-synthesized samples through a three electrode system on a Metrohm autolab electrochemical workstation (Zahner, Germany). A glassy carbon (GC) electrode with a diameter of 3 mm served as a substrate for the working electrode. A platinum disk electrode and Ag/AgCl (3.5 M KCl) were used as the counter and reference electrodes, respectively.Conflicts of interest
There are no conflicts to declare.Acknowledgements
AKS is grateful to CNPq for providing research funding in the form of PDF. AIRF JNU is also acknowledged gratefully for various characterizations. K. S. acknowledges the research grant from DST.Notes and references
- A. Demirbas, Prog. Energy Combust. Sci., 2005, 31, 171 CrossRef CAS.
- G. M. Masters, Renewable and Efficient Electric Power Systems, John Wiley & Sons, Hoboken NJ, USA, 2013 Search PubMed.
- M. Grätzel, Nature, 2001, 414, 338 CrossRef PubMed.
- J. Lu, S. Wang, C. Ding, W. Lv, Y. Zeng, N. Liu, H. Wang, Q. Meng and Q. Liu, J. Alloys Compd., 2019, 778, 134–140 CrossRef CAS.
- J. Greeley, T. F. Jaramillo, J. Bonde, I. Orndorff and J. K. Nørskov, Nat. Mater., 2006, 5, 909 CrossRef CAS.
- S. E. Hosseini and M. A. Wahid, Renewable Sustainable Energy Rev, 2016, 57, 850 CrossRef CAS.
- U. Sahaym and M. G. Norton, J. Mater. Sci., 2008, 43, 5395 CrossRef CAS.
- W. Gao, Z. Xia, F. Cao, J. C. Ho, Z. Jiang and Y. Qu, Adv. Funct. Mater., 2018, 28, 1706056–1706063 CrossRef.
- F. Favier, E. C. Walter, M. P. Zach, T. Benter and R. M. Penner, Science, 2001, 293, 2227 CrossRef CAS PubMed.
- J. Kong, M. G. Chapline and H. J. Dai, Adv. Mater., 2001, 13, 1384 CrossRef CAS.
- D. Barreca, D. Bekermann, E. Comini, A. Devi, R. A. Fischer, A. Gasparotto, C. Maccato, G. Sberveglieri and E. Tondello, Sens. Actuators, B, 2010, 149, 1 CrossRef CAS.
- D. Barreca, E. Comini, A. Gasparotto, C. Maccato, A. Pozza, C. Sada, G. Sberveglieri and E. Tondello, J. Nanosci. Nanotechnol., 2010, 10, 8054 CrossRef CAS.
- R. Subbaraman, D. Tripkovic, D. Strmcnik, K. C. Chang, M. Uchimura, A. P. Paulikas, V. Stamenkovic and N. M. Markovic, Science, 2011, 334, 1256 CrossRef CAS.
- A. Alarawi, V. Ramalingam, H.-C. Fu, P. Varadhan, R. Yang and J.-H. He, Opt. Express, 2019, 27, A353–A363 CrossRef PubMed.
- D. E. Bartak, B. Kazee, K. Shimazu and T. Kuwana, Anal. Chem., 1986, 58, 2756 CrossRef CAS.
- P. Millet, F. Andolfatto and R. Durand, Int. J. Hydrogen Energy, 1996, 21, 87 CrossRef CAS.
- H. B. Gray, Nat. Chem., 2009, 1, 7 CrossRef CAS.
- H. Ahmad, S. K. Kamarudin, L. J. Minggu and M. Kassim, Renewable Sustainable Energy Rev., 2015, 43, 599 CrossRef CAS.
- P. C. K. Vesborg, B. Seger and I. Chorkendorff, J. Phys. Chem. Lett., 2015, 6, 951 CrossRef CAS.
- X. Zou and Y. Zhang, Chem. Soc. Rev., 2015, 44, 5148 RSC.
- J. Liu, Y. Liu, N. Liu, Y. Han, X. Zhang, H. Huang, Y. Lifshitz, S.-T. Lee, J. Zhong and Z. Kang, Science, 2015, 347, 970 CrossRef CAS.
- B. Hinnemann, P. G. Moses, J. Bonde, K. P. Jørgensen, J. H. Nielsen, S. Horch, I. Chorkendorff and J. K. Nørskov, J. Am. Chem. Soc., 2005, 127, 5308 CrossRef CAS.
- A. B. Laursen, S. Kegnæs, S. Dahl and I. Chorkendorff, Energy Environ. Sci., 2012, 5, 5577 RSC.
- J. Bonde, P. G. Moses, T. F. Jaramillo, J. K. Nørskov and I. Chorkendorff, Faraday Discuss., 2008, 140, 219 RSC.
- X. Bian, J. Zhu, L. Liao, M. D. Scanlon, P. Ge, C. Ji, H. H. Girault and B. Liu, Electrochem. Commun., 2012, 22, 128 CrossRef CAS.
- E. G. S. Firmiano, M. A. L. Cordeiro, A. C. Rabelo, C. J. Dalmaschio, A. N. Pinheiro, E. C. Pereira and E. R. Leite, Chem. Commun., 2012, 48, 7687 RSC.
- Y. Li, H. Wang, L. Xie, Y. Liang, G. Hong and H. Dai, J. Am. Chem. Soc., 2011, 133, 7296 CrossRef CAS.
- A. Alarawi, V. Ramalingam and J.-H. He, Mater. Today Energy, 2019, 11, 1–23 CrossRef.
- Q. Li, B. D. Guo, J. G. Yu, J. R. Ran, B. H. Zhang, H. J. Yan and J. R. Gong, J. Am. Chem. Soc., 2011, 133, 10878 CrossRef CAS.
- Y. Yan, B. Y. Xia, X. Ge, Z. Liu, J. Y. Wang and X. Wang, ACS Appl. Mater. Interfaces, 2013, 5, 12794–12798 CrossRef CAS.
- M. Poisot, W. Bensch, S. Fuentes, C. Ornelas and G. Alonsoc, Catal. Lett., 2007, 117, 43–52 CrossRef CAS.
- T. S. Sahu and S. Mitra, Sci. Rep., 2015, 5, 12571 CrossRef CAS PubMed.
- C. Lee, H. Yan, L. E. Brus, T. F. Heinz, J. Hone and S. Ryu, ACS Nano, 2010, 4, 2695–2700 CrossRef CAS.
- X. Ren, Q. Ma, H. Fan, L. Pang, Y. Zhang, Y. Yao, X. Ren and S. (Frank) Liu, Chem. Commun., 2015, 51, 15997–16000 RSC.
- J. Mann, Q. Ma, P. M. Odenthal, M. Isarraraz, D. Le, E. Preciado, D. Barroso, K. Yamaguchi, G. von Son Palacio, A. Nguyen, T. Tran, M. Wurch, A. Nguyen, V. Klee, S. Bobek, D. Sun, T. F. Heinz, T. S. Rahman, R. Kawakami and L. Bartels, Adv. Mater., 2014, 26, 1399–1404 CrossRef CAS PubMed.
- H.-Y. He, Sci. Rep., 2017, 7, 45608 CrossRef CAS.
- M. A. Baker, R. Gilmore, C. Lenardi and W. Gissler, Appl. Surf. Sci., 1999, 150, 255–262 CrossRef CAS.
- N. M. D. Brown, N. Cui and A. McKinley, Appl. Surf. Sci., 1998, 134, 11–21 CrossRef CAS.
- T. A. Patterson, J. C. Carver, D. E. Leyden and D. M. A. Hercules, J. Phys. Chem., 1976, 80, 1700–1708 CrossRef CAS.
- S. Ahmed, X. Ding, N. Bao, P. Bian, R. Zheng, Y. Wang, P. P. Murmu, J. V. Kennedy, R. Liu, H. Fan, K. Suzuki, J. Ding and J. Yi, Chem. Mater., 2017, 29, 9066–9074 CrossRef CAS.
- Y. Ding, H. Liu, L. Gao, M. Fu, X. Luo, X. Zhang, X. Zhang, R.-C. Zeng and Q. Liu, J. Alloys Compd., 2019, 785, 1189–1197 CrossRef CAS.
- H. Liu, Y.-N. Ding, B. Yang, Z. Liu, X. Zhang and Q. Liu, ACS Sustainable Chem. Eng., 2018, 6, 14383–14393 CrossRef CAS.
- J. Lian, P. Liu, C. Jin, Z. Shi, X. Luo and Q. Liu, Microchim. Acta, 2019, 186, 332–340 CrossRef.
- S. Chen, Z. Wang, L. Fan, Y. Chen, H. Ren, H. Ji, D. Natelson, Y. Huang, J. Jiang and C. Zou, Phys. Rev. B: Condens. Matter Mater. Phys., 2017, 96, 125130 CrossRef.
- V. Maruthapandian, M. Mathankumar, V. Saraswathy, B. Subramanian and S. Muralidharan, ACS Appl. Mater. Interfaces, 2017, 9, 13132 CrossRef CAS.
- S. Ghosh, U. P. Azad, A. K. Singh, A. K. Singh and R. Prakash, ChemistrySelect, 2017, 2, 11590 CrossRef CAS.
- Q. Tang and D.-E. Jiang, ACS Catal., 2016, 6, 4953–4961 CrossRef CAS.
- Q. Li, B. Guo, J. Yu, J. Ran, B. Zhang, H. Yan and J. R. Gong, J. Am. Chem. Soc., 2011, 133, 10878 CrossRef CAS.
- A. Boochani and S. Veisi, Silicon, 2018, 10, 2855–2863 CrossRef CAS.
- A. Manikandan, P. Sriram, K.-C. Hsu, Y.-C. Wang, C.-W. Chen, Y.-C. Shih, T.-J. Yena, H.-T. Jeng, H.-C. Kuo and Y.-L. Chueh, Electrochim. Acta, 2019, 318, 374–383 CrossRef CAS.
- A. Manikandan, L. Lee, Y.-C. Wang, C.-W. Chen, Y.-Z. Chen, H. Medina, J.-Y. Tseng, Z. M. Wang and Y.-L. Chueh, J. Mater. Chem. A, 2017, 5, 13320–13328 RSC.
- F. Rosalbino, G. Borzone, E. Angelini and R. Raggio, Electrochim. Acta, 2003, 48, 3939–3944 CrossRef CAS.
- D. M. F. Santos, C. A. C. Sequeira, D. Maccio, A. Saccone and J. L. Figueiredo, Int. J. Hydrog. Energy, 2013, 38, 3137–3145 CrossRef CAS.
- W. Gao, D. Wen, J. C. Ho and Y. Qu, Mater. Today Chemistry, 2019, 12, 266–281 CrossRef CAS.
- A. P. Murthy, J. Theerthagiri, J. Madhavan and K. Murugan, Phys. Chem. Chem. Phys., 2017, 19, 1988–1998 RSC.
- J. Benson, M. Li, S. Wang, P. Wang and P. Papakonstantinou, ACS Appl. Mater. Interfaces, 2015, 7, 14113–14122 CrossRef CAS.
- A. Manikandan, L. Lee, Y.-C. Wang, C.-W. Chen, Y.-Z. Chen, H. Medina, J.-Y. Tseng, Z. M. Wang and Y.-L. Chueh, J. Mater. Chem. A, 2017, 5, 13320–13328 RSC.
- C.-B. Ma, X. Qi, B. Chen, S. Bao, Z. Yin, X.-J. Wu, Z. Luo, J. Wei, H.-L. Zhang and H. Zhang, Nanoscale, 2014, 6, 5624–5629 RSC.
Footnotes |
| † Electronic supplementary information (ESI) available. See DOI: 10.1039/c9ra03589c |
| ‡ Authors contributed equally. |
| This journal is © The Royal Society of Chemistry 2019 |

