 Open Access Article
Creative Commons Attribution 3.0 Unported Licence
Enhanced dewaterability of waste activated sludge by a combined use of permanganate and peroxymonosulfate
Lu Luoa,
Yongjian Geb,
Shuyu Yuanc,
Yanghai Yua,
Zhou Shia,
Shiqing Zhou*a and
Jing Deng *c
*c
aKey Laboratory of Building Safety and Energy Efficiency, Ministry of Education, Department of Water Engineering and Science, College of Civil Engineering, Hunan University, Changsha, Hunan 410082, P. R. China. E-mail: shiqingzhouwater@163.com
bChina United Engineering Corporation Limited, Hangzhou 310052, P. R. China
cCollege of Civil Engineering and Architecture, Zhejiang University of Technology, Hangzhou 310014, P. R. China. E-mail: 1029877668@qq.com
First published on 2nd September 2019
Abstract
Ever-increasing efforts have been made to develop rapid and practical conditioning methods of sludge dewatering. This study demonstrated an innovative combination of potassium permanganate (KMnO4) and peroxymonosulfate (PMS) for sludge dewatering. The combined use of KMnO4 and PMS (KMnO4/PMS) showed its superiority in improving sludge dewaterability over the separate use of KMnO4 or PMS. By dosing 4 mmol g−1 VSS KMnO4 and 3 mmol g−1 VSS PMS, the dewaterability of waste activated sludge (WAS) significantly enhanced as capillary suction time (CST) decreased from 73.65 s to 24.65 s while the water content of dewatered sludge cake (WC) decreased from 78.96% to 70.47%. Apart from CST and WC, the KMnO4/PMS process could also affect negative zeta potential, sludge flocs size and the concentrations of protein and polysaccharide in extracellular polymeric substances (EPS). The enhanced sludge dewaterability and changes of the physicochemical characteristics of the WAS samples during the KMnO4/PMS process were actually ascribed to sulfate radicals (SO4˙−) and hydroxyl radicals (HO˙) in situ generated via PMS activation by manganese oxides (MnOx) in the states of MnO2 and Mn3O4 transferred from KMnO4 oxidation, which was verified by transmission electron microscopy (TEM), energy dispersive X-ray spectroscopy (EDX) techniques and radical scavenging experiments. Moreover, the Fourier transform infrared spectroscopy (FTIR) analysis further confirmed that the in situ generated SO4˙− and HO˙ could improve sludge dewaterability. Thus, the KMnO4/PMS process could be considered as a promising conditioning method of sludge dewatering.
1. Introduction
The management of large quantities of waste activated sludge (WAS) produced from activated sludge processes has posed great challenges to municipal wastewater treatment plants (WWTPs) due to great economic and environmental burden.1–4 As reported, the treatment and disposal of excess sludge usually accounts for up to 60% of the total operating cost in WWTPs.2 Consequently, how to substantially cut down this kind of cost has become a significant issue, and many researchers and practitioners have tried their best to tackle this problem. WAS has a high water content in the form of free and bound water (over 90%).5 And sludge dewatering has been generally considered as a promising strategy in reducing sludge volume and cost of sludge transport and ultimate disposal.3,4 However, the sludge dewatering process is usually inhibited due to the presence of extracellular polymeric substances (EPS) that can retain a large amount of water, especially bound water.6,7 Hence, increasing efforts have been focused on development of efficient sludge dewatering techniques, which can promote the release of bound water from EPS. So far, thermal, ultrasonication, freezing and thawing, and chemical oxidation have been investigated to improve sludge dewaterability.7–12 Among all the developed methods, advanced oxidation processes (AOPs) have recently shown their superiority in sludge disintegration and dewatering.AOPs usually rely on the produced highly reactive radical species, such as hydroxyl radicals (HO˙) and sulfate radicals (SO4˙−) to disrupt WAS and degrade EPS, thereby enhancing sludge dewaterability.2,13,14 It has been reported that the Fenton (combination of H2O2 and Fe2+) and Fenton-like (e.g., simultaneous addition of H2O2 and Fe3+) processes based on HO˙ production could efficiently improve the dewaterability of WAS.1,7 However, only under strongly acidic conditions (pH = 2–5) can these processes generate sufficient amounts of HO˙ for better sludge dewaterability, which significantly hindered the sludge dewatering process and subsequent disposal.15–17 Compared to HO˙ (E0 = 1.8–2.7 V), SO4˙− owns a higher redox potential (E0 = 2.5–3.1 V), a longer life time (30–40 μs) and a wider working pH range (pH 4–9).4,18 Therefore, pretty much attention has been recently paid to the SO4˙−-based AOPs as new alternative methods of sludge conditioning. SO4˙− is usually generated through the activation of peroxydisulfate (PDS, S2O82−) and peroxymonosulfate (PMS, HSO5−) by ultraviolet (UV), heat, base and (transition) metal catalysts.19–25
Our recent study investigated α-MnO2 with different morphologies (nanoparticles, nanoflowers and nanorods) synthesized via a facile hydrothermal method as activators of PMS for ciprofloxacin (CIP) degradation, and found that α-MnO2 nanoflowers achieved much higher degradation efficiency of CIP than the other three MnO2 (α-MnO2 nanorods, α-MnO2 nanoparticles and commercial MnO2), which would be attributed to its higher catalytic activity of PMS and larger quantities of SO4˙− produced from its activation of PMS.26 Interestingly, Cui et al. recently studied chemical oxidation of benzene and trichloroethylene (TCE) by an innovative combined use of permanganate (KMnO4) and PMS (KMnO4/PMS), and also found that it was mainly colloidal and amorphous MnO2 in situ generated from KMnO4 oxidation that activated PMS to trigger powerful SO4˙−-mediated oxidation of both benzene and TCE.27 As known to us all, both KMnO4 and PMS have been widely used as powerful oxidants to destruct organic pollutants in water and wastewater. Recently, the two powerful oxidants were also applied to enhance the filterability of waste activated sludge.28,29 Wu et al. reported that KMnO4 could efficiently disintegrate the excess sludge with soluble chemical oxygen demand (SCOD) increasing by 3473%, and that the optimal KMnO4/sludge solid mass ratio was 0.1 with a stable disintegration degree (DDCOD) of about 34% while suitable reaction time was 30 min.28 Niu et al. found that PMS oxidation could effectively break sludge particles, and that EPS increased significantly and transferred to slime layer after PMS treatment.29 Yang et al. also reported that PMS could facilitate the disintegration of WAS and the biodegradability of organics could be enhanced after treatment by PMS.30 Although it has been proven that KMnO4 and PMS could disintegrate WAS and enhance sludge dewaterability, the synergistic effect of both oxidants on the dewaterability of WAS still remains unknown.
In this paper, we proposed a combined use of KMnO4 and PMS (KMnO4/PMS) for sludge dewatering. The dewaterability of WAS during the KMnO4/PMS process by the measurement of variations in capillary suction time (CST) and water content of dewatered sludge cake (WC) was initially investigated. Then, the physicochemical characteristics of WAS (CST, WC, zeta potential, particle size and the concentrations of protein and polysaccharide in EPS) at different dosages of KMnO4 and PMS were further studied. Finally, the mechanism of sludge dewatering by the KMnO4/PMS process was deeply explored.
2. Materials and methods
2.1. Raw sludge and chemicals
The raw sludge was collected from Qige municipal wastewater treatment plant in Hangzhou, China. A sieve with 20 mesh was then used to remove big gravels and debris from the collected sludge samples. The supernatant was finally decanted to acquire the denser sludge samples used in this study after plain sedimentation. The acquired denser sludge samples were stored at 4 °C in a refrigerator prior to use, and all the experiments were completed within 48 h. The basic characteristics of the sludge samples were measured and shown in Table 1.| Parameter | Unit | Value |
|---|---|---|
| pH | — | 6.85 ± 0.05 |
| Water content | % | 96.205 ± 0.005 |
| Volatile suspended solids (VSS) | g L−1 | 30.364 ± 0.394 |
| Total suspended solids (TSS) | g L−1 | 39.133 ± 0.951 |
| VSS/TSS | % | 77.355 ± 0.875 |
| CST | s | 73.65 ± 1.45 |
All the chemicals were used without further purification. Peroxymonosulfate (Oxone®, KHSO5·0.5 KHSO4·0.5 K2SO4, KHSO5 ≥47%) was provided by Aladdin Co., Ltd. (Shanghai, China). Permanganate (KMnO4, ≥99.5%), sodium hydroxide (NaOH, ≥96.0%), and sulfuric acid (H2SO4, 95.0–98.0%) were supplied by Sinopharm Chemical Reagent Co., Ltd. (Shanghai, China).
2.2. Experimental procedures
All the sludge dewatering experiments were conducted in an Erlenmeyer flask with a volume of 500 mL. In each test, 300 mL sludge sample was added and then mixed with a stoichiometric amount of PMS. When PMS was completely dissolved under thorough stirring, H2SO4 or NaOH was used to adjust the solution pH to 7. Finally, the reaction was immediately initiated by dosing a calculated amount of KMnO4 in a water bath apparatus (300 rpm), and was ceased after 120 min. All the experiments were duplicated at least, and the average values with standard deviations were presented.2.3. Analytical methods
 | (1) |
Before the analyses of protein and polysaccharide (assumed as dominant components of EPS), the EPS samples were pretreated with an optimal amount of Na2SO3 to quench the residual colored KMnO4. The pretreated EPS sample was then filtered through a 0.45 μm cellulose acetate membrane. The protein content was quantified by the modified Lowry–Folin method using bovine serum albumin as the standard.31 The polysaccharide content was determined by the phenol-sulfuric acid method using glucose as the standard.32
Given the difficulty in separating the formed solids from the conditioned WAS samples, the extracted EPS solution was used and treated with the KMnO4/PMS process to monitor whether manganese oxides (MnOx) formed after KMnO4 oxidation of the organics in EPS. Briefly, after the extracted EPS solution was treated with the KMnO4/PMS process, the reaction solution was filtered through a 0.45 μm cellulose acetate membrane to collect the brown-red solids. Then, the collected solids were rinsed alternately several times using ethanol and ultrapure water, and vacuum-dried at 60 °C overnight. Finally, the dried solid samples were scanned by transmission electron microscopy (TEM) to capture the microscale crystallization and structure and energy dispersive X-ray spectroscopy (EDX) to analyze the elemental composition.
3. Results and discussion
3.1. Feasibility of sludge dewatering with the KMnO4/PMS process
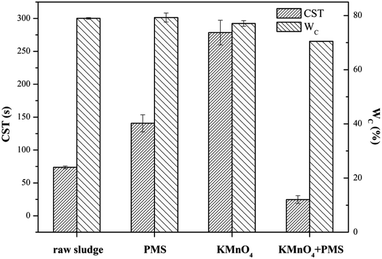
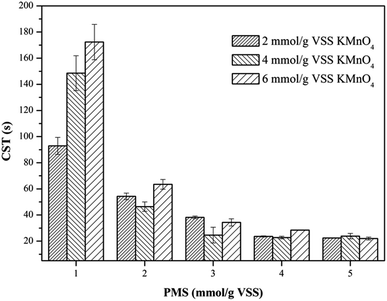
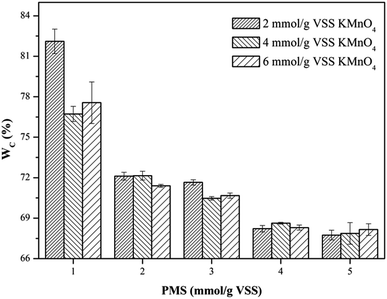
Fig. 1 compared the dewaterability of the WAS samples conditioned by KMnO4 alone, PMS alone, and a combination of KMnO4 and PMS (KMnO4/PMS), respectively. As observed, the CST increased from 73.65 s to 140.60 s and 278.55 s, respectively when the WAS samples were conditioned by 7 mmol g−1 VSS PMS and KMnO4 alone, respectively, which indicated that neither PMS alone nor KMnO4 alone could efficiently improve the sludge dewaterability, and that the two individuals even worsened the dewaterability. The deterioration of sludge dewaterability was likely resulted from the progressive cell lysis and further releasing of intracellular biopolymers under the influence of KMnO4 or PMS when the intracellular biopolymers could not be degraded effectively in current condition.33 Lee et al. also found that the PMS conditioning could deteriorate the dewaterability after the WAS samples were treated with different dosages of PMS at room temperature.5 Surprisingly, a combined use of 4 mmol g−1 VSS KMnO4 and 3 mmol g−1 VSS PMS instantly decreased the CST from 73.65 s to 24.65 s, and apparently showed its synergistic effect on significantly improving the sludge dewaterability. Besides, the decrease of WC (from 78.96% to 70.47%) also indicated the synergistic effect after the WAS samples were conditioned by the KMnO4/PMS process while the WC values almost remained unchanged after the samples were treated with PMS alone and KMnO4 alone (79.25% and 77.07%, respectively). The synergistic effect of the KMnO4/PMS process on the WAS dewaterability was interpreted with the decrease of both CST and WC, which also implied the generation of SO4˙− and HO˙ during the KMnO4/PMS process as mentioned in Section 1.3.2. Effect of the KMnO4/PMS process on the physicochemical characteristics of the WAS samples
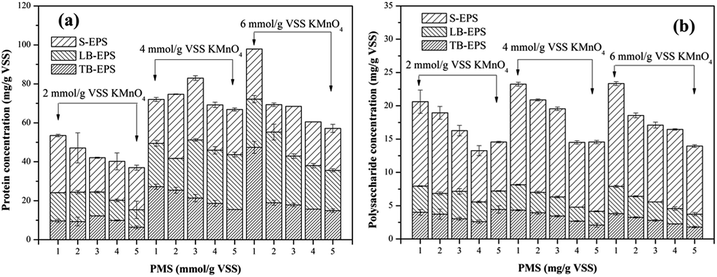 | ||
| Fig. 6 Effect of the KMnO4/PMS process on EPS of the WAS samples: (a) protein; (b) polysaccharide (experimental conditions: [KMnO4] = 2–6 mmol g−1 VSS, [PMS] = 1–5 mmol g−1 VSS, pH0 = 7, T = 25 °C). | ||
The dissolved organics (protein and polysaccharide) in S-EPS increased before decreasing because TB-EPS were dissolved and transferred to S-EPS after the sludge flocs were destructed by SO4˙− and HO˙ generated in the KMnO4/PMS process.29 Nevertheless, more SO4˙− and HO˙ were generated to degrade the organics in S-EPS when PMS dosage continued to increase, so the protein and polysaccharide content in S-EPS tended to decrease. In addition, the slump of the protein and polysaccharide content in S-EPS, LB-EPS and TB-EPS accounted for SO4˙− and HO˙ generation in the KMnO4/PMS process and its high reactivity toward S-EPS, LB-EPS, and even TB-EPS.4
3.3. Mechanism of WAS dewatering by the KMnO4/PMS process
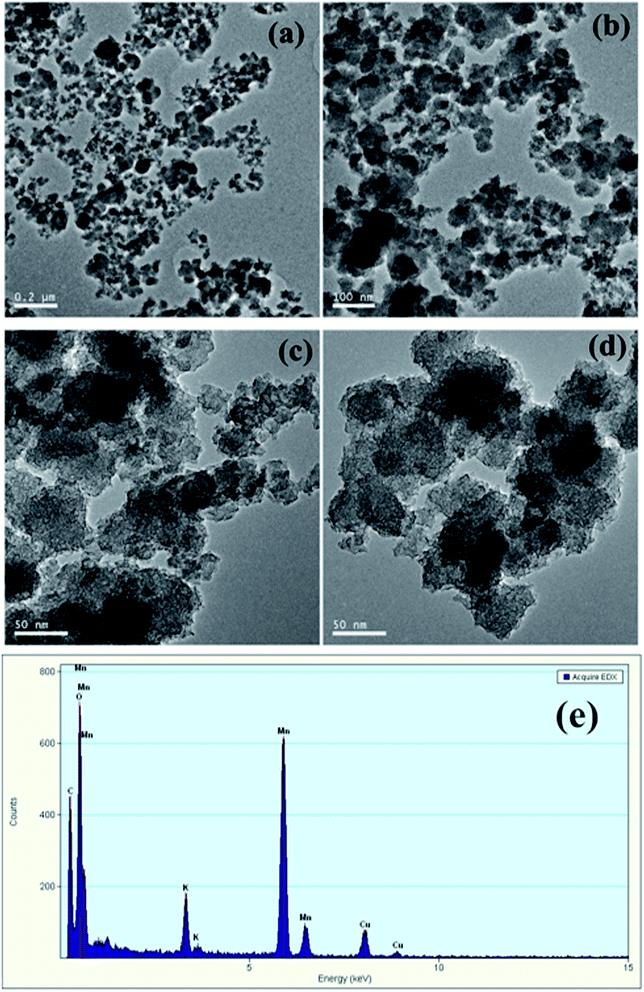
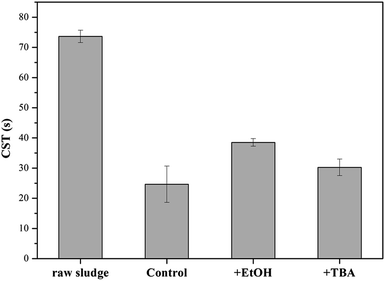
Due to the versatility and efficiency, KMnO4 was deemed as an important precursor for the fabrication of manganese oxide nanomaterials through chemical reduction, including manganese dioxides, tetraoxides and oxyhydroxides.43 Wu et al. used KMnO4 as a conditioner for disintegration of excess activated sludge, and found that after sludge oxidation KMnO4 mainly transferred to the states of MnO2 and Mn3O4 while some compounds of KxMnO4 also existed in the solids.28 Due to the multivalent nature of Mn, MnO2 and Mn3O4 have been proven to possess a high catalytic activity toward PMS for SO4˙− generation.44,45 Thus, in the KMnO4/PMS process, manganese oxides (MnOx) in the state of MnO2 and Mn3O4 might be generated from the reduction of KMnO4, then MnO2 and Mn3O4 further activated PMS to produce SO4˙− and HO˙.In order to verify the hypothesis, the formed solids were separated from the KMnO4/PMS process. And the samples were observed through TEM and EDX. From Fig. 7a–d, it could be clearly seen that some nanoscale solids did form in the KMnO4/PMS process. Moreover, the EDX analysis further confirmed that the formed solids were mainly composed of element Mn, O and K (Fig. 7e), and the weight percentages of Mn, O and K were recorded to be 20.9%, 74.26% and 4.82%. It suggested that KMnO4 was disintegrate into MnOx under the influence of EPS. According to the previous study, the solids might also be MnOx in the states of MnO2, Mn3O4 and KxMnO4.28 Meanwhile, scavenging experiments using ethanol (EtOH) and tert-butyl alcohol (TBA) as radical scavengers were conducted to confirm the formation of SO4˙− and HO˙ in the KMnO4/PMS process. As can be seen in Fig. 8, after extra addition of 300 mmol g−1 VSS EtOH and TBA, the CST decreased from 73.65 s to 38.50 s and 30.25 s, respectively while decreasing from 73.65 to 24.65 s without addition of any radical scavenger. Moreover, the reduction value of CST with the addition of EtOH was higher than that with the addition of TBA. Such difference in CST value drop by the two radical scavengers implied that both SO4˙− and HO˙ were generated in the KMnO4/PMS process because EtOH can effectively quench both SO4˙− and HO˙ while TBA reacts much faster with HO˙ than SO4˙−.25
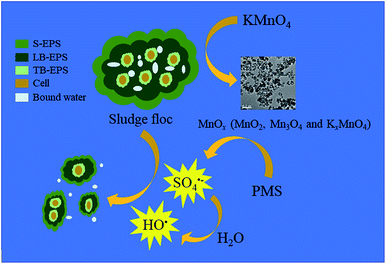
Based on both the results above and current studies, a possible mechanism was proposed. As depicted in Fig. 9, Firstly, KMnO4 transformed into MnO2, Mn3O4 and KxMnO4 after oxidizing the organics in EPS. Then, the in situ generated MnO2 and Mn3O4 efficiently activated PMS to generate SO4˙− and HO˙ (eqn (2)–(5)). In detail, HSO5− (the species of PMS) initially integrated with ![[triple bond, length as m-dash]](https://www.rsc.org/images/entities/char_e002.gif) MnIV and
MnIV and ![[triple bond, length as m-dash]](https://www.rsc.org/images/entities/char_e002.gif) MnIII located at the surface of MnO2 and Mn3O4 by surface hydroxyl groups (eqn (6)). Then,
MnIII located at the surface of MnO2 and Mn3O4 by surface hydroxyl groups (eqn (6)). Then, ![[triple bond, length as m-dash]](https://www.rsc.org/images/entities/char_e002.gif) MnIV and
MnIV and ![[triple bond, length as m-dash]](https://www.rsc.org/images/entities/char_e002.gif) MnIII would be reduced to
MnIII would be reduced to ![[triple bond, length as m-dash]](https://www.rsc.org/images/entities/char_e002.gif) MnIII and
MnIII and ![[triple bond, length as m-dash]](https://www.rsc.org/images/entities/char_e002.gif) MnII, respectively with the generation of SO5˙− (eqn (7)). Meanwhile, the formed
MnII, respectively with the generation of SO5˙− (eqn (7)). Meanwhile, the formed ![[triple bond, length as m-dash]](https://www.rsc.org/images/entities/char_e002.gif) MnIII and
MnIII and ![[triple bond, length as m-dash]](https://www.rsc.org/images/entities/char_e002.gif) MnII could be oxidized to
MnII could be oxidized to ![[triple bond, length as m-dash]](https://www.rsc.org/images/entities/char_e002.gif) MnIV and
MnIV and ![[triple bond, length as m-dash]](https://www.rsc.org/images/entities/char_e002.gif) MnIII with the formation of SO4˙− (eqn (8) and (9)). Furthermore, HO˙ could also be produced through the reaction between SO4˙− and H2O (eqn (5)).46 Finally, SO4˙− and HO˙ degraded the organics in EPS to break the sludge flocs so that huge quantities of bound water were released and became free water, thus significantly enhancing sludge dewaterability.
MnIII with the formation of SO4˙− (eqn (8) and (9)). Furthermore, HO˙ could also be produced through the reaction between SO4˙− and H2O (eqn (5)).46 Finally, SO4˙− and HO˙ degraded the organics in EPS to break the sludge flocs so that huge quantities of bound water were released and became free water, thus significantly enhancing sludge dewaterability.
| 2Mn3O4 + HSO5− → 3Mn2O3 + SO4˙− + H+ | (2) |
| 2MnO2 + HSO5− → SO5˙− + OH− + Mn2O3 | (3) |
| Mn2O3 + HSO5− → SO4˙− + 2MnO2 + H+ | (4) |
| SO4˙− + H2O → HO˙ + H+ + SO42− | (5) |
![[triple bond, length as m-dash]](https://www.rsc.org/images/entities/char_e002.gif) MnIV(III) – OH + HSO5− → MnIV(III) – OH + HSO5− → ![[triple bond, length as m-dash]](https://www.rsc.org/images/entities/char_e002.gif) MnIV(III) − (O)OSO3− + H2O MnIV(III) − (O)OSO3− + H2O
| (6) |
![[triple bond, length as m-dash]](https://www.rsc.org/images/entities/char_e002.gif) MnIV(III) − (O)SO3− + H2O → MnIV(III) − (O)SO3− + H2O → ![[triple bond, length as m-dash]](https://www.rsc.org/images/entities/char_e002.gif) MnIII(II) − OH + SO5˙− + H+ MnIII(II) − OH + SO5˙− + H+
| (7) |
![[triple bond, length as m-dash]](https://www.rsc.org/images/entities/char_e002.gif) MnIII(II) − OH + HSO5− → MnIII(II) − OH + HSO5− → ![[triple bond, length as m-dash]](https://www.rsc.org/images/entities/char_e002.gif) MnIII(II) − (O)OSO−3 + H2O MnIII(II) − (O)OSO−3 + H2O
| (8) |
![[triple bond, length as m-dash]](https://www.rsc.org/images/entities/char_e002.gif) MnIII(II) − (O)OSO3− + H2O → MnIII(II) − (O)OSO3− + H2O → ![[triple bond, length as m-dash]](https://www.rsc.org/images/entities/char_e002.gif) MnIV(III) − OH + SO4˙− + OH− MnIV(III) − OH + SO4˙− + OH−
| (9) |
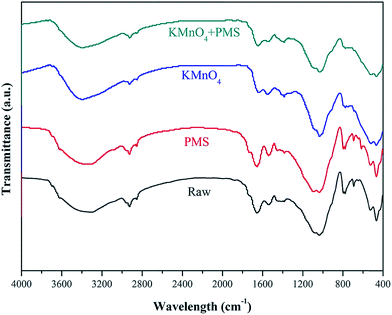
FTIR spectrometer was also used to observed the variations of WAS functional groups after conditioning in different conditions. As illustrated in Fig. 10, the broad absorption band from 3200 to 3400 cm−1 could be attributed to the stretching vibrations of O–H group of polymeric substances.47 The peaks at 2925 and 2852 cm−1 were asymmetric and symmetric vibration of CH2 of aliphatic structures and lipids, respectively.48 The absorption band between 1640 to 1660 cm−1 was associated with the stretching vibrations of C![[double bond, length as m-dash]](https://www.rsc.org/images/entities/char_e001.gif) O and C–N, and C–N stretching vibration and N–H deformation vibration at 1550–1560 cm−1.49 The typical band located at 1040–1070 cm−1 was due to the stretching vibration of OH.49 Besides, some peaks (<1000 cm−1) monitored in the “fingerprint” region could be attributed to the phosphate or sulfur functional groups, which is the functional groups for the production of nucleic acids.48 Compared with conditioning by KMnO4 or PMS alone, it can be clearly seen that the intensity of absorption bands of WAS decreased obviously after treatment by the KMnO4/PMS process, implying that SO4˙− and HO˙ generated in the KMnO4/PMS process could effectively degrade the proteins and polysaccharides in EPS and then resulted in the release of bound water and the improvement of sludge filterability.
O and C–N, and C–N stretching vibration and N–H deformation vibration at 1550–1560 cm−1.49 The typical band located at 1040–1070 cm−1 was due to the stretching vibration of OH.49 Besides, some peaks (<1000 cm−1) monitored in the “fingerprint” region could be attributed to the phosphate or sulfur functional groups, which is the functional groups for the production of nucleic acids.48 Compared with conditioning by KMnO4 or PMS alone, it can be clearly seen that the intensity of absorption bands of WAS decreased obviously after treatment by the KMnO4/PMS process, implying that SO4˙− and HO˙ generated in the KMnO4/PMS process could effectively degrade the proteins and polysaccharides in EPS and then resulted in the release of bound water and the improvement of sludge filterability.
4. Conclusion
This paper investigated the application of a combined use of KMnO4 and PMS (KMnO4/PMS) for sludge dewatering. The major conclusions can be drawn as followed:(1) Compared with the separate use of KMnO4 or PMS, the combined use of KMnO4 and PMS (KMnO4/PMS) could significantly improve sludge dewaterability. After conditioning with the KMnO4/PMS process, CST of the WAS samples decreased from 73.65 s to 24.65 s. However, the dewaterability of WAS would be worsened by conditioning with KMnO4 alone or PMS alone because the CST value increased significantly.
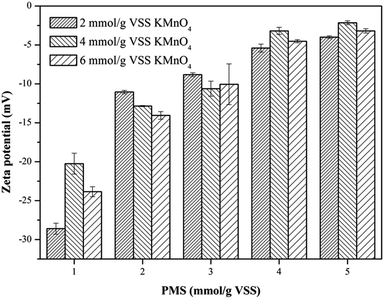
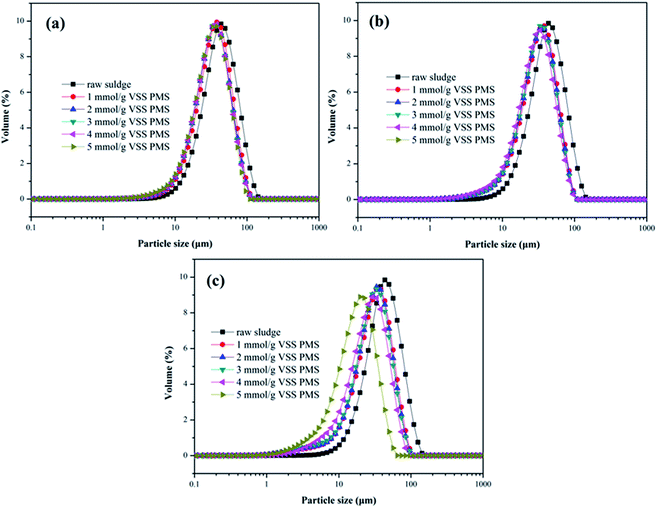
(2) The KMnO4/PMS process exerted significant effects on the physicochemical characteristics of the WAS samples. When the WAS samples were treated by the KMnO4/PMS process, both CST and WC would decrease, the zeta potential was less negative, and the particle size would also decrease as the sludge flocs were broken into smaller fragments. Besides, the concentrations of protein and polysaccharide in EPS were also reduced due to the synergistic effect of KMnO4 and PMS.
(3) The combined use of TEM and EDX techniques verified the generation of MnOx in the states of MnO2, Mn3O4 and KxMnO4 after KMnO4 oxidation. The radical scavenging experiments confirmed that the in situ generated MnO2 and Mn3O4 could activate PMS to generate SO4˙− and HO˙, which were responsible for significantly enhanced sludge dewaterability. Moreover, the FTIR analysis further indicated that SO4˙− and HO˙ generated in the KMnO4/PMS process could improve sludge dewaterability.
Conflicts of interest
There are no conflicts to declare.Acknowledgements
This work was financially supported by the Fund of State Key Laboratory of Pollution Control and Resource Reuse (PCRRF17023).References
- D.-Q. He, L.-F. Wang, H. Jiang and H.-Q. Yu, Chem. Eng. J., 2015, 272, 128–134 CrossRef CAS.
- M. S. Kim, K. M. Lee, H. E. Kim, H. J. Lee, C. Lee and C. Lee, Environ. Sci. Technol., 2016, 50, 7106–7115 CrossRef CAS PubMed.
- H. Yuan, N. Zhu and L. Song, Bioresour. Technol., 2010, 101, 4285–4290 CrossRef CAS.
- J. Liu, Q. Yang, D. Wang, X. Li, Y. Zhong, X. Li, Y. Deng, L. Wang, K. Yi and G. Zeng, Bioresour. Technol., 2016, 206, 134–140 CrossRef CAS.
- K.-M. Lee, M. S. Kim and C. Lee, Sustainable Environ. Res., 2016, 26, 177–183 CrossRef CAS.
- W. Yu, J. Yang, S. Tao, Y. Shi, J. Yu, Y. Lv, S. Liang, K. Xiao, B. Liu, H. Hou, J. Hu and X. Wu, Water Res., 2017, 126, 342–350 CrossRef CAS PubMed.
- R. Mo, S. Huang, W. Dai, J. Liang and S. Sun, Chem. Eng. J., 2015, 269, 391–398 CrossRef CAS.
- C. Bougrier, J. P. Delgenès and H. Carrère, Chem. Eng. J., 2008, 139, 236–244 CrossRef CAS.
- X. Feng, J. Deng, H. Lei, T. Bai, Q. Fan and Z. Li, Bioresour. Technol., 2009, 100, 1074–1081 CrossRef CAS PubMed.
- K. Hu, J. Q. Jiang, Q. L. Zhao, D. J. Lee, K. Wang and W. Qiu, Water Res., 2011, 45, 5969–5976 CrossRef CAS PubMed.
- C.-J. Cheng and P. K. A. Hong, Bioresour. Technol., 2013, 142, 69–76 CrossRef CAS PubMed.
- G. Y. Zhen, X. Q. Lu, Y. Y. Li and Y. C. Zhao, Bioresour. Technol., 2013, 136, 654–663 CrossRef CAS PubMed.
- P. Shi, R. Su, S. Zhu, M. Zhu, D. Li and S. Xu, J. Hazard. Mater., 2012, 229–230, 331–339 CrossRef CAS PubMed.
- J. Yu, K. Xiao, J. Yang, W. Yu, K. Pei, Y. Zhu, J. Wang, S. Liang, J. Hu, H. Hou and B. Liu, ACS Sustainable Chem. Eng., 2019, 7, 324–331 CrossRef CAS.
- E. Neyens, J. Baeyens, M. Weemaes and B. De heyder, J. Hazard. Mater., 2003, 98, 91–106 CrossRef CAS.
- H. Zhang, J. Yang, W. Yu, S. Luo, L. Peng, X. Shen, Y. Shi, S. Zhang, J. Song, N. Ye, Y. Li, C. Yang and S. Liang, Water Res., 2014, 59, 239–247 CrossRef CAS PubMed.
- Y. Li, X. Yuan, D. Wang, H. Wang, Z. Wu, L. Jiang, D. Mo, G. Yang, R. Guan and G. Zeng, Bioresour. Technol., 2018, 262, 294–301 CrossRef CAS PubMed.
- K. Xiao, Y. Chen, X. Jiang, Q. Yang, W. Y. Seow, W. Zhu and Y. Zhou, Water Res., 2017, 109, 13–23 CrossRef CAS PubMed.
- T. K. Lau, C. Wei and N. J. D. Graham, Environ. Sci. Technol., 2007, 41, 613 CrossRef CAS PubMed.
- G. Ying-Hong, M. Jun, L. Xu-Chun, F. Jing-Yun and C. Li-Wei, Environ. Sci. Technol., 2011, 45, 9308 CrossRef PubMed.
- C. Tan, N. Gao, Y. Deng, N. An and J. Deng, Chem. Eng. J., 2012, 203, 294–300 CrossRef CAS.
- J. Deng, Y. Shao, N. Gao, Y. Deng, S. Zhou and X. Hu, Chem. Eng. J., 2013, 228, 765–771 CrossRef CAS.
- O. S. Furman, A. L. Teel and R. J. Watts, Environ. Sci. Technol., 2010, 44, 6423–6428 CrossRef CAS PubMed.
- C. Qi, X. Liu, J. Ma, C. Lin, X. Li and H. Zhang, Chemosphere, 2016, 151, 280–288 CrossRef CAS PubMed.
- G. P. Anipsitakis and D. D. Dionysiou, Environ. Sci. Technol., 2004, 38, 3705–3712 CrossRef CAS PubMed.
- J. Deng, Y. Ge, C. Tan, H. Wang, Q. Li, S. Zhou and K. Zhang, Chem. Eng. J., 2017, 330, 1390–1400 CrossRef CAS.
- J. Cui, L. Zhang, B. Xi, J. Zhang and X. Mao, Chem. Eng. J., 2017, 313, 815–825 CrossRef CAS.
- C. Wu, G. Zhang, P. Zhang and C.-C. Chang, Chem. Eng. J., 2014, 240, 420–425 CrossRef CAS.
- T. Niu, Z. Zhou, W. Ren, L.-M. Jiang, B. Li, H. Wei, J. Li and L. Wang, Int. Biodeterior. Biodegrad., 2016, 106, 170–177 CrossRef CAS.
- J. Yang, X. Liu, D. Wang, Q. Xu, Q. Yang, G. Zeng, X. Li, Y. Liu, J. Gong and J. Ye, Water Res., 2019, 148, 239–249 CrossRef CAS PubMed.
- B. Fr/olund, T. Griebe and P. H. Nielsen, Appl. Microbiol. Biotechnol., 1995, 43, 755–761 CrossRef.
- M. DuBois, K. A. Gilles, J. K. Hamilton, P. A. Rebers and F. Smith, Anal. Chem., 1956, 28, 350–356 CrossRef CAS.
- K. Xiao, Y. Chen, X. Jiang, V. K. Tyagi and Y. Zhou, Water Res., 2016, 105, 470–478 CrossRef CAS PubMed.
- C. Cai, H. Zhang, X. Zhong and L. Hou, J. Hazard. Mater., 2015, 283, 70–79 CrossRef CAS PubMed.
- J. Yan, M. Lei, L. Zhu, M. N. Anjum, J. Zou and H. Tang, J. Hazard. Mater., 2011, 186, 1398–1404 CrossRef CAS PubMed.
- J. Liu, Z. Zhao, P. Shao and F. Cui, Chem. Eng. J., 2015, 262, 854–861 CrossRef CAS.
- J. Liu, Y. Wei, K. Li, J. Tong, Y. Wang and R. Jia, Water Res., 2016, 90, 225–234 CrossRef CAS PubMed.
- G. Zhen, X. Lu, B. Wang, Y. Zhao, X. Chai, D. Niu, A. Zhao, Y. Li, Y. Song and X. Cao, Bioresour. Technol., 2012, 124, 29–36 CrossRef CAS PubMed.
- H. Gharibi, M. H. Sowlat, A. H. Mahvi, M. Keshavarz, M. H. Safari, S. Lotfi, M. Bahram Abadi and A. Alijanzadeh, Chemosphere, 2013, 90, 1487–1494 CrossRef CAS PubMed.
- G. Zhen, X. Lu, Y. Li, Y. Zhao, B. Wang, Y. Song, X. Chai, D. Niu and X. Cao, Bioresour. Technol., 2012, 119, 7–14 CrossRef CAS PubMed.
- M. J. Higgins and J. T. Novak, Water Environ. Res., 1997, 69, 215–224 CrossRef CAS.
- D. Mowla, H. N. Tran and D. G. Allen, Biomass Bioenergy, 2013, 58, 365–378 CrossRef CAS.
- K. A. M. Ahmed, Journal of Taibah University for Science, 2016, 10, 412–429 CrossRef.
- E. Saputra, S. Muhammad, H. Sun, H. M. Ang, M. O. Tadé and S. Wang, Environ. Sci. Technol., 2013, 47, 5882–5887 CrossRef CAS PubMed.
- E. Saputra, S. Muhammad, H. Sun, H.-M. Ang, M. O. Tadé and S. Wang, J. Colloid Interface Sci., 2013, 407, 467–473 CrossRef CAS PubMed.
- Z. Zhao, J. Zhao and C. Yang, Chem. Eng. J., 2017, 327, 481–489 CrossRef CAS.
- Z. Chen, W. Zhang, D. Wang, T. Ma, R. Bai and D. Yu, Water Res., 2016, 103, 170–181 CrossRef CAS PubMed.
- H.-y. Pei, W.-r. Hu and Q.-h. Liu, J. Hazard. Mater., 2010, 178, 397–403 CrossRef CAS PubMed.
- J. Laurent, M. Casellas, H. Carrere and C. Dagot, Chem. Eng. J., 2011, 166, 841–849 CrossRef CAS.
| This journal is © The Royal Society of Chemistry 2019 |

