 Open Access Article
The relationship between microstructure and photocatalytic behavior in lanthanum-modified 2D TiO2 nanosheets upon annealing of a freeze-cast precursor†
Snejana Bakardjieva *a,
Jakub Maresa,
Radek Fajgarb,
Victor Y. Zenouc,
Michaela Maleckovad,
Efthalia Chatzisymeone,
Hana Bibovaf and
Jaromir Jirkovskyf
aInstitute of Inorganic Chemistry of the Czech Academy of Sciences, 250 68 Husinec-Řež, Czech Republic. E-mail: snejana@iic.cas.cz
bInstitute of Chemical Process and Fundamentals of the Czech Academy of Sciences, Rozvojova 2/135, 165 02 Prague, Czech Republic
cNuclear Research Center-Negev, Department of Material Engineering, 841 90 Beer Sheva, Israel
dCharles University, Faculty of Science, Hlavova 2030/8, 128 42, Prague, Czech Republic
eSchool of Engineering, Institute for Infrastructure and Environment, The University of Edinburgh, Edinburgh, EH9 3JL, UK
fJ. Heyrovsky Institute of Physical Chemistry of the Czech Academy of Sciences, Dolejskova 2155/3, 182 23 Prague, Czech Republic
First published on 25th July 2019
Abstract
Titanium dioxide modified with 3 wt% La was prepared via a green freeze-casting method, and its photocatalytic activity was tested in terms of its ability to degrade 4-chlorophenol (4-CP) and remove total organic carbon (TOC). Under annealing conditions, the freeze-cast precursor was transformed into an La-modified anatase with a well-defined 2D TiO2 nanosheet morphology. Rietveld refinement of the X-ray diffraction patterns confirmed the substitutional nature of the La cation that induced local structural variations and involved subtle ion displacement in the TiO2 lattice due to the ionic size effect. Despite nearly identical tetragonal structures, replacement of Ti with La alters the photocatalytic activity through a reduction in band gap energies and an increase in charge carrier mobility. Material annealed at 650 °C exhibited the highest photocatalytic performance and achieved efficient TOC removal. Upon annealing at 800 °C, nanoscale lanthanum-enriched regions were generated due to the diffusive migration of La cations and phase transition from anatase to rutile. The La3+ cation, acting as a structural promoter, supported 2D TiO2 growth with well controlled crystallite size, surface area and porosity. La3+ could be regarded as a potential electronic promoter that can reduce the band gap of 2D TiO2 nanosheets and can provide a signature of the electron transfer and carrier charge separation. Both methods, kinetics of degradation of 4-CP and TOC, provided similar results, revealing that the photocatalytic activity under UV light irradiation increased in the order 950C < 500 °C < 800 °C < 650 °C < TiO2-P25.
1 Introduction
The natural environment is a priceless part of our heritage. A healthy natural environment is vitally important for all ecosystems, and it is our responsibility to protect it. Water and air pollution are considered major environmental issues that should be urgently addressed. Organic compounds such as chlorophenols, are used as pesticides, herbicides and disinfectants, and they are considered priority environmental pollutants.1 Over the past years, various aspects of photocatalysis have been reviewed, and the importance of this technology for the remediation of air and water pollutants is well documented.2 Among several semiconductors, TiO2 has been proven to be one of the most widely used photocatalysts for decomposing organic compounds due to its strong redox ability, chemical and thermal stability and low cost.3–5 Photocatalysts based on d0 (Ti) transition metal oxides have emerged as good materials for heterogeneous photocatalytic systems, mainly because of their advantageous electronic configurations of empty d orbitals that minimize trapping of excited electrons and holes. Additionally, TiO2 is not classified as hazardous according to the United Nations' Globally Harmonized System of Classification and Labeling of Chemicals (UN-GHS 2011).6 However, TiO2 has a certain drawback regarding its application under solar light. Due to the wide band gap of TiO2 (i.e., 3.2 eV for anatase and 3.0 eV for rutile), only ultraviolet (UV) light can excite TiO2 to generate photoinduced holes (h+) and electrons (e−). Some of the strategies employed to increase the solar photoactivity of TiO2 include the addition of a cocatalyst (Pt, RuO2) as well as the doping of TiO2 with nonmetal and metal ions to induce morphological changes.7–9 These strategies have led to the discovery of using the lanthanide series of elements as the dopants because they have an effect on the stabilization of the anatase phase of TiO2. Recent studies of Liu10 and Cunha11 reported the utilization of La2O3 as a booster for the heterogeneous photocatalytic degradation of ammonia and methane gases, respectively. The boosting effects of lanthanum on the degradation reaction could be attributed to several reasons. The most important phenomena involved in this mechanism are the stabilization of the active sites onto the TiO2 surface in their stable Ti(IV) valence state12 and the synergistic effect between La-involved active sites and Ti active sites due to direct contact between La cations and the TiO2 matrix.13La-modified TiO2 photocatalysts are usually prepared by sol–gel processes,14–17 which have their own drawbacks that include the requirement for expensive metal alkoxides, little control over the porosity due to shrinkage of a wet gel upon drying and slow rate of the solvent removal.18 There is scientific and technological interest worldwide in developing cleaner and more efficient methods for the synthesis of catalysts with well-controlled morphology (size, shape and crystal structure). Therefore, great emphasis is currently placed on the implementation of environmentally friendly (“green”) procedures that could reduce or even avoid the use and generation of hazardous substances while minimizing waste production, energy and time consumption.
Recently, ice nucleation and crystal growths have been used to create porous materials with controlled pore dimensions. This process has been termed ‘‘freeze-cast forming’’ (lyophilization) and uses ice formation to create microscopic ice voids in a solid body. Subsequent removal of the ice through sublimation (simple transition of substances from solid to vapor state, performed at low temperature and vacuum) leaves behind a rigid, porous material.19 To date, little effort has been made on the growth of porous 2D TiO2 nanosheets, which might be attributed to the limited use of the freeze-casting method in nanomaterials science, particularly in photochemistry and photocatalysis.20–22 Herein, we use the freeze-cast technique suited for the synthesis of the series of nanocrystalline 2D TiO2 materials from a thermally annealed freeze-cast peroxo-polytitanic acid (PPTA) precursor modified with 3 wt% La, and we drew connections between crystallographic structure and photoactivity. The technique uses little other than water, which is an environmentally friendly, nontoxic dispersing medium and costs very little as a tool, and is a huge saving compared to the sol–gel method. In addition, this method could be applicable to photocatalysts of all kinds. Among all rare Earth-modified TiO2, the system based on the La3+ ion is of interest because its coordination improved the trapping-to-recombination rate ratio of photogenerated electrons and holes compared with pristine TiO2.23 We exploited the TiO6 octahedral unit modulated by substitutionally incorporated La3+ to understand the influence of lattice distortion on the structural, optical, and electronic properties of 2D TiO2 nanosheets. A set of the 4-CP photocatalytic degradation tests was carried out in an aqueous suspension under UV light irradiation, and total organic carbon (TOC) removal (mineralization of 4-CP) was investigated simultaneously. Characterization results were compared to standard Degussa TiO2-P25 to validate the advantages of the materials as obtained. In this research, several characterization techniques like X-ray powder diffraction (XRD), high-resolution transmission electron microscopy (HRTEM), X-ray photoelectron spectroscopy (XPS), Raman, FTIR, EPR and BET/BJH were used, resulting in aspects like detailed crystal structures and refinement of lattice distortions clarifying the effect of La3+ ions on the microstructure, charge carrier separation and photocatalytic efficiency of 2D TiO2 nanosheets.
2 Experimental
2.1 Materials
Titanium(IV) oxysulfate (titanyl sulfate, TiOSO4, Sigma-Aldrich spol. s.r.o., Prague, Czech Republic) was used as a TiO2 precursor. Lanthanum(III) nitrate hexahydrate, La(NO3)3·6H2O Assay Spec. ≥99%, served as the La dopant source. During material synthesis, an aqueous solution of ammonia (NH3, solution purum p.a., 25–29%, Fisher Scientific, spol. s.r.o., Pardubice Czech Republic) was used for precipitation of the precursor and hydrogen peroxide (H2O2, solution purum p.a., 30%, Fisher Scientific, spol. s.r.o., Pardubice Czech Republic) for pH reduction. 4-Chlorophenol (4-CP, purity ≥ 99.9%, Sigma-Aldrich, Prague, Czech Republic) and AEROXIDE TiO2-P25 (Evonik, Prague, Czech Republic) were used for the photocatalytic experiments.2.2 Synthesis of La-doped TiO2
La-modified TiO2 nanosheets were prepared by a freeze-casting method24–27 using aqueous colloids of peroxo-polytitanic acid (PPTA) and La(NO3)3 (see Scheme 1). In a typical experiment, 4.80 g of titanyl sulfate was dissolved in 150 mL of distilled water at 35 °C (step 1). Then, 0.9 mL of La(NO3)3 solution was added (step 2), yielding a calculated value of 3 wt% of lanthanum to give a colorless solution. This solution was cooled for approximately 1 h in the freezer, and thereafter the precipitation was carried out at ∼0 °C in aqueous ammonia until the pH reached 8 (step 3). The precipitate was filtered and washed several times to remove sulfate anions formed during the reaction. The precipitate as obtained was transferred into a beaker and re-suspended into 350 mL of distilled water. The pH of the resulting suspension was reduced by adding 20 mL of 30% hydrogen peroxide (H2O2), and it was stirred at ambient temperature until the solution turned from turbid yellowish to transparent yellow (step 4). The PPTA solution was added dropwise into Petri dishes immersed in liquid nitrogen (LN2) (step 5). Frozen droplets were immediately freeze-dried at 10 mTorr, at −64 °C for 48 h by using VirTis Benchtop K, Core Palmer UK lyophilizer (step 6). After freeze-casting, a yellowish “granule-like” lyophilized precursor (lyophilized cake) was isolated (step 7).23,25 The lyophilized precursor labeled Ti_La_LYO was further heat-treated under air at 500, 650, 800 and 950 °C for 1 h in each case (with rate 3 °C min−1), and four new samples denoted as Ti_La_500, Ti_La_650, Ti_La_800 and Ti_La_950 were obtained (Scheme 1).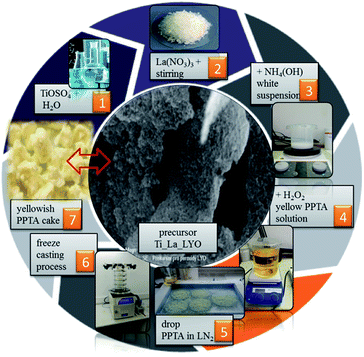 | ||
| Scheme 1 Synthetic route for the preparation of [La(III)-peroxo-polytitanic Ti(IV)] precursor Ti_La_LYO. | ||
2.3 Characterization methods
X-ray powder diffraction patterns were collected using a PANalytical X'Pert PRO diffractometer equipped with a conventional X-ray tube (CuKα 40 kV, 30 mA, line focus) in transmission mode. An elliptic focusing mirror, a divergence slit 0.5°, an anti-scatter slit 0.5° and a Soller slit of 0.02 rad were used in the primary beam. A fast-linear position sensitive detector PIXcel with an anti-scatter shield and a Soller slit of 0.02 rad were used in the diffracted beam. Four XRD patterns were collected for each sample, in 2 theta range of 18–88° with step of 0.013° and 100 s per step dwelling time. Qualitative analysis of the XRD data was performed with the HighScorePlus software package (PANalytical, the Netherlands, version 3.0e), the DiffracPlus software package (Bruker AXS, Germany, version 8.0) and the JCPDS PDF database (JCPDS 2015).28 For quantitative phase analysis we used GSAS-II.29 This program permits to estimate the weight fractions of crystalline phases by means of the Rietveld refinement method. The estimation of the size of crystallites was performed on the basis of the Scherrer formula,30 as implemented within the GSAS-II software, using all XRD reflections for each of the 4 patterns per specimen. For crystallite size evaluation, the machine broadening was estimated by analysis of NIST SRM 660a (LaB6). Additionally, we applied electron crystallography via CrystalMaker™ 10.2 software31 in order to investigate the crystal structure and point defects of nanoscale particles that cannot be studied by X-ray powder diffraction analysis. The morphology of the powdered samples placed on a carbon tape was investigated using Philips XL30CP scanning electron microscope (SEM). The measurements were carried out in a low vacuum mode (with secondary electrons detector) at accelerating voltage of 30 kV. The samples were observed without any coating in order to study their original texture. Transmission electron microscopy (TEM) was carried out on a JEOL JEM 3010 microscope operated at 300 kV (LaB6 cathode, point resolution 1.7 Å) and equipped with an EDS spectrometer. The images were recorded on a Gatan CCD camera with resolution of 1024 × 1024 pixels. Digital Micrograph and INCA software packages were used for structural and chemical analyses, respectively. Electron diffraction patterns were evaluated using the Process Diffraction program.32 X-ray photoelectron spectra (XPS) were measured by Kratos ESCA 3400 furnished with a polychromatic magnesium X-ray source (Mg Kα radiation, energy 1253.4 eV). The base pressure was kept at 5.0 10−7 Pa. The spectra were fitted using a Gaussian–Lorentzian line shape and the Shirley background was subtracted. Survey spectra between 0–1000 eV were collected with incremental step size 0.2 eV and more detailed narrow spectra were taken over Ti 2p, La 3d, La 4d, O 1s and C 1s regions with the incremental steps 0.05 eV. The spectra were collected at constant pass energy 25 eV, which corresponds to peak resolution 0.8 eV. The samples were not sputtered before measurements to preserve chemical states of the measured elements. Spectra were calibrated to C 1s line centered at 284.8 eV. Specific surface area was determined by the BET method33 using a Quantachrome Nova 4200E instrument. Nitrogen adsorption was carried out at −196 °C. The pore size (diameter and volume) distributions were evaluated from the nitrogen desorption isotherm using the cylindrical pore model (BJH).34 Before each measurement, the annealed samples were outgassed for approx. 20 h at 200 °C, lyophilized samples were outgassed for approx. 35 h at room temperature (RT). Fourier transform infrared spectroscopy (FTIR) in transmission arrangement was also used for sample characterization. Absorption spectra were acquired using Nicolet Nexus 670 FTIR spectrometer in the region of 400–4000 cm−1. Approximately 1 mg of the sample and 300 mg of potassium bromide were ground in agate mortar. The mixture was pressed into pellet of approx. 10 mm diameter. Raman spectra were collected by a Nicolet Almega XR dispersive spectrometer equipped with Olympus BX-51 microscope. 256 expositions with resolution 2 cm−1 were taken using excitation wavelength 473 nm with energy 5 mW. The formation of hydroxyl radicals was investigated using the spin trapping technique with a Bruker E-540 electron paramagnetic resonance spectrometer (EPR). The stock aqueous suspension of La modified TiO2 (mg mL−1) was carefully homogenized in an ultrasonic bath (1 min) followed by the addition of a spin trap agent (0.2 M DMPO). The final suspensions were immediately transferred into a quartz flat cell (WG 808-Q, Wilmad-LabGlass, USA). The samples were irradiated directly in the EPR resonator at room temperature. A xenon lamp (300 W, Newport, USA) was used as an irradiation source and a Pyrex glass filter (GG 300, Newport, USA) was applied to eliminate radiation wavelengths below 300 nm.2.4 Photocatalytic degradation of 4-CP
The prepared photocatalysts (0.15 g.L−1) were added in an aqueous 4-chlorophenol solution (4-CP, 1.0 × 10⁻⁴ mol L−1). The reactant mixtures were irradiated under identical conditions in a photoreactor equipped with 10 lamps (Sylvania Blacklight 8 watt, λmax = 368 nm, intensity 6.24 mW cm−2). The volume of the reactant mixture was 175 mL. The photocatalytic activity of the samples was monitored by measuring the concentration of 4-CP in water (HPLC, Agilent Technologies 1200 Series, column LiChrospher RP-18, 5 μm, mobile phase mixture of methanol and water, UV/Vis absorption detection) as well as the total organic carbon (TOC-LCPH, Shimadzu). The instrumental method employs the incineration of the sample at 680 °C, resulting in the formation of CO2. Inorganic carbon presented as carbonate is transformed with 0.1% HCl to CO2. Formed CO2 was detected by implementing IR absorption spectroscopy. Water samples (20 mL) were taken periodically at 60, 120, and 240 min and after 29 h (1740 min) of irradiation.The reaction rate of 4-CP reduction was fitted to the pseudo first-order kinetic model:
 | (1) |
3 Results and discussion
3.1 X-ray powder diffraction (XRD)
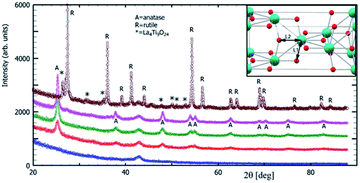
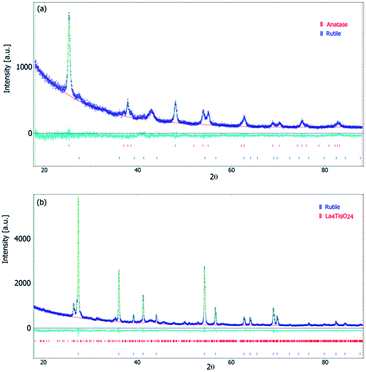
The X-ray powder diffraction analysis and Rietveld refined outputs of XRD patterns were used for characterization of the microstructure and evaluation of the polymorphic anatase–rutile phase transition. The diffraction patterns given in Fig. 1 show the crystallite structure evolution of the freeze-cast (lyophilized) precursor (Ti_La_LYO) and its postsynthesis annealing products (Ti_La_500, Ti_La_650, Ti_La_800, Ti_La_950). The wide reflections at 2θ = ∼33 and ∼43° correspond to Mylar foil, which was used as the sample holder.The raw freeze-cast precursor Ti_La_LYO was identified as a strictly amorphous material (Fig. 1/blue curve). Annealing at 500 °C and 650 °C led to the formation of anatase phase only; the diffraction patterns in Fig. 1/red and green curves respectively correspond to tetragonal anatase (ICDD PDF 21-1272). The wide reflections at the sample Ti_La_500 were attributed mainly to its small crystallite size. At higher temperatures (i.e., 800 °C) reflections became narrower as the crystallites grew from 10(1) nm at 500 °C to 23(0) nm at 800 °C (Table 1). The volume of the anatase lattice grew from 135.96 Å3 at 500 °C to 136.09 and 136.18 Å3 after annealing at 650 and 800 °C, respectively (Table 2). Fig. 1/purple curve and Fig. 2a show the XRD pattern of sample Ti_La_800. It is evident that Ti_La_800 already contains a small fraction (7(1) wt%) of the rutile phase (ICDD PDF 21-1276).
| Sample | Phase composition | Anatase [wt%] | Rutile [wt%] | La4Ti9O24 [wt%] | Anatase crystallite size [nm] | Rutile crystallite size [nm] | La4Ti9O24 crystallite size [nm] |
|---|---|---|---|---|---|---|---|
| a *A = anatase, **R = rutile, ***LTO = La4Ti9O24. | |||||||
| Ti_La_LYO | — | 0 | 0 | 0 | — | — | — |
| Ti_La_500 | A* | 100 | 0 | 0 | 10(1) | — | — |
| Ti_La_650 | A | 100 | 0 | 0 | 15(1) | — | — |
| Ti_La_800 | A + R | 93(1) | 7(1) | 0 | 23(0) | 19(3) | — |
| Ti_La_950 | R** + LTO*** | 0 | 86(1) | 14(1) | — | 88(2) | 66(5) |
| TiO2_P25 | A + R | 96.6 | 3.4 | 21.1 | 42.5 | ||
| Sample | Anatase lattice parameters [Å] | Bond lengths [Å] | Lattice volume [Å3] | Rutile lattice parameters [Å] | La4Ti9O24 lattice parameters [Å] | ||||
|---|---|---|---|---|---|---|---|---|---|
| a | c | a | c | a | b | c | |||
| Ti_La_LYO | — | — | — | — | — | — | — | — | — |
| Ti_La_500 | 3.7890(1) | 9.4700(2) | L1/1.9499 | 135.96 | — | — | — | — | — |
| L2/1.9062 | |||||||||
| Ti_La_650 | 3.7884(2) | 9.4821(9) | L1/1.9402 | 136.09 | — | — | — | — | — |
| L2/1.9506 | |||||||||
| Ti_La_800 | 3.7858(2) | 9.5019(5) | L1/1.9365 | 136.18 | 4.5880(2) | 2.959(2) | — | — | — |
| L2/1.9669 | |||||||||
| Ti_La_950 | — | — | — | — | 4.5955(1) | 2.9603(1) | 14.147(1) | 14.589(1) | 35.511(3) |
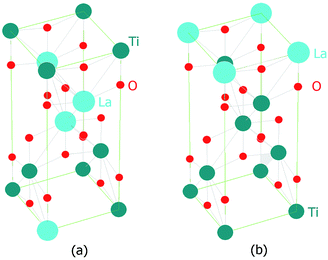
Analysis of sample Ti_La_950 (Fig. 1/brown curve and Fig. 2b) shows that it contains mostly the rutile phase (86 wt%), but extra reflections belonging to La4Ti9O24 oxide (ICDD PDF 36-0137) were also identified. The results in Table 1 established that the La cation stabilized the tetragonal anatase phase at temperatures up to 800 °C. Our results agree with previous observations.41,42 According to the XRD data, the anatase crystallite size of the nonmodified 2D TiO2 nanosheets prepared by the same synthetic route27 increased from 26.1 nm to 101 nm while annealing from 500 to 800 °C, respectively. In this work, we report an increase in average crystallite size from 10(1) to 23(0) nm within the same temperature range (see Table 1), confirming that La cation inhibited grain growth as was also reported by Li et al.42 The decrease in particle size compared to nonmodified 2D TiO2 materials could be due to the segregation of La3+ at the grain boundaries that could hamper grain growth by restricting direct contact between adjacent TiO2 grains.43 Table 2 shows calculated lattice parameters, bond lengths and lattice volumes. The results indicated lattice expansion due to the possibility of La3+ cations with larger ionic radius (rLa = 0.1016 nm) to replace Ti4+ ions (rTi = 0.068 nm). We observed a linear decrease in the a-direction that is contrasted by the significant increase in the c-direction. Similar behavior among cell parameters using the La3+ or Nd3+ ion as a dopants has been reported in the literature.44–48 The lack of complete experimental research about the local environmental coordination of the La3+ in the host TiO2 lattice is one of the sources that resulted in many contradictory statements concerning substitutional vs. interstitial position of La cation. Many researchers believed that it was difficult for La cation to replace Ti ion in the lattice of anatase because of the mismatch49 of the ionic radii. However, the ionic radius of La cation is still smaller than the ionic radius of oxygen (rO2 = 0.132 nm), and addition of La cation may change the octahedral array in the anatase lattice. Our results from the Rietveld refinement revealed that the properties of 2D TiO2 nanosheets modified with 3 wt% La could be dictated by the specific synthetic conditions, shedding light on observed microstructural variations. In previous research, we found that the binuclear adducts were formed by mixing TiOSO4 as the source of Ti4+ and H2O2 (Scheme 1).25,27 These adducts contain the planar Ti–O–O–Ti grouping where the Ti atoms are bridged by μ-oxygen and two μ-peroxy groups (Fig. 3a). We believe that the special stability of Ti2O5 units might be due to the planar structure of two five-membered rings50 that are predicted to be free of strain (Fig. 3a).
The replacement of Ti4+ with La3+ in the binuclear peroxo-titanium adduct can lead to six fold coordination (with the same coordination number of 6 for both La3+ and Ti4+) completed by linking of La3+ to O2− ions in LaO6 octahedrons (Fig. 3b). Even with six identical ligands, LaO6 octahedrons could be highly deformed due to the larger ionic radius and the different distribution of the electrons of the La3+. Additionally, it was proved that insertion of lanthanides altered the –O–Ti–O–Ti– atom arrangement by decreasing of the nonbridging oxygen (O2−) during the phase transition from amorphous to polycrystalline anatase.51 We found that the lengths of the axial Ti–O(L2) and equatorial Ti–O(L1) bonds increase by 0.5–0.8% compared to their counterparts in the pure anatase (TiO2) host structure.52 The Ti–O(L2) bond length increased its value up to 0.0061 nm, and the Ti–O(L1) bond length decreased its value up to 0.00013 nm (Fig. 1/inset and Table 2). Therefore, the generation of LaO6 octahedron and the annealing process may cause structural deformations that adjust/alter chemical bond lengths in the TiO2 unit cell.47
Substitution of La3+ cation into the Ti4+ site in the anatase TiO2 structure led to the formation of an oxygen vacancy:
 | (2) |
 , and
, and  are the La3+ cation sitting on the Ti-lattice site and the oxygen vacancy
 , gives rise to high oxygen-ion mobility Oox.
The imbalance in the charge created by La can also be compensated for:
 | (3) |
 is a Ti cation vacancy at Ti site.
Sample Ti_La_950 shows large growth of 88(2) nm rutile nanocrystals NCs, which was more than four times bigger than the growth of anatase in the sample Ti_La_800. These results agree with Edelson54 and Parker,55 who proved that rutile can form particles of a much larger size than anatase due to the energy released during the polymorphic transition of metastable anatase to stable rutile TiO2 phase. This energy is used for the sintering and faster growth of rutile NCs. The lattice parameters in the case of rutile phase (sample Ti_La_950) were not changed. Therefore, we can conclude that probably rutile cannot accommodate La3+ in its structure.
3.2 Morphology and microstructure of La-modified 2D TiO2 nanosheets
Recently, we have published more insights regarding the capability of the freeze-casting procedure to produce TiO2 nanomaterial with a layered structure.24–27 Modification of the PPTA precursor by adding a noble metal (Ag and Au) or lanthanide element (Nd) does not change titania morphology and leads to a porous 2D TiO2 structure identical to the structure of nonmodified TiO2 samples.56 SEM studies of the La-modified 2D TiO2 nanosheets (i.e., Ti_La_500, Ti_La_650, Ti_La_800 and Ti_La_950) are in line with our previously published results. The morphology of the non-annealed precursor (Ti_La_LYO) is presented in Fig. 4a and b. We observed that the precursor obtained was predominantly amorphous in nature, since we could not recognize any grains with distinguishable shape and size (red dashed area in Fig. 4b). The result correlates well with the XRD pattern of Ti_La_LYO (see Fig. 1, blue curve). The amorphous state changed after heat treatment (Fig. 4c and d) and the joined crystalline lamellae, which is identifiable by shape and size, can be observed at temperatures up to 800 °C (Fig. 4e). Such lamellar morphology is a result of the controlled nucleation during the freeze-casting process, which can affect the phase morphology and stability.57 The crystallization takes place only in the 2D direction, and the lamellar structure (2D nanosheets) with different degrees of crystallinity is preserved. At 950 °C, the 2D nanosheet morphology partly collapsed since the anatase–rutile transformation took place (Fig. 4f).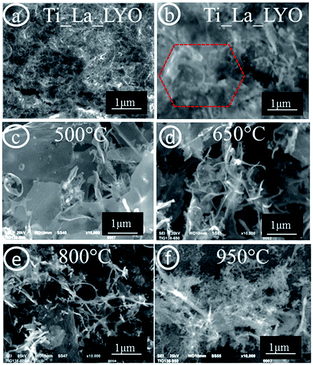 | ||
| Fig. 4 SEM micrographs of: (a and b) Ti_La_LYO precursor and its post-annealed products, (c) Ti_La_500, (d) Ti_La_650, (e) Ti_La_800, and (f) Ti_La_950. | ||
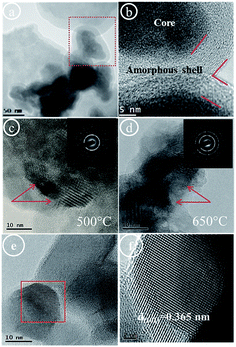
High resolution transmission electron microscopy (HRTEM) was used to study surface morphology, grain size distribution and lattice changes of samples Ti_La_500, Ti_La_650, Ti_La_800 and Ti_La_950. The TEM image of the Ti_La_LYO precursor taken at low magnification (Fig. 5a) shows high contrast, thus depicting a material with layered morphology. A high resolution TEM image (taken from the red marked area in Fig. 5a), is shown in Fig. 5b and reveals the evolution of a “core–shell” structure that could be described as a small (Ti–La) bi-nuclear core (Fig. S1a–c†) enveloped in a thin amorphous shell with the thickness of approximately 10 nm. Detailed STEM analysis and elemental mapping deduced that the surface of as-formed bi-nuclear (Ti–La) core is modified by the presence of surface hydroxide and peroxo groups (Fig. S1d and e†). Therefore, we can conclude that as-observed unique amorphous shell is consisting of a great quantity of (–OH) and (–OOH) groups. The effect of freeze-cast process on morphology of Ti_La_LYO precursor was described in ESI (Fig. S1† and eqn (2) and (3)).
These results reveal that small amount of La (∼3 wt%) can play an important role as a nucleation agent by probably promoting the crystallization of TiO2 as well as stabilizing covalent crosslinks in La-modified TiO2 nanocrystals rather than in the case of the nonmodified TiO2. The effect of temperature on the structural transformation of the lyophilized Ti_La_LYO precursor was also studied.
The HRTEM micrograph in Fig. 5c shows a high magnification TEM image of material Ti_La_500 obtained by annealing of the precursor at 500 °C. Layers are composed of closely packed NCs. The NCs were well dispersed, with an average size of 10 nm (marked with red arrows) and many different orientations that may exist between various crystallites in one polycrystalline aggregate. As the inset of Fig. 5c shows, the SAED pattern consists of series of concentric rings. The positions of diffraction rings match well with polycrystalline anatase TiO2 (PDF ICDD 21-1272). The same result was also concluded from XRD characterization. Fig. 5d presents HRTEM results for Ti_La_650 material. Individual NCs with irregular shape and evaluated average size of 15 nm (marked with red arrows) were determined. The SAED pattern (inset graph of Fig. 5d) does not change at this temperature, thus confirming polycrystalline anatase TiO2. The high-resolution TEM image of a single NC (taken from the red boxed area in Fig. 5e) presents lattice fringes, indicating interlayer spacing of d(101) = 0.365 nm, which was found to be larger than the ones in standard TiO2 (ICDD PDF 21-1272). The increase in the (101) interlayer spacing agrees with results derived from XRD analysis (see Table 1) and confirms the substitutional nature of La3+ ions at this temperature.
The HRTEM micrographs in Fig. 6(a and b) show the surface morphology of the sample Ti_La_800. In the micrograph taken at the lowest magnification, we observed a 2D agglomerate with incoherent structure consisting of fine intergrowth NCs with various shapes and sizes (Fig. 6a). The processing of the SAED analysis (Fig. 6b), from the black boxed area in Fig. 6a, reveals electron diffraction spots of anatase TiO2 NCs (ICDD PDF 21-1272), (spots merged in yellow circles) and extra diffraction spots corresponding to hexagonal La2O3, (spots merged in green hexagon with indexed (10![[2 with combining macron]](https://www.rsc.org/images/entities/char_0032_0304.gif) ), (112), (10
), (112), (10![[3 with combining macron]](https://www.rsc.org/images/entities/char_0033_0304.gif) ) and (20
) and (20![[2 with combining macron]](https://www.rsc.org/images/entities/char_0032_0304.gif) ) planes belonging to the crystalline La2O3 with ICDD PDF 40-1279). The HRTEM/SAED results clearly indicate that the small nanosized domains of La2O3 can simultaneously grow along with anatase when annealed at a relatively high temperature (800 °C). Therefore, La3+ ions cannot be truly accommodated within the anatase lattice when the temperature is higher than 650 °C, which resulted in separation of Ti and La oxides.58
) planes belonging to the crystalline La2O3 with ICDD PDF 40-1279). The HRTEM/SAED results clearly indicate that the small nanosized domains of La2O3 can simultaneously grow along with anatase when annealed at a relatively high temperature (800 °C). Therefore, La3+ ions cannot be truly accommodated within the anatase lattice when the temperature is higher than 650 °C, which resulted in separation of Ti and La oxides.58
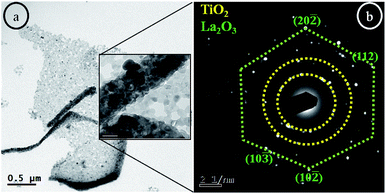 | ||
| Fig. 6 TEM and SAED analysis of sample Ti_La_800: (a) low magnification TEM micrographs, (b) SAED analysis of black boxed area. | ||
3.3 Surface properties of La-modified TiO2 nanosheets
The results of specific surface area (BET) and porosity (BJH) of La-modified 2D TiO2 nanosheets including the precursor Ti_La_LYO and samples annealed at 500, 650, 800 and 950 °C are shown in Table 3.| Sample | BET [m2g−1] | BJH [cm3 g−1] | Average pore size [nm] | Band gap eV | Rate constant k [s−1] |
|---|---|---|---|---|---|
| Ti_La_LYO | 130 | 0.043 | 4.3 | — | — |
| Ti_La_500 | 44 | 0.066 | 4.4 | 3.24 | (1.47 ± 0.13) × 10−5 |
| Ti_La_650 | 57 | 0.052 | 4.4 | 3.19 | (2.67 ± 0.36) × 10−5 |
| Ti_La_800 | 47 | 0.040 | 4.7 | 3.21 | (1.81 ± 0.17) × 10−5 |
| Ti_La_950 | 26 | 0.018 | 4.5 | 3.13 | (1.38 ± 1.63) × 10−7 |
| TiO2_P25 | 50 | — | — | 3.10 | (5.84 ± 0.26) × 10−5 |
The specific surface areas of the pristine sample Ti_La_LYO and the sample annealed at 650 °C are large in comparison to the standard material TiO2-P25. The surface area decreases with the synthesis temperature and reaches a maximum of 57 m2 g−1 at 650 °C. Sample Ti_La_800 has a surface area like the area values obtained for TiO2-P25. The surface area is decreased faster with increasing the temperature to 950 °C. The XRD analysis showed that the Ti_La_650 sample contains polycrystalline TiO2 anatase with average crystallite size of ∼15 nm. The existence of small NCs corresponds well to the high specific area and is responsible for the stabilization of the mesoporous material with main pore radius of 4.4 nm (IUPAC 1972).59 The following annealing up to 800 °C leads to a decrease in the specific surface area and pore volume, but the average pore size still remains in the mesoporous range. This stable mesoporous structure is preserved even at the annealing temperature of 950 °C, where the major phase is rutile. Addition of La improved the stability of pores even at high temperatures and could play an important role by controlling nucleation during the freeze-casting process.60,61
The Fourier transform infrared (FTIR) spectra of La-modified TiO2 samples are shown in Fig. 7. Measurements were carried out in the range of 400–4000 cm−1 (Fig. 7a). All spectra show broad bands between 3000–3800 cm−1. These bands are centered at 3229 cm−1 and at 3417 cm−1, and they are assigned to the stretching vibrations of O–H groups. The band observed at 1625 cm−1 corresponds to the deformation vibration of the adsorbed water. The bands located at 3229 and 1625 cm−1 decrease when the annealing temperature increases due to efficient desorption of surface water. The band at 1399 cm−1 is very intense for the lyophilized precursor (Ti_La_LYO), and it is typical for carbonates formed by naturally occurring CO2 absorbed at the surfaces. During annealing, carbonates decompose, and the corresponding band becomes much weaker. The bands approximately 692 cm−1 and the pronounced peak at 903 cm−1 could be attributed to the vibration modes of peroxo (–O–O–) group vibrations62,63 (Fig. 7b). Both peaks disappeared after annealing due to the decomposition of the peroxo groups. The bands corresponding to O–Ti–O and Ti–O–Ti bonds are usually observed in the 800–400 cm−1 region (Fig. 7b), the former being observed at a higher wavenumber than the latter.64 The lyophilized precursor Ti_La_LYO shows only Ti–O–Ti stretching vibration at 512 cm−1. After heating to 500–800 °C, peroxo groups decompose, nonbinding oxygen is formed, and a broad vibration νTi–O centered at approximately 800 cm−1 appears. The rutile form, prepared in this work at the highest temperature applied (950 °C), shows narrower νTi–O and νTi–O–Ti bands centered at 520 and 720 cm−1, respectively (Fig. 7b). Presence of lanthanum oxide or hydroxide is not clear from the FTIR spectra due to the low atomic concentration of the La. However, La is believed to incorporate into titania even at low temperatures by the formation of Ti–O–La bonds.65
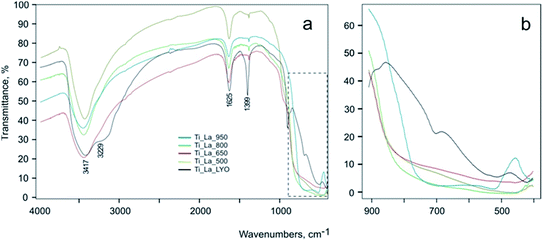 | ||
| Fig. 7 (a) The survey IR spectra of the La-modified TiO2 samples, and (b) the detailed spectra of the 400–900 cm−1 region. | ||
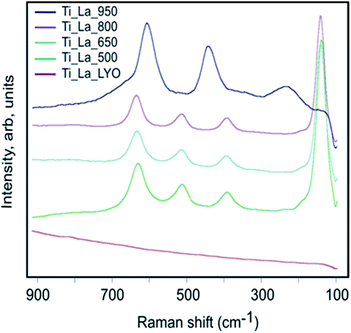
Raman characterization is in line with the XRD and the TEM observations and confirmed again that the precursor Ti_La_LYO is completely amorphous (Fig. 8). After annealing at 500–800 °C, the anatase TiO2 form in the samples is shown by typical bands centered between 142 and 639 cm−1. The FWHM of the Eg band centered at approximately 142 cm−1 is dependent on the size of the crystallites, and this parameter is 29, 25 and 24 cm−1 for the Ti_La_500, Ti_La_650 and Ti_La_800 samples, respectively, which confirms the increased crystallite size of samples annealed at elevated temperatures. At the highest temperature (950 °C) studied, the spectrum shows the presence of rutile (609 cm−1/A1g, 446 cm−1/Eg for rutile) as the single crystalline form of TiO2 in accordance with XRD results (see Table 1). The anatase form is not present, not even in traces, due to the much stronger cross-section of the anatase compared to the rutile form at excitation by a visible laser beam. Similar samples of nonmodified TiO2 that are prepared by a similar procedure afford the formation of anatase-rutile mixtures forms even at 950 °C.
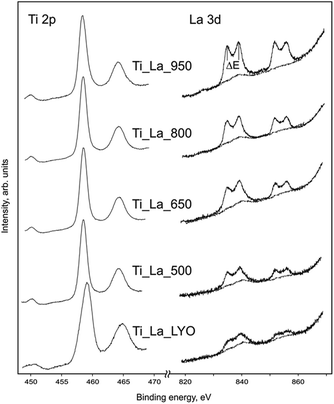
XPS characterization was employed to determine the composition and the chemical state of surface constituents at the surface region (∼5 nm) for the La-modified 2D TiO2 nanosheets. The Ti 2p region shows that all samples are formed by Ti(IV+) state.66 Due to the amorphous character of the lyophilized precursor (Ti_La_LYO), the band Ti 2p3/2 is broader with FWHM at approximately 2.05 eV, while annealed samples became narrower because of the crystallization of titanium dioxide (see Fig. 9 and Table 4).
| Sample | Ti 2p3/2 FWHM eV | ΔE/La 3d5/2 eV | Composition TixLay |
|---|---|---|---|
| Ti_La_LYO | 2.1 | 4.1 | Ti1.00La0.07 |
| Ti_La_500 | 1.4 | 4.2 | Ti1.00La0.10 |
| Ti_La_650 | 1.3 | 4.1 | Ti1.00La0.13 |
| Ti_La_800 | 1.3 | 4.1 | Ti1.00La0.17 |
| Ti_La_950 | 1.5 | 3.8 | Ti1.00La0.26 |
Lanthanum was measured in the 3d (820–870 eV) and 4d (85–115 eV) regions. This element has very well separated 3d spin–orbit components with further splitting. A magnitude of the multiple splitting (ΔE) was used for chemical state diagnosis of the lanthanum (Table 4). In the amorphous sample (Ti_La_LYO) and the samples annealed at 500–800 °C, the ΔE values fluctuate in the range of 4.1–4.2 eV, which indicates that lanthanum is predominantly in the form of hydroxide, while the rutile sample (Ti_La_950) with ΔE = 3.8 eV contains mainly La2(CO3)2. Elemental ratio of titanium/lanthanum was analyzed through Ti 2p/La 3d band areas and Ti 2p/La 4d band areas, and average TixLay ratios were calculated (Table 4) using the characteristic response factors (7.9 for Ti 2p and 44.7 for La 3d bands). The areas were obtained after Shirley background subtraction. In the case of La 3d5/2 bands, Ti LMMa overlapping was also subtracted to obtain the representative lanthanum concentrations. The compositions prove variations in lanthanum concentration with heat treatment, indicating very high La cation mobility with increasing temperature (as measured by an energy-dispersive X-ray microanalysis method (EDS), which is discussed in Section 3.3.1).
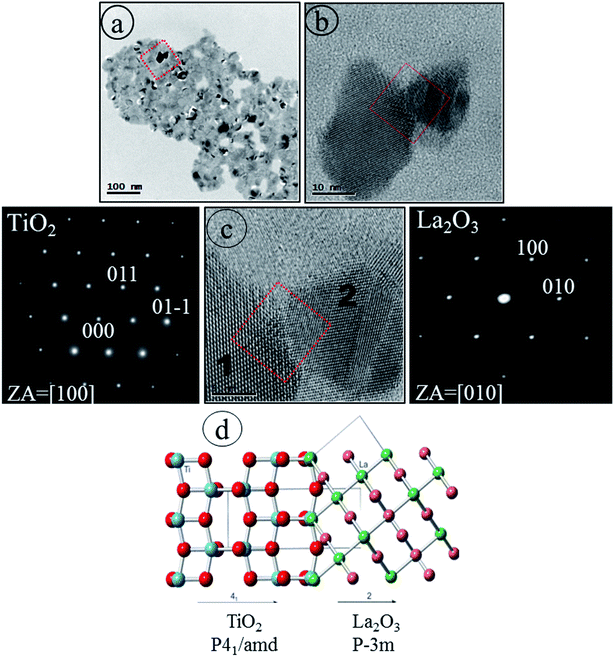
 vacancy pair.69 The migration of La3+ to the surface may be influenced by concomitant rearrangement of the Ti and oxygen atoms, since at this temperature, phase transition from anatase to rutile takes place (Table 1) and La2O3 in the form of an uppermost surface layer could be spontaneously separated. Our HRTEM/SAED and XPS results strongly support this hypothesis. The atomic scale observation of the interfacial structure (Fig. 10d) was fitted and visualized by CrystalMaker™ 10.2 software31 based on the high resolution HRTEM image taken from the red boxed area in Fig. 10c. Two separate crystal lattice images indicate two single crystals belonging to TiO2 (NC #1 from Fig. 10c) with [100] growth direction and La2O3 (NC #2 from Fig. 10c) with [010] growth direction. The charge imbalance and the formation of a Ti–O–La bond70 may be predicted. Additionally, the La3+ ions could have a stabilizing effect on the Ti–O bond67 because the more electropositive La3+ will drive its electronic density toward O2− so that it can use this increased concentration of electrons to strengthen the bonding between the less electropositive Ti4+ ions. Our results confirm that electron crystallography via using electron diffraction patterns could provide an original way to solve the crystal structure and point defects in NCs that cannot be studied by XRD analysis.
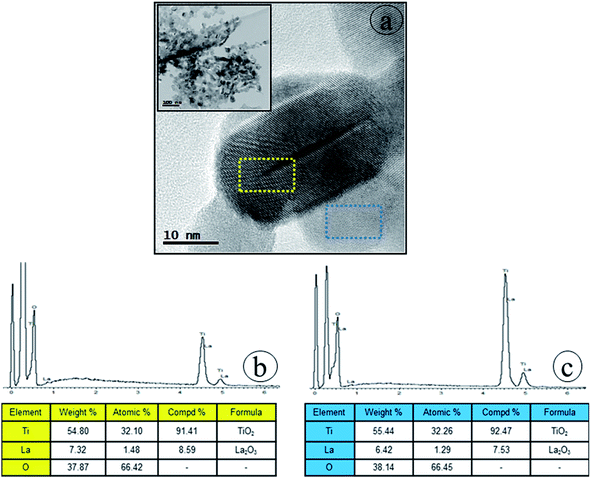
To confirm that new nanoscale regions are generated, detailed HRTEM observations and EDS were conducted to localize the element lanthanum in the Ti_La_800 sample. Distinct NCs are well observable in the high resolution TEM image (Fig. 11a) taken from the selected region (see the inset in Fig. 11a). Even the EDS analysis shows the presence of O, Ti and La, the change of interface stoichiometry has then been detected. The EDS analysis (see Fig. 11b) reveals that La concentrations (7.32 wt%) is higher at the uppermost surface region (yellow boxed area in Fig. 11a) in comparison with La concentrations (6.42 wt%) in the surface near this region (blue boxed area in Fig. 11a), indicating that the La enriched the uppermost surface region when the temperature was increased to 800 °C. Our HRTEM observations are in line with previous TEM studies of Kato et al.,71 who showed that higher concentration of La at the edges and surface grooves was possibly responsible for the darker TEM contrast (see Fig. 10a).
3.4 Photocatalytic decomposition of 4-CP
HPLC and TOC measurements have been applied for better understanding the photocatalytic performance of the as-prepared La-modified 2D TiO2 materials (photocatalysts). The results are shown in Fig. 12, where we observed that the highest 4-CP removal is obtained in the presence of Ti_La_650 followed by Ti_La_800, Ti_La_500 and Ti_La_950 photocatalysts. The degradation curves of 4-CP (Fig. S3†) under UV irradiation light showed similar results.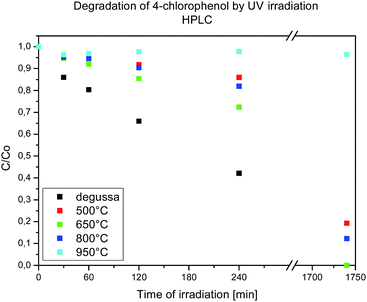 | ||
| Fig. 12 Photocatalytic degradation of 4-CP in the presence of Ti_La_500, Ti_La_650, Ti_La_800, Ti_La_950 and TiO2-P25 catalysts. | ||
The calculated degradation rate constants k (s−1) and band gap energies (Eg) are shown in Table 3. The obtained (Eg) values (Fig. S6†) are correlated with UV-Vis analysis (Fig. S4†) and Kubelka–Munk function (Fig. S5†).
For materials Ti_La_650 and Ti_La_800, the Eg value was below the reference anatase sample (Eg = 3.24 eV) and non-modified 2D TiO2 nanosheets obtained by the same method.27 The best performance in 4-CP photocatalytic decomposition was achieved with Ti_La_650 material that has the lowest Eg and related redshift of the optical absorption. The higher photocatalytic efficiency of the Ti_La_650 catalyst can be explained by substitutional incorporation of La3+ into the anatase lattice, which has a clear positive effect on the photocatalytic activity under UV light irradiation. At this temperature, La3+ stabilized the anatase structure, decreased the size of the crystallites, increased surface area and exhibited distribution of pores predominantly in the mesoporous range (Table 1). We could accept that mesoporous Ti_La_650 material with a large surface area is the best photocatalyst, since a larger surface area offers more active adsorption sites. Further annealing at 800 °C leads to a decrease in the photocatalytic efficiency under UV light of Ti_La_800 material. The differences in the surface area and particle shape affect the redistribution of the La3+ on the Ti_La_800 material resulting in its lower photoefficiency. Annealing at the temperature of 950 °C resulted in a full conversion from anatase to rutile and a change in all microstructural characteristics and photocatalytic activity.
Mineralization of contaminants into the natural environment (for instance, 4-CP in wastewater) is very important for practical applications. Herein, we used the TOC removal as an inexpensive test to evaluate the La-modified 2D TiO2 materials. The TOC removal with the time is illustrated in Fig. 13.
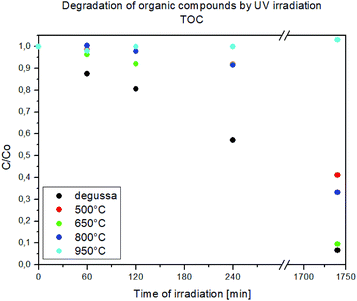 | ||
| Fig. 13 TOC removal during the photocatalytic treatment of 4-CP in the presence of Ti_La_500, Ti_La_650, Ti_La_800, Ti_La_950 and TiO2-P25 catalysts. | ||
The mineralization of 4-CP in the presence of Ti_La_500, Ti_La_650, Ti_La_800 and Ti_La_950 photocatalysts is fast in the first 120 min of treatment but decreases thereafter. The highest TOC removal was achieved in the presence of Ti_La_650 with complete mineralization (100% TOC removal) taking place after 30 h of photocatalytic treatment. Mineralization of 4-CP over Ti_La_650 photocatalyst can be connected to the suppression of the electron–hole recombination by La3+ in the TiO2 lattice and the creation of HO˙ radicals by oxidation of holes. HO˙ radicals could be the primary oxidizing species which breaks down 4-CP into a variety of intermediate products on the route to total mineralization to carbon dioxide.72 As outlined above, the Ti_La_650 photocatalyst was found to be more efficient than other La-modified 2D TiO2 photocatalysts in terms of 4-CP removal. La-modified 2D TiO2 nanosheets obtained after annealing at 800, 500 and 950 °C required longer irradiation times for the complete mineralization of 4-CP. The main reason for such behavior could be that the formation of intermediates detected in the 4-CP oxidation pathway were ring compounds (hydroquinone, catechol, benzoquinone) breaking down to yield CO2, and their next competition with separated La2O3 for active centers on the catalyst surface.70 The formation of hydroxyl radical spin adducts by EPR spectroscopy (with DMPO)73 was also employed to probe the nature of the reactive oxygen species generated on the surface of Ti_La_650 photocatalyst. As depicted in Fig. 14a, four characteristic peaks of DMPO-·OH were observed, and their intensities increased with irradiation time (Fig. 14b).
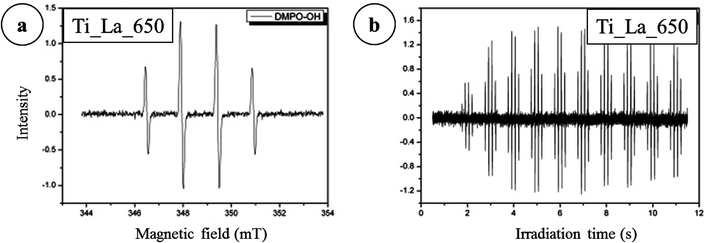 | ||
| Fig. 14 EPR signal of the DMPO–HO˙ adducts in (a) the suspensions of sample Ti_La_650 (b) number of spectra after irradiation. | ||
Results demonstrate that the Ti_La_650 catalyst shows a high production of hydroxyl radicals that greatly contribute to the degradation of 4-CP. This indicates that the HO˙ are generated on the surface of Ti_La_650, and the illuminated photocatalyst provides a strong indication that this material can be efficiently excited by UV light to create mobile charge carriers (e−/hole+ pairs) and that the charge separation is maintained long enough to react with adsorbed H2O and produce a series of active HO˙ radicals that finally induce the decomposition of 4-CP.74
In addition, an experiment was performed in the presence of the TiO2-P25 photocatalyst, under the same operating conditions, to establish a comparison against commercially available standard photocatalysts. Our results show that with TiO2-P25, the decrease in 4-CP concentration was faster and the reduction rate of TOC was higher than with Ti_La_500, Ti_La_650, or Ti_La_800. The greater photoeffectiveness of the TiO2-P25 could be due to various factors. TiO2-P25 is known to be a mixture containing more than 80% anatase with a minor amount of rutile and a small amount of amorphous phase.75 In spite of several presumptions such as synergistic effect, tightly interwoven structures of anatase and rutile NPs76 or aggregation of particles by interparticle dehydration,73 we can suggest that the higher activity of TiO2-P25 in the degradation of 4-CP could be attributed to the active role of rutile NCs which can act as an electron sink hindering recombination in anatase NCs.77
Based on calculated (Eg) of the Ti_La_500, Ti_La_650, Ti_La_800 and Ti_La_950 samples, only the TiLa_950 material was tested as a photocatalyst using a simulated solar light (lamp Oriel LCS-100 simulated solar light). Due to presence of light in the UV region and higher intensity of the mercury lamp, the high photocatalytic activity is observed, showing complete degradation of the model compound (4-CP). HPLC analysis (Fig. S7†) was applied for better understanding the photocatalytic performance of sample Ti_La_950. The observed rate constant k (s−1) = 6.621 × 10⁻⁵, demonstrated that the decrease in 4-CP concentration was faster and the reduction rate was higher than with Ti_La_500, Ti_La_650, or Ti_La_800 and even the TiO2-P25. Our results show that the increase of temperature up to 950 °C and La doping resulted in structural transition from anatase to 86 wt% rutile TiO2 and separation of a La4Ti9O24 (14 wt%) (see Table 1). The La4Ti9O24 consists of a complex network of octahedrally-coordinated titanium sharing corners and edges with each other and linked by two six coordinated and one eight coordinated lanthanum atom. The distortions of the TiO6 coordination polyhedra in La4Ti9O24 have been found to show some similarities to those seen in other titanate materials, even the orthorhombic crystal system of La4Ti9O24 with lattice parameters a = 14.1458 Å, b = 35.5267 Å and c = 14.5794 Å. The most common representation between rutile TiO2 and La4Ti9O24 in the view of the electronic and optical properties could be the networks of [TiO6] octahedron building blocks78 One can see that the crystallite domain size that can be achieved by La-modified 2D TiO2 nanosheets, even after annealing up to 950 °C is still up to nanoscale range – 100 nm (see Table 1), assuming that the intermolecular charge hopping across grain boundaries could be very efficient. The improvement in charge carrier mobility could be due to the improved control of crystallization guaranteed charge hopping through ordered Ti1–xLaxO2−δ domains (McCulloch et al., 2006) in all annealed samples (Ti_La_500, Ti_La_650, Ti_La_800 and Ti_La_950).79
3.5 The effect of La3+ on the evolution of complex microstructure
As was demonstrated by XRD and Raman characterization, the bulk structure of La-modified 2D TiO2 nanosheets consists of anatase structure up to 650 °C (Ti_La_650 sample). Surface analysis by XPS and HRTEM/SEAD/EDS reveals that the uppermost La2O3 surface layer is spontaneously separated at 800 °C (Ti_La_800 sample). Based on these findings, two models that led to the discovery of La3+ cation as a promoter of the reaction kinetic and the micro-texture of 2D TiO2 nanosheets (photocatalysts) can be suggested. may be trapped at the interfaces, but most of them can pile up along the surface to cause faster kinetic reaction, i.e., 4-CP degradation. The extracted values of rate constants for non-La-modified 2D TiO2 nanosheets27 could suggest that anatase NCs smaller than ∼15 nm exhibit faster charge transfer kinetics. The oxidation and reduction reactions on La-modified 2D TiO2 nanosheets appear to be selective, which extends their benefit.
As the annealing temperature was increased to 800 °C, two parallel-competitive reactions were starting: transition from metastable anatase to stable rutile and redistribution/escape of La3+ through the anatase lattice (Ti_La_800 sample). We observed significant variations in lattice parameters relative to the geometry and volume of the unit cells (Table 2) as well as changes in surface chemical composition (Table 4). We may suggest that is thermodynamically disfavored for rutile with smaller unit cell volume and higher density to accommodate La3+ with a larger ionic radius. As the temperature increases, La3+ cannot maintain the stable [LaO6] octahedral unit cell geometry, and it migrates towards the surface and forms the uppermost La2O3 layer (Fig. 15b). The Ti_La_800 material shows a wider band gap than Ti_La_650 and demonstrates a decay rate constant of 4-CP degradation. After La resides, a new Ti1−xLaxO2−δ heterostructure with different bond lengths could be created, suggesting generation of partial occupied or unoccupied states in the band gap that would facilitate the formation of recombination centers.83 Therefore, different conditions for transfer of electrons from the valence band to the conduction band could be achieved, leading to different photocatalytic performance of Ti_La_650 and Ti_La_800 photocatalysts.
4 Conclusions
In this work, a freeze-casting method was developed by using PPTA as precursor to prepare La-modified 2D TiO2 nanosheets. The surface and bulk properties of La modified 2D TiO2 nanosheets obtained by annealing from 500 to 950 °C were investigated via surface (XPS, HRTEM) and bulk (XRD, Raman, UV-Vis) experimental techniques. Lattice distortions induced by replacement of Ti4+ with La3+ was observed at 650 °C. At higher temperatures, the diffusion mechanism led to the escape of La3+ from the anatase lattice, and the uppermost La2O3 surface layer was spontaneously separated. La3+ ion acted as a structural promoter, which stabilized smaller anatase TiO2 NCs (from 10 to 23 nm) and increased the BET surface area (up to 57 m2 g−1). La3+ cation could be regarded as a potential electronic promoter that can reduce the band gap of 2D TiO2 nanosheets and that can provide a signature of the electron transfer and carrier charge separation. The photocatalytic activity was determined by measuring the kinetics of degradation of 4-CP and TOC. Both methods provided similar results, establishing that the activity increased in the order 950 °C < 500 °C < 800 °C < 650 °C < TiO2-P25 under UV light irradiation. Ti_La_950 material made from rutile and La4Ti9O24 could be a promising candidate for a use as an efficient photocatalyst in degradation of 4-CP under simulated solar light.Conflicts of interest
There are no conflicts to declare.Acknowledgements
This research is supported by the Czech Science Foundation (project No. 18-15613S). The authors acknowledge the Research Infrastructure NanoEnviCz, supported by the Ministry of Education, Youth and Sports of the Czech Republic under Project No. LM2015073. The authors gratefully acknowledge Prof. Rosica P. Nikolova (IMC BAS), Jitka Bezdickova, Petr Bezdicka, Jakub Tolasz (IIC ASCR) and Lorant Szatmary (UJV REZ) for their helpful and instructive discussions focused on integrated nanocrystal stuctures, FTIR, XRD and EPR results. Dr S. Bakardjieva acknowledges the moral courage and great technical assistance rendered by Violeta Bakardjieva-Mihaylova and Marina Bakardjieva (PhD students from the Department of Paediatric Haematolopgy and Oncology, 2nd Faculty of Medicine at Charles University in Prague and Motol University Hospital). The authors gratefully acknowledge both reviewers for their very constructive recommendations.References
- M. Pera-Titus, V. G. Molina and M. A. Baños, et al., Appl. Catal., B, 2004, 47, 219–256 CrossRef CAS.
- S. W. Verbruggen, J. Photochem. Photobiol., C, 2015, 24, 64–82 CrossRef CAS.
- K. T. Ranjit, I. Willner, S. H. Bossmann and A. M. Braun, J. Catal., 2001, 204, 305–313 CrossRef CAS.
- Y. Jiang, H. Ning, Ch. Tian, B. J. Jiang, Q. Li, H. Yan, X. Zhang, J. Wang, L. Jing and H. Fu, Appl. Catal., B, 2018, 229, 1–7 CrossRef CAS.
- S. Hu, S. Hu, P. Qiao, L. Zhang, B. J. Jiang, Y. Gao, F. Hou, B. Wu, Q. Li, Y. Jiang, Ch. Tian, W. Zhou, G. Tian and H. Fu, Appl. Catal., B, 2018, 239, 317–323 CrossRef CAS.
- United Nation's, Globally System of Classification and Labeling of Chemicals, UN, New York and Geneva, 4th edn, 2011, ISBN no. 978-92-1-117042-9 Search PubMed.
- S. In, A. Orlov, F. Garcia, M. Tikhov, D. S. Wright and R. M. Lambert, Chem. Commun., 2006, 40, 4236–4238 RSC.
- J. Lukáč, et al., Appl. Catal., B, 2007, 74, 83–91 CrossRef.
- A. Kudo, H. Kato and I. Tsuji, Chem. Lett., 2004, 33, 1534–1539 CrossRef CAS.
- H. C. Liu, H. Wang, J. H. Shen, Y. Sun and Z. M. Liu, Catal. Today, 2008, 131, 444–449 CrossRef CAS.
- A. F. Cunha, N. Mahata, J. M. Orfao and J. L. Figueiredo, Energy Fuels, 2009, 23, 4047–4050 CrossRef CAS.
- R. Kam, C. Selomulya, R. Amal and J. Scott, J. Catal., 2010, 273(1), 73–81, DOI:10.1016/j.jcat.2010.05.004.
- J. Ng, N. Sugii, K. Kakushima, P. Ahmet, K. Tsutsui, T. Hattori and H. Iwai, IEICE Electronic Express, 2006, 3, 316–321 CrossRef.
- J. Liquang, S. Xiaojun, X. Baifu, W. Baiqi, C. Weimin and F. Honggang, J. Solid State Chem., 2004, 177, 3375–3382 CrossRef.
- R. T. Ako, P. Ekanayake, A. L. Tan and D. J. Young, Mater. Chem. Phys., 2016, 172, 105–112 CrossRef CAS.
- Y. Liu, S. Zhou, J. Li, Y. Wang, G. Jiang, Zh. Zhao, B. Liu, X. Gong, A. Duan, J. Liu, J. Wei and L. Zhang, Appl. Catal., B, 2005, 168–169, 125–131 CrossRef.
- J. Zhang, Z. Zhao, X. Wang, T. Yu, J. Guan, Zh. Yu, Zh. Li and Z. Zh. Zhigang, J. Phys. Chem. C, 2010, 114, 18396–18400 CrossRef CAS.
- C. B. Carter, and M. G. Norton, Sols, Gels, and Organic Chemistry, in Ceramic Materials, Springer, New York, NY, 2007 Search PubMed.
- C. T. McKee and J. Y. Walz, J. Am. Ceram. Soc., 2009, 92, 916–921 CrossRef CAS.
- S. R. Mukai, H. Nishihara, S. Shichi and H. Tamon, Chem. Mater., 2004, 16(24), 4987–4991 CrossRef CAS.
- M. Borlaf, J. M. Poveda, R. Moreno and M. T. Colomer, J. Sol-Gel Sci. Technol., 2012, 63, 408–415 CrossRef CAS.
- J. Lee and Y. Cheng, J. Controlled Release, 2006, 111, 185–192 CrossRef CAS PubMed.
- S. Yuan, Q. Sheng, J. Zhang, F. Chen, M. Anpo and Q. Zhang, Microporous Mesoporous Mater., 2005, 79, 93–99 CrossRef CAS.
- S. Bakardjieva, J. Subrt, P. Pulisova, M. Marikova and L. Szatmary, Mater. Res. Soc. Symp. Proc., 2011, 1352, 129–134, DOI:10.1557/opl.2011.1132.
- J. Subrt, P. Pulisova, J. Bohacek, P. Bezdicka, E. Plizingrova, L. Volfova and J. Kupcik, Mater. Res. Bull., 2014, 49, 405–412 CrossRef CAS.
- E. Plizingrova, L. Volfova, P. Svora, N. Labhsetwar, M. Klementova, L. Szatmary and J. Subrt, Catal. Today, 2015, 240, 107–113 CrossRef CAS.
- S. Bakardjieva, R. Fajgar, I. Jakubec, E. Koci, A. Zhigunov, E. Chatzisymeon and K. Davididou, Catal. Today, 2019, 328, 189–201 CrossRef CAS.
- JCPDS PDF-4 database, International Centre for Diffraction Data, Newtown Square, PA, USA, release 2015 Search PubMed.
- B. H. Toby and R. B. Von Dreele, J. Appl. Crystallogr., 2013, 46(2), 544–549 CrossRef CAS.
- P. Scherrer, Gottinger Nachrichle, 1918, 2, 98–100 Search PubMed.
- D. C. Palmer, CrystalMaker, CrystalMaker Software, Ltd, Begbroke, Oxfordshire, England, 2014 Search PubMed.
- J. L. Labar, Ultramicroscopy, 2005, 103(3), 237–249 CrossRef CAS PubMed.
- S. Brunauer, P. H. Emmett and E. Teller, J. Am. Chem. Soc., 1938, 60, 309–319 CrossRef CAS.
- E. P. Barrett, L. G. Joyner and P. P. Halenda, J. Am. Chem. Soc., 1951, 73, 373–380 CrossRef CAS.
- J. Peral and D. Ollis, J. Catal., 1992, 136, 554–565 CrossRef.
- H. Al-Ekabi and N. Serpone, Langmuir, 1989, 5, 250–255 CrossRef CAS.
- J. Theurich, M. Lindner and D. W. Bahnemann, Langmuir, 1996, 12, 6368–6376 CrossRef CAS.
- G. Colón, M. C. Hidalgo and J. A. Navío, Appl. Catal., A, 2002, 231, 185–189 CrossRef.
- M. L. Satuf, et al., Appl. Catal., B, 2008, 82, 37–49 CrossRef CAS.
- M. Grätzel, N. Serpone and E. Pelizzetti, Photocatalysis, Fundamentals and Applications, Wiley, New York, 1989 Search PubMed.
- S. Ghosh, A. Vasudevan, P. Rao and K. Warrier, Br. Ceram. Trans., 2001, 100, 151–154 CrossRef CAS.
- K. Li, S. Wei and W. Yang, J. Phys. Chem. Solids, 2011, 72, 643–647 CrossRef CAS.
- X. Z. Ding and X. H. Liu, J. Mater. Res., 1998, 13, 2556–2559 CrossRef CAS.
- S. Sadhu and P. Poddar, RSC Adv., 2013, 3, 10363–10369 RSC.
- Y. Xin and H. Liu, J. Solid State Chem., 2001, 184, 3240–3246 CrossRef.
- B. Trujillo-Navarrete, M. del Pilar Haro-Vásquez, R. M. Félix-Navarro, F. Paraguay Delgado, H. Alvarez-Huerta, S. Pérez-Sicairos and E. A. Reynoso-Soto, J. Rare Earths, 2017, 35, 259–270 CrossRef CAS.
- W. Li, A. I. Frenkel, J. C. Woicik, C. Ni and S. Ismat Shah, Phys. Rev. B Condens. Matter Mater. Phys., 2005, 72, 155315 CrossRef.
- J. Liqiang, S. Xiaojin, X. Baifu, W. Baiqi, C. Weimin and F. Honggang, J. Solid State Chem., 2004, 177(10), 3375–3382 CrossRef.
- D. Schwarzenbach, Inorg. Chem., 1970, 9, 2391–2397 CrossRef CAS.
- Y. B. Xie and C. W. Yuan, Appl. Surf. Sci., 2004, 221, 17–24 CrossRef CAS.
- M. Maleckova, BSc thesis, Charles University, Prague, 2014, https://is.cuni.cz/webapps/zzp/detail/160373/.
- F. A. Kröger and H. J. Vink, Solid State Physics, vol. 3, Academic, New York, 1956 Search PubMed.
- L. Edelson and A. Glaeser, J. Am. Ceram. Soc., 1988, 71, 225–235 CrossRef CAS.
- J. Parker and R. Siegel, J. Mater. Res., 1990, 5, 1246–1252 CrossRef CAS.
- E. Plizingrova E, M. Klementova, P. Bezdicka, J. Bohacek, Z. Barbierikova, D. Dvoranova, M. Mazur, J. Krysa, J. Subrt and V. Brezova, Catal. Today, 2017, 281(1), 165–180 CrossRef.
- A. Gupta, Int. J. Drug Dev. Res., 2012, 4, 35–40 Search PubMed.
- K. Li, S. Wei and W. Yang, J. Phys. Chem. Solids, 2011, 72, 643–647 CrossRef CAS.
- IUPAC, Compendium of Chem. Technol, The Gold Book, ed. A. D. McNaught and A. Wilkinson, 2nd edn, 2006, ISNB 0-9678550-9-8, DOI:10.1351/goldbook.
- R. Gopalan and Y. Lin, Ind. Eng. Chem. Res., 1995, 34, 1189–1195 CrossRef CAS.
- K. Kumar, S. Keizer and A. Burggraaf, J. Mater. Chem., 1993, 3, 917–922 RSC.
- Z. Wang, J. Chen and X. Hu, Mater. Lett., 2000, 43, 87–90 CrossRef CAS.
- M. Ayers and A. Hunt, Mater. Lett., 1998, 34, 290–293 CrossRef CAS.
- A. M. Burgos and M. Langlet, Thin Solid Films, 1999, 349, 19–23 CrossRef.
- S. Yuan, Q. Sheng, J. Zhang, F. Chen, M. Anpo and Q. Zhang, Microporous Mesoporous Mater., 2005, 79, 93–99 CrossRef CAS.
- M. C. Biesinger, L. W. M. Lau, A. R. Gerson and R. S. C. Smart, Appl. Surf. Sci., 2010, 257, 887–898 CrossRef CAS.
- M. Falkowski, Ch. Kunneth, R. Materlik and A. Kersch, npj Comput. Mater., 2018, 73, 1–9 Search PubMed.
- B. Reddy, B. Chowdhury and P. Smirniotis, Appl. Catal., A, 2001, 219, 53–60 CrossRef CAS.
- S. Anandan, Y. Ikuma and V. Murugesan, Int. J. Photoenergy, 2012, 921412, DOI:10.1155/2012/921412.
- S. M. Owen, A Guide to Modern Inorganic Chemistry, Willey, New York, 1991, ISBN 05820643920470216948 Search PubMed.
- H. Kato, K. Asakura and A. Kudo, J. Am. Chem. Soc., 2003, 125, 3082–3089 CrossRef CAS PubMed.
- R. Terzian, N. Serpone and M. A. Fox, J. Photochem. Photobiol., A, 1995, 90(2–3), 125–135 CrossRef CAS.
- S. Anandan, et al., J. Mol. Catal. A: Chem., 2007, 266, 2149–2157 CrossRef.
- D. L. Rabenstein, Anal. Chem., 1971, 43, 1599–1605 CrossRef CAS.
- A. Maldotti, A. Molinari and R. Amadelli, Chem. Rev., 2002, 102, 3811–3820 CrossRef CAS PubMed.
- B. Ohtani, O. O. Prieto-Mahaney, D. Li and R. Abe, J. Photochem. Photobiol., A, 2010, 216, 179–182 CrossRef CAS.
- A. Tiwari and L. Uzun, Advanced Functional Materials, ed. A. Tiwari and L. Uzun, Wiley, 2015 Search PubMed.
- D. C. Hurum, A. G. Agrios, K. A. Gray, T. Rajh and M. C. Thurnauer, J. Phys. Chem. B, 2003, 107, 4545–4549 CrossRef CAS.
- R. Morris, J. Owen and A. Cheetham, J. Phys. Chem. Solids, 1995, 56, 1297–1303 CrossRef CAS.
- I. McCulloch, M. Heeney, C. Bailey, K. Genevicius, I. McDonald, M. Shkunov, D. Sparrowe, S. Tiemey, R. Wagner, W. Zhang, M. L. Chabinyc, R. J. Kline, M. D. McGehee and M. F. Toney, Nat. Mater., 2006, 5, 328–333 CrossRef CAS PubMed.
- Y. Liu, S. Zhou, J. Li, Y. Wang, G. Jiang, Zh. Zhao, B. Liu, X. Gong, A. Duan, J. Liu, J. Wei and L. Zhang, Appl. Catal., B, 2005, 168–169, 125–131 CrossRef.
- N. Rajeswari Yogamalar and A. Chandra Bose, Appl. Phys., 2011, 103, 33–42 Search PubMed.
- C. Wang, R. Pagel, J. K. Dohrmann and D. W. Bahnemann, C. R. Chim., 2006, 9, 761–773 CrossRef CAS.
- Z. Ma, Y. Li, Y. Lv, R. Sa, Q. Li and K. Wu, ACS Appl. Mater. Interfaces, 2018, 10, 39327–39335 CrossRef CAS PubMed.
Footnote |
| † Electronic supplementary information (ESI) available. See DOI: 10.1039/c9ra03940f |
| This journal is © The Royal Society of Chemistry 2019 |

