 Open Access Article
Structure properties and dielectric relaxation of Ca0.1Na0.9Ti0.1Nb0.9O3 ceramic
Hanen Ghoudi *a,
Souad Chkoundalib,
Zeineb Raddaouic and
Abdelhedi Aydib
aLaboratoire de physique des Matériaux et des Nanomatériaux Appliquée à l’environnement, Faculté des Sciences de Gabès, Université de Gabès, Tunisia. E-mail: hanengoudi2@gmail.com
bLaboratoire des Matériaux Multifonctionnels et Applications, Faculté des Sciences de Sfax (FSS), Université de Sfax, B. P.1171, 3018 Sfax, Tunisia
cLaboratoire de la Matière Condensée et des Nanosciences, Faculté des Sciences de Monastir, Université de Monastir, Tunisia
First published on 13th August 2019
Abstract
In this paper, the synthesis of Ca0.1Na0.9Ti0.1Nb0.9O3 (CNTN) ceramic by a solid-state reaction method is reported. The results of Rietveld refinement of X-ray diffraction (XRD) patterns at room temperature showed a pure tetragonal perovskite (P4mm space group). Raman spectroscopy analysis, ranging from of 50 to 1000 cm−1, at room temperature, validates the results of XRD. The dielectric properties was studied by complex impedance spectroscopy examined in broad frequency range, 100 Hz to 200 kHz, at different temperatures. The dielectric permittivity for our CNTN compound confirms the typical relaxor behavior. The investigation of the diffuseness of the transition was conducted by fitting the experimental data with modified Curie–Weiss law; Gaussian distribution and Power law confirm the presence of a short-range association between the polar nanoregions (PNRs). The obtained values of the diffuseness coefficient are of the order 1.6, which corresponds to the diffuse phase transition (DPT) ascribed to the existence of various states of polarization, thus various relaxation times in different regions. The value of diffuseness is of the order 85 and the degree of relaxor (ΔTcm = 65 K) is interesting as far as microelectric applications are concerned. Moreover, based on the frequency dependence of temperature at dielectric maxima using Vogel–Fulcher relationship, a strong evidence for a static freezing temperature with regards to thermally-activated polarization fluctuations was found.
1. Introduction
Oxide materials with perovskite structure, having a general formula ABO3, represent the backbone of the ferroelectric industry. For a long time, ferroelectric ceramics have proved to be useful for various practical applications, such as high dielectric constant capacitors, radio and communication filters, pyroelectric devices, medical diagnostic transducers, ultrasonic motors and electro-optic light valves.1–5 The relaxor ferroelectrics are a class of disordered crystals with peculiar structure and properties.6 The typical dielectric response, for example, has a frequency and temperature dependent diffuse permittivity maximum. However, most of relaxor compounds are complex lead-based perovskites, namely Pb(Mg1/3Nb2/3)O3 (PMN)7 or (Pb, La)·(Zr, Ti)O3 (PLZT).8 In recent years, materials with lead-free compositions have attracted much interest for environment-friendly applications. Promising compounds are BaTiO3 based solid solutions, such as Ba(Ti, Sn)O3,9,10 Ba(Ti, Zr)O3,11 Ba0.8Sr0.2TiO3![[thin space (1/6-em)]](https://www.rsc.org/images/entities/char_2009.gif) 12,13 or BiFeO3.14
12,13 or BiFeO3.14
Thanks to its numerous electric, dielectric and optical properties, calcium titanate (CaTiO3) has been widely investigated.15,16 CaTiO3 with orthorhombic distortions of the perovskite structure was observed from X-ray diffraction by Naray-Szabo.17 It is characterized by paraelectric property at room temperature, dielectric permittivity above 170 and a dissipation factor (D) ∼ 10−3 at 1 kHz.18 Lemanov et al.19 measured the dielectric properties of CaTiO3. They classified this perovskite as a ferroelectric at temperature below 300 K (εr = 330 at 4.2 K).
At room temperature, pure NaNbO3 is an antiferroelectric with an orthorhombic distorted perovskite along with a Pbma space group.20 This compound undergoes several phase transitions. The dielectric behavior of NaNbO3 sample has been widely examined. It displays a phase transition at TC around 913 K with a maxima real permittivity of  1750 at TC.21. Recently, several authors have reported that NaNbO3 becomes ferroelectric with similar behavior related to KNbO3,22 LiNbO3.23
NaNbO3 substituted CaTiO3 reveals suppression of quantum fluctuations, when the concentration of NaNbO3 exceeds 2%.24 SSNNx is a solid solution based on a mixture of NaNbO3 and SrSnO3. It is considered as an advanced ferroelectric ceramic for environment-friendly applications.25
In the mixed system 1–xNaNbO3–xCaTiO3, the dielectric permittivity shows a morphotropic phase boundary ceramics. The well known MPB is nonferroelectric and nonpiezoelectric at room temperature.26
This study was undertaken to study the behavior of the relaxors, the structural and dielectric properties of the mixed oxide system CaTiO3–NaNbO3 (CT–NN). This work is also intended to explore the effects of substitutions in sites A and B on their structural, dielectric and Raman properties. In this regard, the NaNbO3 solid solution was selected as the antiferroelectric material and CaTiO3 was added to investigate the relaxor behavior in a lead-free sample.
Considered as environment-friendly materials, these lead-free compounds could be highly significant regarding the scope of application.
2. Experimental procedure
2.1. Sample preparation
The polycrystalline sample of CNTN was prepared by solid-state reaction using the oxides CaCO3, Na2CO3, Nb2O3 and TiO2, Aldrich with 99.9 of purity, in suitable stoichiometries. The stoichiometrically weighed composition was thoroughly mixed in an agate for 1 h. The powder was then pressed into discs and calcinated at 1373 K for 12 h, to obtain a single phase sample. After calcination, the powder was mixed for 1 h and one part of it was pressed under 100 MPa into discs of an 8 mm diameter and about a 1 mm thickness. Ultimately, the formed pellets were sintered at 1523 K for 3 h with a speed of 200 °C h−1, in an oxygen-rich atmosphere.The microstructure was analyzed using scanning electron microscopy (SEM). The pictures were taken at room temperature (with 15 kV) on a JEOL JED 2300.
The identification of phase purity, homogeneity and crystallinity of polycrystalline sample was performed via powder X-ray diffraction (XRD) analysis, at room temperature, by means of an XPERT-PRO diffractmeter with a graphite monochromatized CuKα radiation (λCuKα = 1.54 Å). The data collected in the range of 19 ≤ 2θ ≤ 109 with a step-size of 0.02° and a counting time of 10 s per step were analyzed by the Fullprof software based on the Rietveld method27.
The Raman spectroscopy was recorded in the frequency range 70–1000 cm−1, in a micro-Raman Spectrometer LABRAM HR800. The excitation source was the 633 nm lines of He+ ion laser, working in a back scattering. The spectral resolution of the system was 3 cm−1. The deconvoluted Raman active modes for CNTN were determined by fitting with a combined pseudo-Voigt using the LabSpec5 software.
The weight and geometrical dimensions of the cylindrical pellets (mp = 0.2, e = 1 mm) are the main characteristics, determining the experimental density  which was compared to the theoretical density (
 where (Z = 1) stands for the number of atoms, NA = 6.02 × 10²³ represents the Avogadro's number, M denotes the molecular weight and V is the volume of tetragonal unit cell) determined from X-ray measurements. Hence, the compactness was calculated as the ratio
  Table 1 shows the values of ρtheo, ρexp and C. According to this table, CNTN compound is characterized by an excellent quality.
| Ca0.1Na0.9Ti0.1Nb0.9O3 | ||
|---|---|---|
| Density theo | Theo (g cm−3) | 5.39 |
| Density (exp) | Exp (g cm−3) | 5.12 |
| Compactness | C | 95% |
| Space group | P4mm | |
| Cell parameters | a = b (Å) | 3.925(1) |
| c (Å) | 4.012(4) | |
| c/a | 1.022(2) | |
| V (Å3) | 61.807(2) | |
| Thermal agitation | (Na/Ca) Biso (Å2) | 1.133(3) |
| (Nb/Ti) Biso (Å2) | 0.201(0) | |
| (O1) Biso (Å2) | 1.000(0) | |
| (O2) Biso (Å2) | 1.022(0) | |
| Bond lengths and bond angles | 〈d(Nb/Ti–O)〉 | 1.917 |
| 〈θ(Nb/Ti–O–Nb/Ti)〉 | 138.59 | |
| Agreement factors | Rp (%) | 10.2 |
| Rwp | 16.2 | |
| χ2 | 3.54 | |
To acquire dielectric measurements, gold electrodes were sputtered on the circular faces of the ceramic discs. The measurement of the real parts pertaining to the relative dielectric permittivity  was carried out via a Wayne–Kerr 6425 impedance analyser (from 100 Hz to 200 kHz), in the temperature range of 82 K to 500 K, with a heating rate of 2 K min−1.
3. Results and discussions
3.1. Morphological and X-ray diffraction analysis
Fig. 1 shows the SEM micrographs of the CNTN ceramic and the inset represents the grains size distribution histograms. The SEM image reveals that this compound has a homogenous microstructure and well-developed grains. The mean particle size of the sample was estimated by using ImageJ software. After measuring the diameters of the particle in SEM image, the obtained data were fitted with the lognormal function.
 | (1) |
![[thin space (1/6-em)]](https://www.rsc.org/images/entities/char_2009.gif) exp(σ2/2) and σD = 〈D〉[exp(σ2) − 1]1/2 standard deviation were determined using fit results (Table 2). The mean diameter of CNTN sample is 0.51 μm.
exp(σ2/2) and σD = 〈D〉[exp(σ2) − 1]1/2 standard deviation were determined using fit results (Table 2). The mean diameter of CNTN sample is 0.51 μm.
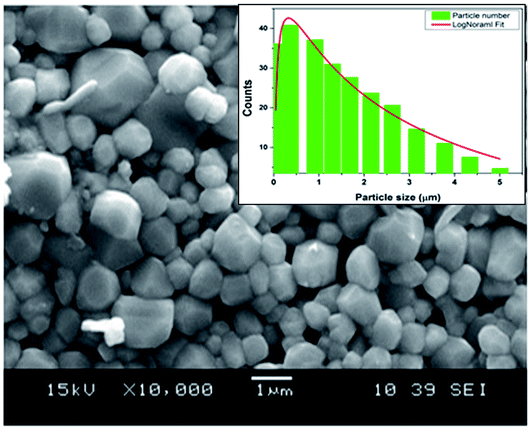 | ||
| Fig. 1 SEM image of the sample Ca0.1Na0.9Ti0.1Nb0.9O3 ceramic. The inset shows the size distribution histogram. | ||
| Sample | DSch (nm) | DW–H (nm) | DSEM (μm) | Strain (ε) |
|---|---|---|---|---|
| Ca0.1Na0.9Ti0.1Nb0.9O3 | 150 | 160 | 0.51 | 0.0580 |
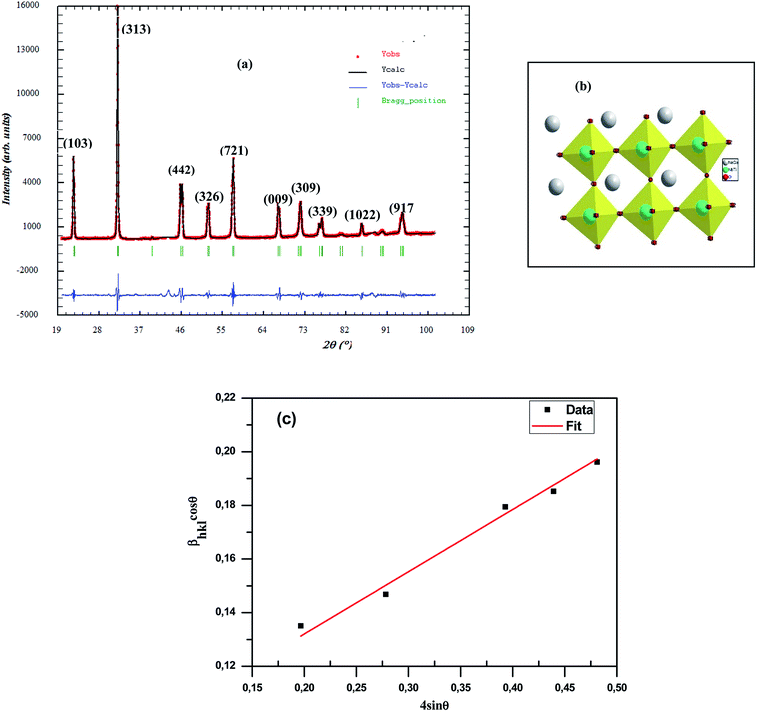
Fig. 2 shows the X-ray diffraction patterns for the CNTN sample taken at room temperature. This figure displays the formation of a single phase sample without any detectable impurities at least in the sensitivity range of our experimental apparatus, which indicates that Ca2+ and Ti4+ diffused into NaNbO3 lattices to form a new composition, CNTN. We found a good agreement between the observed and calculated profiles. The diffraction peaks were indexed in the tetragonal structure with the P4mm space group, with (Na/Ca): 1a (0, 0, 0), (Nb/Ti): 1b (0.5, 0.5, z), O1: 1b (0.5, 0.5, z) and O2: 2c (0.5, 0, z). Through the Rietveld refinement analysis, we estimated the lattice parameters, unit cell volume and fitting parameters were estimated. In fact, Table 1 represents the detailed results of Rietveld refinements. It can be noted that the partial replacement of Na+ by Ca2+ in site A and Ti4+ by Nb5+ in site B confirms the regular deviation of Nb/Ti–O–Nb/Ti bond angles and the Ti–O bond length (Table 1). However, the value of distance and angle data with the effect of the substitution indicates that the TiO6 octahedral framework has a slight distortion (inset of Fig. 2).
These observations are consistent with the crystal structure and the TiO6 octahedron for the CNTN sample determined using “Diamond” program which, based on the refined atomic positions find by XRD, was represented graphically as illustrated in the inset of Fig. 2(b). From this figure, the lattice distortion in our compound can be observed.
To validate the experimental observations, the results were compared with the Goldschmidt tolerance factor t,28 expressed by:
 | (2) |
Based on the values of the ionic radii of the various atoms, we estimated the tolerance factor value (t = 0.97), ranging in a stable pervoskite structure. This result is in line with the results of the refinement.
The average crystallite size of our CNTN compound was estimated using different methods, such as Scherrer formula (Sch) and Williamson–Hall formula (W–H).
Scherrer formula is as follows:30
 | (3) |
 . The values of DSch are given in Table 2.
Depending on different θ positions, the separation of size and strain broadening analysis was based on Williamson–Hall (W–H) method.32 The calculation of strain contribution is given by:
 | (4) |
Line broadening evidently combines crystallite size and strain, as represented by the following equation:
 | (5) |
In a more simplified way:
 | (6) |
The value of ε is calculated based on the slope of β![[thin space (1/6-em)]](https://www.rsc.org/images/entities/char_2009.gif) cos
cos![[thin space (1/6-em)]](https://www.rsc.org/images/entities/char_2009.gif) θ vs. 4
θ vs. 4![[thin space (1/6-em)]](https://www.rsc.org/images/entities/char_2009.gif) sin
sin![[thin space (1/6-em)]](https://www.rsc.org/images/entities/char_2009.gif) θ plot.
θ plot.
This gives an equation of a straight line between β![[thin space (1/6-em)]](https://www.rsc.org/images/entities/char_2009.gif) cos
cos![[thin space (1/6-em)]](https://www.rsc.org/images/entities/char_2009.gif) θ and 4
θ and 4![[thin space (1/6-em)]](https://www.rsc.org/images/entities/char_2009.gif) sin
sin![[thin space (1/6-em)]](https://www.rsc.org/images/entities/char_2009.gif) θ. Plotting β
θ. Plotting β![[thin space (1/6-em)]](https://www.rsc.org/images/entities/char_2009.gif) cos
cos![[thin space (1/6-em)]](https://www.rsc.org/images/entities/char_2009.gif) θ (y-axis) and 4
θ (y-axis) and 4![[thin space (1/6-em)]](https://www.rsc.org/images/entities/char_2009.gif) sin
sin![[thin space (1/6-em)]](https://www.rsc.org/images/entities/char_2009.gif) θ (x-axis), the slope of the line yields the strain (ε) and the crystallite size (D) can be calculated from the intercept
θ (x-axis), the slope of the line yields the strain (ε) and the crystallite size (D) can be calculated from the intercept  of this line on the y-axis, Fig. 2(c). Indeed, Table 2 illustrates the calculated values pertaining to the structural parameters.
From these calculations, we found that the average crystallite size calculated in the present system using W–H method (DW–H) is larger than that from Scherrer method (DSch) because the broadening effect due to strain is completely excluded in Scherrer method.33 In addition, we notice that the grains detected by SEM are obviously much larger compared to those calculated by XRD. Therefore, this indicates that each grain detected by SEM is composed of several crystallized grains.34
3.2. Raman spectroscopy
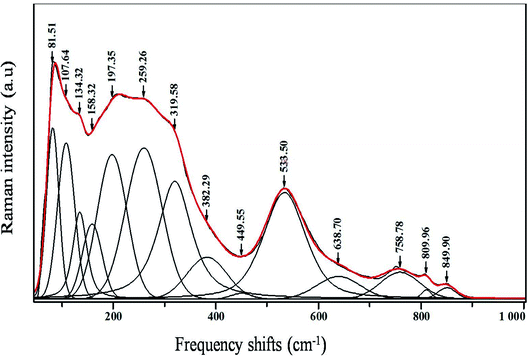
Raman spectroscopy was carried out for the sample in order to further study the changes in the crystal structure and the presence of functional groups, also to correlate our structural information with the Raman data that we obtained.The room temperature deconvolution of Raman spectrum of CNTN ceramic is shown in Fig. 7. The spectra are similar to that of NaNbO3 in tetragonal phase.35 The Raman spectrum of the tetragonal CNTN showed 14 vibration modes. These results, accordingly, are in line with the ones proposed by S. D. Ross,36 Juang37 and L. B. Abdessalem et al.38 In our compound, the peaks detected at 81, 107, 134 and 158 cm−1 were attributed to the Na–O bonds of the A-site vibration in the perovskite with an ABO3 general formula.39,40 Modes observed at 638.70 cm−1 are dominated by vibrations, involving chiefly oxygen displacements. The oxygen vacancies are present by the two latest modes (i.e., at 809 and 849 cm−1),40,41 which can be described as:
 | (7) |
The bands around 259 and 533 cm−1 are assigned to the mode of A1 (TO) symmetry. However, the bands around 319; 382 and 449 cm−1, signaling out the tetragonal phase, are ascribed to the E (TO + LO) + B1 mode.42 The A1 (LO) modes can be detected at 809 and 849 cm−1. The peaks assigned to the Nb–O phonon Raman spectrum are identified at 276 cm−1 for NaNbO3.43–45. On the other hand, in the CNNT, they are observed at 259 cm−1 (Fig. 3). This behavior means that the substitution of NaNbO3 by Ca2+ in A site and by Ti4+ in B site of the perovskite structure gives rise to an important disorder in the structure. These results are in compliance with the results related to the XRD (Fig. 2(a)) patterns from the variation of c/a ratio and the volumes of cell parameter of our compound (Table 1).
This structural distortion and slight change in the local symmetry of the CNTN sample can affect the dielectric property by confirming the relaxor behavior for this sample.
3.3. Dielectric studies
The evolution of the real part of the permittivity as a function of the temperature and the frequency of the CNTN ceramic is shown in Fig. 4. The studied system exhibits the distinctive feature of relaxor ferroelectrics, namely a strong dispersion of the maximum of at T < Tm (Tm is the maximum permittivity temperature) which shifts towards higher temperature by decreasing progressively the value of
  as the frequency increases. The relaxor phenomenon has recently been explored in perovskite structure, viz. Ba1−xNax(Ti0.8Sn0.2)1−xNbO3,46 (Pb1−3x/2Lax)(Mg1/3Nb2/3)O3,47 0.3Bi1−xYxFeO3-0.7Ba0.8Sr0.2TiO3 (ref. 48) and (Pb1−3x/2Lax)(Zr1−yTiy)O3.49 The diffuse dielectric behavior of relaxor materials has been attributed to the compositional fluctuation (i.e., the presence of a microscopic domain in the macro polar region) and to the structural disorder in crystallographic sites when one or more cations occupy the same site in the structure;50–53 in our case Ca2+ by Na+ in site A and Ti4+ by Nb5+ in site B. Table 3 shows the relaxor characteristics for our composition as the Tm shift, ΔTm = (Tm (2 × 10⁵ Hz) − Tm (102 Hz)), and the relative dispersion
  .
.
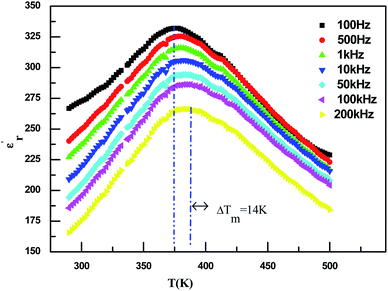 | ||
Fig. 4 Temperature dependence on the permittivity  at various frequencies of Ca0.1Na0.9Ti0.1Nb0.9O3 ceramic. at various frequencies of Ca0.1Na0.9Ti0.1Nb0.9O3 ceramic. | ||
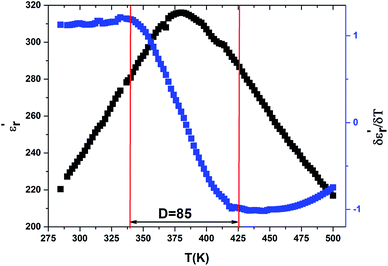
The width of the transition represents the DPT for the CNTN compound, which is very important in ferroelectric materials. We can define ‘D’ as the distinctive parameter of diffuseness degree. This is defined as:54
 | (8) |
 and
and  are the temperature when
  reaches the minimum and maximum, respectively. The curves for the
  against (T) for the sample are indicated in Fig. 5. The temperature interval between
  and
and  reflects the diffuseness degree microscopically. The vertical dashed lines in Fig. 5 correspond to
  and
and  values. The interval between them is D as indicated.
The value of diffuseness is of the order D = 85 (Table 3). Therefore, the phase transition from paraelectric-ferroelectric (Tc) is the transition that is more diffuse.
With reference to the Tm transition temperature, the dielectric constant  and the Curie temperature T0 of a ferroelectric can be depicted by the Curie–Weiss law as follows:
 | (9) |
Fig. 6(a) exhibits the inverse of the dielectric constant  depending on the temperature at 1 kHz. A deviation from Curie–Weiss law is detected in this sample. The parameter ΔTcm refers to the degree of deviation from the Curie–Weiss law and is expressed by: ΔTcm = Tdev − Tm where Tdev stands for the temperature at which the dielectric constant starts deviating from Curie–Weiss law and Tm denotes the temperature of the dielectric maximum.
The values of the parameters C, T0, Tdev, Tm and ΔTcm are illustrated in Table 3. (TC ≠ T0) shows that the phase transition is of a first order type.55 The broadened peaks correspond to the diffuse type transition in this composition, a distinctive feature of a disordered perovskite structure.
To further study the phase transition behavior of the CNTN sample, we calculated the diffuseness parameter using the modified Curie–Weiss law:56
 | (10) |
The diffuseness coefficient γ allows understanding the character of the phase transition; C1 is a constant quantity and  is the peak dielectric permittivity at temperature Tm. In general, the value of γ between these limits (1 < γ < 2) provide an incomplete diffuse phase transition. For normal ferroelectrics γ approximate to 1, while relaxor ones approximate to 2.
The inset of Fig. 6(b) shows the plots of  versus ln
![[thin space (1/6-em)]](https://www.rsc.org/images/entities/char_2009.gif) (T − Tm) at 1 kHz for CNTN ceramic sample. The obtained values of ‘γ’ are found in the order of 1.58, which corresponds to the diffuse phase transition assigned to the existence of various states of polarization, thus various relaxation times in different regions.57 Therefore, the origin of the observed relaxor behavior with DPT in CNTN sample is due to the inhomogeneous distribution assigned to the compositional fluctuation, resulting in the microscopic heterogeneity with various Curie points and giving rise to the detected behavior Relaxor.58 Furthermore, the creation of the Coulomb interactions at long distance inhibits the formation of ferroelectric microdomains in favor of the formation of the PNRs. Under these conditions, the order becomes short. Each nanodomain transits at a given temperature, which explains the diffuse character and the widening of the transition, however, no dielectric relaxation at temperatures below Tm. This dielectric dispersion is elucidated by the dynamics of these nanodomains. In fact, this behavior is identical to those mentioned in the literature.59
(T − Tm) at 1 kHz for CNTN ceramic sample. The obtained values of ‘γ’ are found in the order of 1.58, which corresponds to the diffuse phase transition assigned to the existence of various states of polarization, thus various relaxation times in different regions.57 Therefore, the origin of the observed relaxor behavior with DPT in CNTN sample is due to the inhomogeneous distribution assigned to the compositional fluctuation, resulting in the microscopic heterogeneity with various Curie points and giving rise to the detected behavior Relaxor.58 Furthermore, the creation of the Coulomb interactions at long distance inhibits the formation of ferroelectric microdomains in favor of the formation of the PNRs. Under these conditions, the order becomes short. Each nanodomain transits at a given temperature, which explains the diffuse character and the widening of the transition, however, no dielectric relaxation at temperatures below Tm. This dielectric dispersion is elucidated by the dynamics of these nanodomains. In fact, this behavior is identical to those mentioned in the literature.59
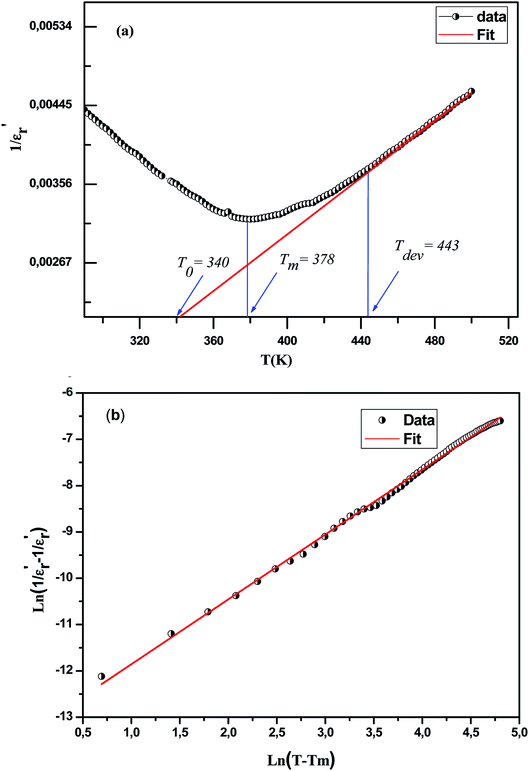 | ||
Fig. 6 The variation of  versus temperature for Ca0.1Na0.9Ti0.1Nb0.9O3 ceramic (a); the variation of versus temperature for Ca0.1Na0.9Ti0.1Nb0.9O3 ceramic (a); the variation of  as a function of ln as a function of ln![[thin space (1/6-em)]](https://www.rsc.org/images/entities/char_2009.gif) (T − Tm) at 100 kHz for this compound (b). (T − Tm) at 100 kHz for this compound (b). | ||
F. Bourguiba and Kirillov et al.60,61 highlight the quadratic relation between the dielectric constant and temperature for ferroelectrics with a diffuse phase transition (relaxor-ferroelectrics). This quadratic law was derived theoretically from a microscopic composition-fluctuation model basis. Assuming that the statistical composition fluctuation in a complex perovskite generates microscopic regions possessing similar dielectric characteristics, but a marginally different Curie temperature, and that the distribution of the Curie temperature is of a Gaussian type as well:62
 | (11) |
 is the maximum of the real part of the dielectric permittivity, Tm is the temperature of maximum dielectric permittivity and δ1 is the diffuseness parameter pertaining to the peak broadening of the phase transition.
However, it was found that this Gaussian distribution is not suitable to account for the relaxor behavior in our CNTN compound. Furthermore, the Power law was introduced to explain the dependence of temperature on the dielectric constant and it is given as:63
 | (12) |
The experimental values are fitted to eqn (11) and (12) and illustrated in Fig. 7(a) and (b). By fitting the experimental data to eqn (12), the value of γ is 1.61, standing for the diffuse phase transition.
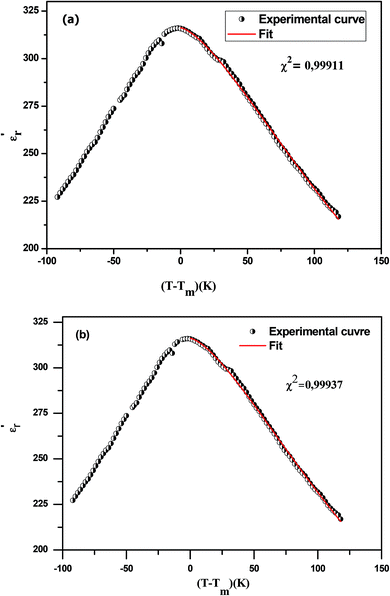 | ||
| Fig. 7 The experimental and fitted dielectric data versus temperature for Na0.9Ca0.1Nb0.9Ti0.1O3 ceramic using eqn (11) (a) and (12) (b). | ||
Comparing the modified Curie–Weiss law and Power law, it is noted that the values of γ are close.
Overall, the presence of micro-heterogeneities in the pervoskite material due to the thermo chemical diffusion controlled by solid-state reactions may account for the relaxor behavior with DPT. In our case, the relaxor behavior is a result of both the substitution of Ca2+ by Na+ and Ti4+ by Nb5+ in A and B sites, respectively. Therefore, different states of polarization are caused by such a heterogeneous distribution of cations.
According to the Curie–Weiss law and the value of the empirical parameters such as ΔTcm, γ and ΔTm, all the characterizations, as determined above, confirmed the relaxor type of the ceramic.
To have a better insight into relaxor ferroelectric character, the maximum dielectric constant (Tm) is found to obey Vogel–Fulcher model.64 This model observes the interaction between the dipoles, which makes the dipoles freeze at a particular temperature, labeled freezing temperature. Moreover, the relation similar to that recognized for glasses can depict this model,65 and it is expressed as follows:
 | (13) |
![[thin space (1/6-em)]](https://www.rsc.org/images/entities/char_2009.gif) f (in the range of frequencies 0.1–200 kHz) as a function of 1/Tm. The experimental curve was fitted using the above mentioned Vogel–Fulcher formula, characterized by the following fitting parameters: TF = 137 K, Ea = 0.053 eV and f0 = 3.44 105 Hz.
f (in the range of frequencies 0.1–200 kHz) as a function of 1/Tm. The experimental curve was fitted using the above mentioned Vogel–Fulcher formula, characterized by the following fitting parameters: TF = 137 K, Ea = 0.053 eV and f0 = 3.44 105 Hz.
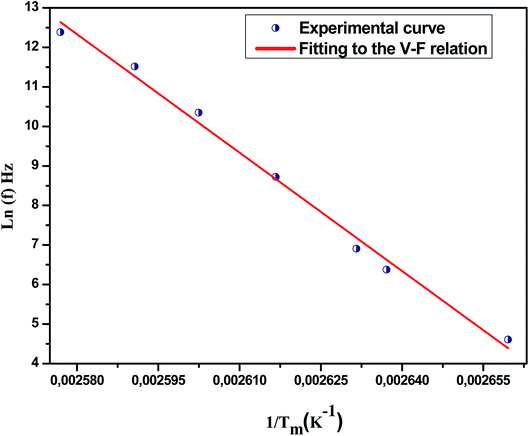 | ||
| Fig. 8 Fitting of Vogel–Fulcher model to the dielectric relaxation data of Na0.9Ca0.1Nb0.9Ti0.1O3 ceramic. | ||
In addition, we notice that the pre-exponent factor f0 elucidates the size of polar clusters and the degree of interaction between them. The smaller the size of the cluster is, the lower the interaction between them is and hence the larger value of f0 is, and vice versa.
Similarly, the low values of the activation energy are also found by H. Ghoudi et al.66 for (Ba0.7Sr0.3)1−xNax (Ti0.9Sn0.1)1−xNbxO3 relaxors (Ea ≈ 0.061 eV). The activation energy Ea, much lower in our ceramic, reflected a lower barrier between two potential wells. This range of features, relating to the potential well, reflected different polarization mechanisms. As shown in this figure (Fig. 8), the model accounts well for the data, suggesting the similarity between the relaxor behavior in the present composition and that of a spin glass model with polarization fluctuations beyond the static freezing temperature.
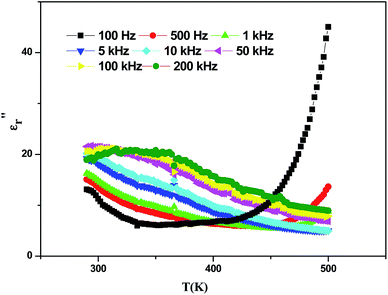
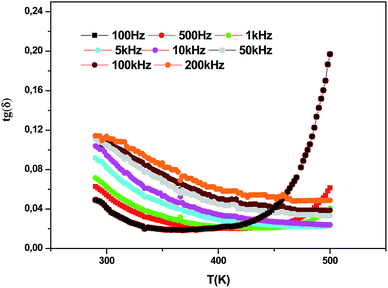
Fig. 9 and 10 show the thermal evolution of the imaginary part of the permittivity and loss for this Ca0.1Na0.9Ti0.1Nb0.9O3 ceramic. The dielectric losses are about 6%.
4. Conclusion
To conclude, using the conventional solid state reaction method, Ca0.1Na0.9Ti0.1Nb0.9O3 was successfully prepared. The Rietveld analysis of X-ray diffraction, at room temperature, validated that there is a single phase tetragonal perovskite crystal structure with the P4mm space group. The vibrational Raman spectroscopy study at room temperature confirms our structural results. With broad and dispersive permittivity maxima based on empirical parameters (ΔTm, ΔTcm, and γ), the dielectric study of the composition offered typical characteristics of relaxor ferroelectrics. Furthermore, the relaxation behavior is triggered by monopolar based on the Vogel–Fulcher model. This behavior is similar to the thermally-activated process of the spin, wherein the freezing process is controlled by cluster-flipping and inter-cluster interaction mechanism. This composition can be of high significance. Indeed, industrially speaking, these applications require a relaxor character at room temperature with non-lead based ceramic.Conflicts of interest
There are no conflicts to declare.References
- V. Westphal, W. Kleemann and M. D. Glinchuk, Phys. Rev. Lett., 1992, 68, 847–850 CrossRef CAS PubMed.
- S. B. Hemer, F. A. Selmi, V. V. Varadan and V. K. Varadan, Mater. Lett., 1993, 5, 317–324 Search PubMed.
- T. Hu, T. J. Price, D. M. Iddles, A. Uusimäki and H. Jantunen, J. Eur. Ceram. Soc., 2005, 25, 2531–2535 CrossRef CAS.
- S. Garcia, R. Font, J. Portelles, R. J. Q. U. I. Nones, J. Heiras and J. M. Siqueiros, J. Electroceram., 2001, 3, 101–108 CrossRef.
- K.-T. Kim and C.-I. Kim, Thin Solid Films, 2005, 472, 26–30 CrossRef CAS.
- S. Garcia, R. Font, J. Portelles, R. J. Q. U. I. Nones, J. Heiras and J. M. Siqueiros, J. Electroceram., 2001, 3, 101–108 CrossRef.
- S.-G. Lee, R. G. Monteiro, R. S. Feigelson, H. S. Lee, M. Lee and S.-E. Park, Appl. Phys. Lett., 1999, 1030–1032 CrossRef CAS.
- A. Lurio and G. Burns, J. Appl. Phys., 1974, 45, 1986–1992 CrossRef CAS.
- R. Brahem, H. Rahmouni, N. Farhat, J. Dhahri and K. Khiroun, Ceram. Int., 2014, 40, 9355–9360 CrossRef CAS.
- S. Chihaoui, L. Seveyrat, V. Perrin, I. Kallel, L. Lebrun and H. Khemakhem, Ceram. Int., 2016, 123, 305 Search PubMed.
- P. Sateesh, J. Omprakash, G. S. Kumar and G. Prasad, J. Adv. Dielectr., 2015, 5, 1550002–1550015 CrossRef CAS.
- H. Abdelkefi, H. Khemakhem, V. Gabriel and J. Claude, J. Alloys Compd., 2005, 399, 1–6 CrossRef CAS.
- L. P. Curecheriu, L. Mitoseriu and A. Ianculescu, J. Alloys Compd., 2009, 482, 1–4 CrossRef CAS.
- D. Kothari, V. Raghavendra Reddy, V. G. Sathe, A. Gupta, A. Banerjee and A. M. Awasthi, Ceram. Int., 2015, 41, 12958–12966 CrossRef.
- X. Chen, Y. Li, F. Kong, L. Li, Q. Sun and F. Wang, J. Alloys Compd., 2012, 541, 505–509 CrossRef CAS.
- Y. J. Wong, J. Hassan and M. Hashim, J. Alloys Compd., 2013, 571, 138–144 CrossRef CAS.
- A. B. Hassen, F. I. H. Rhouma, J. Dhahri and N. Abdelmoula, J. Alloys Compd., 2016, 663, 436–443 CrossRef.
- S. Sasaki, C. T. Prewitt and J. D. Bass, Acta Crystallogr., Sect. C: Cryst. Struct. Commun., 1987, 43, 1668–1674 CrossRef.
- V. V. Lemanov, A. V. Sotnikov, E. P. Smirnova, M. Weihnacht and R. Kunze, Solid State Commun., 1999, 110, 611–614 CrossRef CAS.
- K. Konieczny, Mater. Sci. Eng. B., 1999, 60, 124–127 CrossRef.
- S. Khemakhem, S. Yahyaoui, R. Ben Hassen, H. Khemakhem and A. Ben Salah, Solid State Sci., 2003, 5, 367–371 CrossRef CAS.
- M. Athee and A. W. Hewat, Acta Crystallogr. A, 1975, 31, 846 CrossRef.
- R. Von Der Mühll, A. Sadel and P. Hagenmuller, J. Solid State Chem., 1984, 51, 176 CrossRef.
- S. Tripathi, A. Kumar, U. V. Waghmare and D. Pandey, Phys. Rev. B, 2010, 81, 212101 CrossRef.
- A. L. Goodwin, S. A. T. Redfern, M. T. Dove, D. A. Keen and M. G. Tucker, Phys. Rev. B: Condens. Matter Mater. Phys., 2007, 76, 1–4 CrossRef.
- S. Tripathi, D. Pandey, S. K. Mishra and P. S. R. Krishna, Phys. Rev. B: Condens. Matter Mater. Phys., 2008, 77, 052104 CrossRef.
- A. Simon, J. Ravez and M. Maglione, Solid State Sci., 2005, 7, 925–930 CrossRef CAS.
- J. B. Goodenough, Phys. Rev., 1955, 100, 564 CrossRef CAS.
- B. Y. R. D. Shannon, Acta Crystallogr., Sect. A: Cryst. Phys., Diffr., Theor. Gen. Crystallogr., 1976, 32, 751 CrossRef.
- Z. Q. Li, E. Y. Jiang, S. W. Ren, D. L. Hou, P. Wu and H. L. Bai, Phys. Status Solidi A, 2003, 195, 429–433 CrossRef CAS.
- V. Biju, N. Sugathan, V. Vrinda and S. L. Salini, Estimation of lattice strain in nanocrystalline silver from X-ray diffraction line broadening, J. Mater. Sci., 2008, 43, 1175–1179 CrossRef CAS.
- G. K. Williamson and W. H. Hall, Acta Metall., 1953, 1, 22 CrossRef CAS.
- K. S. Rao, B. Tilak, K. C. V. Rajulu, A. Swathi and H. Workineh, J. Alloys Compd., 2011, 509, 7121–7129 CrossRef CAS.
- I. P. Muthuselvam and R. N. Bhowmik, J. Alloys Compd., 2012, 511, 22–30 CrossRef CAS.
- Y. Chang, Z. Yang, M. Dong, Z. Liu and Z. Wang, Mater. Res. Bull., 2009, 44, 538–542 CrossRef CAS.
- S. D. Ross, J. Phys. C: Solid State Phys., 1970, 3, 1785–1786 CrossRef CAS.
- Y. D. Juang, M. L. Hu and W. S. Tse, J. Appl. Phys., 1994, 76, 3746 CrossRef.
- L. Ben Abdessalem, M. Ben Abdessalem, A. Aydi and Z. Sassi, J. Mater. Sci.: Mater. Electron., 2017, 28, 14264–14270 CrossRef CAS.
- M. Zannen, A. Lahmar, M. Dietze, H. Khemakhem, A. Kabadou and M. Es-Souni, Mater. Chem. Phys., 2012, 134, 829–833 CrossRef CAS.
- S. Said, P. Marchet, T. Merle-Méjean and J.-P. Mercurio, Mater. Lett., 2004, 58, 1405–1409 CrossRef CAS.
- R. Selvamani, G. Singh, V. Sathe, V. S. Tiwari and P. K. Gupta, J. Phys.: Condens. Matter, 2011, 23, 055901 CrossRef PubMed.
- M. Zannen, H. Khemakhem, A. Kabadoub and M. Es-Souni, J. Alloys Compd., 2013, 555, 56–61 CrossRef CAS.
- L. Patricio, R. Hermans, N. Velasco, G. Tarrach, F. Schlaphof and C. Loppacher, Surf. Sci., 2003, 532–535, 493–500 Search PubMed.
- S. Aydi, A. Amouri, S. Chkoundali and A. Aydi, Ceram. Int., 2017, 43, 12179–12185 CrossRef CAS.
- J. Fuming, K. Seiji, Z. Changlei and F. Chude, J. Appl. Phys., 2000, 88, 3608–3612 CrossRef.
- A. Aydi, A. Simon, D. Michau, R. V. Der Muhll, N. Abdelmoula and H. Khemakhem, J. Optoelectron. Adv. Mater., 2012, 14, 251–256 CAS.
- D. M. Fanning, I. K. Robinson, S. T. Jung, E. V. Colla, D. D. Viehland and D. A. Payne, J. Appl. Phys., 2000, 87, 840–848 CrossRef CAS.
- A. Kharouf, A. Aydi and K. Khirouni, J. Alloys Compd., 2019, 775, 81–89 CrossRef CAS.
- X. Dai, A. DiGiovanni and D. Viehland, J. Appl. Phys., 1993, 74, 3399–3405 CrossRef CAS.
- F. Boujelben, F. Bahri, C. Boudaya, A. Maalej, H. Khemakhem, A. Simon and M. Maglione, J. Alloys Compd., 2009, 481, 559–562 CrossRef CAS.
- A. Aydi, A. Simon, D. Michau, R. Von Der Mühll, N. Abdelmoula and H. Khemakhem, J. Alloys Compd., 2011, 509, 7773–7777 CrossRef CAS.
- C. Chaker, Y. Gagou, N. Abdelmoula, J.-L. Dellis, C. Masquelier, H. Khemakhem and M. El Marssi, J. Appl. Phys., 2012, 111, 044101 CrossRef.
- I. Kallel, Z. Abdelkafi, N. Abdelmoula, A. Simon and H. Khemakhem, Bull. Mater. Sci., 2013, 36, 893–898 CrossRef CAS.
- S. Q. Jan, M. Usman, M. N. Ul-Haq and A. Mumtaz, J. Alloys Compd., 2018, 735, 1893–1900 CrossRef CAS.
- Z. Raddaoui, S. El Kossi, J. Dhahri, N. Abdelmoula and K. Taibi, RSC Adv., 2019, 9, 2412 RSC.
- T. Badapanda, S. Rout, L. Cavalcante, J. Sczancoski, S. Panigrahi, E. Longo and M. S. Li, J. Phys. D: Appl. Phys., 2009, 42, 175414 CrossRef.
- L. E. Cross, Ferroelectrics, 1994, 151, 305–320 CrossRef CAS.
- A. Aydi, S. Chkoundali, H. Khemakhem, A. Simon and R. Von der Mühl, J. Alloys Compd., 2008, 465, 222–226 CrossRef CAS.
- G. A. Smolenskii, J. Phys. Soc. Jpn., 1970, 28(Suppl 2), 26 Search PubMed.
- V. V. Kirillov and V. A. Isupov, Ferroelectrics, 1973, 5, 3–9 CrossRef CAS.
- F. Bourguiba, Ah. Dhahri, T. Tahri, J. Dhahri, N. Abdelmoula, K. Taibi and E.-K. Hlil, J. Alloys Compd., 2016, 675, 174–182 CrossRef CAS.
- H. T. Martirena and J. C. Burfoot, Ferroelectrics, 1974, 7, 151–152 CrossRef CAS.
- H. Vogel, Phys. Z., 1921, 22, 645–667 CAS.
- G. Fulcher, Analysis of recent measurements of the viscosity of glasses, J. Am. Ceram. Soc., 1925, 8, 339–355 CrossRef CAS.
- D. Viehland, S. Jang, L. E. Cross and M. Wittig, J. Appl. Phys., 1990, 68, 2916–2921 CrossRef CAS.
- H. Ghoudi, S. Chkoundali, A. Aydi and K. Khirouni, Appl. Phys. A, 2017, 123, 703 CrossRef.
| This journal is © The Royal Society of Chemistry 2019 |

