 Open Access Article
Effect of ozone treatment on the phenylpropanoid biosynthesis of postharvest strawberries†
Cunkun Chenab,
Huijie Zhangc,
Chenghu Dongd,
Haipeng Jid,
Xiaojun Zhangab,
Li Li e,
Zhaojun Banf,
Na Zhangd and
Wentong Xue
 *ab
*ab
aBeijing Advanced Innovation Center for Food Nutrition and Human Health, College of Food Science and Nutritional Engineering, China Agricultural University, Beijing, China. E-mail: 17806283010@163.com
bCollege of Food Science and Nutritional Engineering, China Agriculture University, Beijing, China
cCollege of Food Engineering and Biotechnology, Tianjin University of Science and Technology, Tianjin, China
dNational Engineering Technology Research Center for Preservation of Agricultural Products, China, Key Laboratory of Postharvest Physiology and Storage of Agricultural Products, Ministry of Agriculture of China, Tianjin Key Laboratory of Postharvest Physiology and Storage of Agricultural Products, Tianjin, China
eKey Laboratory for Agro-Products Postharvest Handling of Ministry of Agriculture, Zhejiang Key Laboratory for Agro-Food Processing, College of Biosystems Engineering and Food Science, Zhejiang University, Hangzhou, China
fZhejiang Provincial Key Laboratory of Chemical and Biological Processing Technology of Farm Products, Zhejiang University of Science and Technology, Hangzhou, China
First published on 14th August 2019
Abstract
Ozone treatment at a suitable concentration can improve the antioxidant capacity of postharvest fruits. However, few studies have examined the antioxidant bioactive compounds in ozone-treated postharvest strawberries, especially in relation to proteomics. In this study, the total phenol content (TPC), total flavonoid content (TFC), and total anthocyanin content (TAC) were used as the main antioxidant compound indicators and unlabeled proteomics was used to study the metabolism of phenylpropanoids in postharvest strawberries (Jingtaoxiang) treated with different concentrations of ozone (0, 1, 3, and 5 ppm) throughout the duration of storage. The results showed that the postharvest strawberries treated with 5 ppm ozone concentration exhibited improved accumulation of total phenols, flavonoids and anthocyanins in the antioxidant bioactive compounds, which was beneficial to the expression of phenylpropanoid metabolism-related proteins over the whole storage period compared with the other three groups. The results of proteomics were consistent with the changes in the key metabolites of phenylpropanoids, which indicated that ozone treatment at a suitable concentration aids the accumulation of TPC, TAC and TFC by promoting the key proteins associated with phenylpropanoid metabolism.
1. Introduction
Fresh agricultural products are regarded as healthy, nutritious foods; thus, the commercial requirement for such produce is increasing significantly.1 Strawberries are one of the most popular fruits in the world, and they possess beneficial effects from natural compounds such as flavonoids, total phenols, and anthocyanins having antioxidant properties.2,3 However, the storage of strawberries is always a concern due to their uniform texture, softening rate, high breathing rate and vulnerability to fungal attack.4Ozone is a strong oxidizing agent and is considered to have positive effects on the storage of strawberries; some studies showed that ozone treatment can effectively inhibit fungal attack on strawberries,5–7 remove residual pesticides,8 and extend the storage time of strawberries.9 Ozone water treatment at a concentration of 0.3 ppm maintains the firmness, color and ascorbic acid content of the postharvest strawberries.10 However, Ana Allende et al. found that the phenolic content of the strawberries treated with O3 gas (5000 mg L−1) was significantly reduced due to the reduction of procyanidins, and the vitamin C content was lowest at the end of storage.11 However, our previous research found that a 5 ppm ozone treatment can promote the synthesis of strawberry anthocyanins.12
Phenylpropanoid biosynthesis as a biological plant pathway for the synthesis of antioxidant substances, such as total flavonoid content (TFC), total anthocyanins content (TAC) and total phenolic content (TPC), has been reviewed extensively.13,14 Miao et al. found that the red and yellow films lead to the significant increase in the total anthocyanin content-related enzyme activity and the expressions of structural genes and transcription factor genes during the growth of strawberries.15 Also, 21 proteins and isoforms related to anthocyanin biosynthesis were investigated using quantitative proteomics at three ripening stages of two strawberry cultivars.16 Xu et al. concluded that calcium may enhance the accumulation of anthocyanins and total phenols in fruits by increasing the expression of anthocyanin structural genes using RT-qPCR at the green, turning, and ripe stages.17 However, there are few proteomics and genomic studies on the phenylalanine-flavonoid metabolic pathway of postharvest strawberries and little research on the effects of ozone treatment on the phenylalanine metabolism of postharvest strawberries.
Therefore, the “Jingtaoxiang” strawberry was used as a test material, and four different concentrations of ozone gas (0 mg m−3, 1 ppm, 3 ppm, 5 ppm) were used in this experiment to investigate the mechanism of phenylpropanoid metabolism in postharvest strawberries treated by ozone. The effects of different concentrations of ozone on the content of flavonoids, total phenols, and anthocyanins in strawberry fruits during storage were investigated, and label-free proteomics and qRT-PCR techniques were used to detect the effects of ozone treatment on postharvest strawberries at 7 and 21 days to explore the metabolic pathway.
2. Materials and methods
2.1 Plant materials and treatments
Strawberries (Fragaria ananassa Duch. ‘JingTaoXiang’) were collected on February 15, 2018 in the modern agricultural science and technology innovation base (Wuqing District, Tianjin, China) and transported to the laboratory within 1 h; next, strawberries of uniform size, with accordant maturity, and no pests, diseases, or mechanical damage were selected for the experiments. The fruit handling and sample preparation procedure was published in a previous work.12 Strawberries were randomly divided into four groups: three treatment groups and one control group. Every group was assigned 18 boxes and each box weighed approximately 300 g. Each group was placed in the ozone treatment cabinet at 0, 7, 14, and 21 days with different concentrations of ozone (1, 3, and 5 ppm) for 10 h every 7 days using a precise ozone refrigerated fumigation device made in the National Engineering Research Center for Agricultural Products Preservation (Tianjin)12 and transferred to 4 °C cold storage.Three samples of each treatment group were taken at 7 days and 21 days for the analysis of proteins and six samples (five storage points) were taken for the determination of the index.
2.2 TFC
The extraction method of total phenols refers to the method reported by Cao and Xu.18,19 After accurately weighing 1.0 g of strawberry fruit tissue, 5.0 mL of pre-cooled 95% ethanol (containing 3% formic acid) was added, ground under ice bath conditions and transferred to a 15 mL sample vial. The sample was then mixed and sonicated for 5 min, shaken for 30 min, and centrifuged at 10![[thin space (1/6-em)]](https://www.rsc.org/images/entities/char_2009.gif) 000 × g 4 °C for 15 min; the supernatant was collected. The filter residue was secondarily extracted with 15.0 mL of 80% ethanol (containing 5% formic acid). After the same extraction process, the twice extracted supernatant was mixed, filtered and diluted up to 25 mL for the determination of total flavonoid content.
000 × g 4 °C for 15 min; the supernatant was collected. The filter residue was secondarily extracted with 15.0 mL of 80% ethanol (containing 5% formic acid). After the same extraction process, the twice extracted supernatant was mixed, filtered and diluted up to 25 mL for the determination of total flavonoid content.
The total flavonoid content (TFC) was determined by the colorimetric method by Jia with slight modifications.20 We added 0.5 mL of the extract to 4.5 mL of distilled water; we immediately added 0.3 mL of 5% (w/v) NaNO2 solution and then, we added 0.6 mL of 10% (w/v) AlCl3 solution after 5 min. After 6 min, 2.0 mL of 1 M NaOH solution was added, and the mixed reactants were made up to 10 mL with distilled water and thoroughly mixed. The absorbance was read at 510 nm using distilled water as a blank. The results were expressed as milligrams of catechin equivalent CE mg per g fresh weight (FW).
2.3 TAC
The analysis of anthocyanin content was performed using ultra performance liquid chromatography (UPLC), and the method has been described in our previous article.12 A sample of anthocyanin extract (10 mL; methanol![[thin space (1/6-em)]](https://www.rsc.org/images/entities/char_2009.gif) :
:![[thin space (1/6-em)]](https://www.rsc.org/images/entities/char_2009.gif) acetone
acetone![[thin space (1/6-em)]](https://www.rsc.org/images/entities/char_2009.gif) :
:![[thin space (1/6-em)]](https://www.rsc.org/images/entities/char_2009.gif) water
water![[thin space (1/6-em)]](https://www.rsc.org/images/entities/char_2009.gif) :
:![[thin space (1/6-em)]](https://www.rsc.org/images/entities/char_2009.gif) formic acid = 40
formic acid = 40![[thin space (1/6-em)]](https://www.rsc.org/images/entities/char_2009.gif) :
:![[thin space (1/6-em)]](https://www.rsc.org/images/entities/char_2009.gif) 40
40![[thin space (1/6-em)]](https://www.rsc.org/images/entities/char_2009.gif) :
:![[thin space (1/6-em)]](https://www.rsc.org/images/entities/char_2009.gif) 20
20![[thin space (1/6-em)]](https://www.rsc.org/images/entities/char_2009.gif) :
:![[thin space (1/6-em)]](https://www.rsc.org/images/entities/char_2009.gif) 0.1) was added to 5.0 g strawberry, and the mixture was thoroughly ground and exposed to ultrasonic treatment (35 kHz) for 10 min at 20 °C. The mixture was centrifuged at 12
0.1) was added to 5.0 g strawberry, and the mixture was thoroughly ground and exposed to ultrasonic treatment (35 kHz) for 10 min at 20 °C. The mixture was centrifuged at 12![[thin space (1/6-em)]](https://www.rsc.org/images/entities/char_2009.gif) 000 rpm at 4 °C for 20 min. The supernatant was concentrated on a rotary evaporator at 40 °C and dissolved in 5.0 mL of a duplicate solution (water
000 rpm at 4 °C for 20 min. The supernatant was concentrated on a rotary evaporator at 40 °C and dissolved in 5.0 mL of a duplicate solution (water![[thin space (1/6-em)]](https://www.rsc.org/images/entities/char_2009.gif) :
:![[thin space (1/6-em)]](https://www.rsc.org/images/entities/char_2009.gif) ACN
ACN![[thin space (1/6-em)]](https://www.rsc.org/images/entities/char_2009.gif) :
:![[thin space (1/6-em)]](https://www.rsc.org/images/entities/char_2009.gif) formic acid = 93
formic acid = 93![[thin space (1/6-em)]](https://www.rsc.org/images/entities/char_2009.gif) :
:![[thin space (1/6-em)]](https://www.rsc.org/images/entities/char_2009.gif) 7
7![[thin space (1/6-em)]](https://www.rsc.org/images/entities/char_2009.gif) :
:![[thin space (1/6-em)]](https://www.rsc.org/images/entities/char_2009.gif) 2.5). Finally, the sample was filtered through 0.22 μm filters and injected.
2.5). Finally, the sample was filtered through 0.22 μm filters and injected.
The UPLC system consisted of a low temperature automatic injection, a photodiode array detector, and a chromatographic column (Waters ACQUITY UPLC BEH C18 column, 2.1 × 50 mm, 1.7 μm). The injection volume was 10 μL and the flow rate was 0.4 mL min−1. Mobile phase A: 2.5 mL formic acid/100 mL water, mobile phase B: chromatographic grade acetonitrile (ACN). Gradient elution conditions: 0–5 min, 93–90% A, 7–10% B; 2 min, 90–80% A, 10–20% B; 12–14 min, 80–0% A, 20–100% B; 14–15 min, 0–93% A, 100–7% B; and 15–20 min, 93% A, 7% B. The detection wavelength was 500 nm and the scanning wavelength was 210–600 nm. The column temperature was 30 °C and the sample temperature was 20 °C. The content was expressed as mg P3G equivalent (C3GE)/100 g FW.
2.4 TPC
The extraction method of total phenolic content (TPC) was the same as the method of TFC. TPC was determined using the Slinkard's method.21 We added 1.0 mL of the Folin phenol reagent to 0.2 mL of the diluted solution and mixed at room temperature for 4 min; then, we added 0.8 mL Na2CO3 solution (7.5%, w/v). After 1 h in the dark room, the absorbance was measured with a spectrophotometer at a wavelength of 765 nm. The absorbance of the gradient concentration of gallic acid was determined under the same conditions to prepare a standard curve. The results are expressed as mg gallic acid equivalent GAE mg per g fresh weight (FW).2.5 Proteomic analysis
A detailed procedure of protein extraction, LC-MS/MS, protein identification and data validation and bioinformatics analysis is described in previous publications.12 The quality data of strawberry samples are shown in Table 1. The digested peptides were analysed on a Q-Extractive HF mass spectrometer (Thermo Scientific, Waltham, MA, USA) coupled with an Ultimate 3000 system (Thermo Scientific). The procedure of LC-MS/MS was the same as that reported by Chen and Cox et al.12,22,23 Tandem mass spectra were searched against Mascot 2.0 (Matrix Science, London, UK) using a UniProt sequence database.24 A fragment mass tolerance of 0.02 Da and a peptide mass tolerance of 10 ppm were used for both search engines. Raw spectrum data were processed using SEQUEST software to extract peak lists. The obtained peak lists were analyzed using the Proteome Discoverer (Thermo Scientific, version 1.4) against strawberry RNA-seq sequences combined with the sequences of common contaminants, such as human keratins. The false discovery rates (FDR) were set to 0.01. The database we searched for was a transcriptome of the strawberry fruit (the experimental material) spliced by a UniGene protein sequence translated into a protein database consisting all the plant protein sequences blast on the protein database and UniProt comment information.| Sample | Weight (g) | Optical density | Protein concentration (μg μL−1) | Total volume (μL) | Total protein (μg) | Volume of electrophoresis (μL) |
|---|---|---|---|---|---|---|
| a Here, the blank 0 is the initial time, and blank, 1 ppm, 3 ppm, 5 ppm 7/21 are the control, 1 ppm, 3 ppm, and 5 ppm treatment groups at day 7/21, respectively. | ||||||
| Blank 0 | 0.8 | 1.029 | 1.76 | 150 | 264 | 14.23 |
| Blank 7 | 0.8 | 1.058 | 1.96 | 150 | 294 | 12.75 |
| 1 ppm 7 | 1.0 | 1.159 | 2.67 | 150 | 401 | 9.36 |
| 3 ppm 7 | 0.8 | 1.023 | 1.71 | 150 | 257 | 14.61 |
| 5 ppm 7 | 1.0 | 1.173 | 2.77 | 150 | 415 | 9.03 |
| Blank 21 | 0.8 | 1.061 | 1.98 | 150 | 297 | 12.62 |
| 1 ppm 21 | 0.8 | 1.065 | 2.01 | 150 | 301 | 12.46 |
| 3 ppm 21 | 0.8 | 1.115 | 2.36 | 150 | 354 | 10.59 |
| 5 ppm 21 | 1.0 | 1.169 | 2.74 | 150 | 411 | 9.12 |
Using the protein extracted from the strawberry harvested before storage as a denominator, the ratio of the normalised spectral counts from the late storage of the strawberry proteome was compared to assess differential adjustments of proteins in response to treatment. The steps of normalized spectral abundance factor (NSAF) normalization25 are as follows: the first step is to calculate the sum of all proteins in a single sample; the second step, i.e., dividing the SUM value by the largest SUM value in several samples yields a decimal number between 0 and 1 (two reserved bits), which is the coefficient of variation; the third step is getting the original protein signal value, which is the deviation coefficient of each protein sample.
2.6 RNA extraction and quantitative reverse transcription PCR (qRT-PCR) analysis
Based on the differential expressions of protein-related phenylpropanoid synthesis, 21 key proteins in the 5 ppm ozone treatment group and blank group were selected for expression verification using qRT-PCR. The detailed method is described in a previous article12 and special primers were designed using Primer 3.0 software shown in ESI Table S1.†2.7 Statistical analysis
Data statistics and analysis were performed using the same method as a previous article.12 Data were analyzed using analyses of variance (ANOVA) with the SPSS 22 software. The least significant difference (LSD) was calculated to determine significant differences at the 5% level. Bioinformatics analysis was carried out to categorise proteins based on biological processes, cellular components, and molecular functions using annotations in the Protein Analysis Through Evolutionary Relationships (PANTHER) database v 6.1 (http://www.pantherdb.org), which is in compliance with gene ontology standards. Signalling pathway analysis was performed with the tools in the Kyoto Encyclopedia of Genes and Genome database (http://www.genome.jp/kegg/pathway.html). Clusters of orthologous groups category assignment was performed using the local alignment tool BLASTP with ane-value cutoff of <104. Hierarchical clustering analysis was performed with Mev 4.9 software. All the results are expressed as the mean ± S.E.M of three replicates (n = 3). Using a 1.25-fold change (FC) and p-values < 0.05 as the variance for an up- or down-shift in abundance, FC ≥ 1.25 and p < 0.05 were considered to reflect upregulation, while FC ≤ 0.75 and p < 0.05 were considered to reflect downregulation.3. Results
3.1 TFC
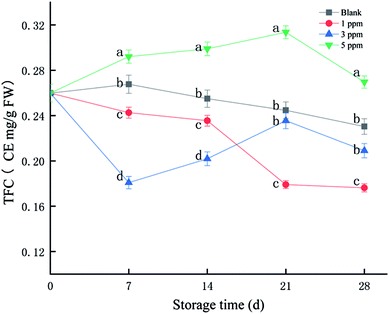
Flavonoids are a class of secondary metabolites that are abundant in plants and have a strong scavenging effect on free radicals. As shown in Fig. 1, TFC of the 5 ppm treatment group accumulated in the first 21 days of storage, reaching the maximum on the 21st day. However, it tended to decrease in the 1 ppm and blank treatment groups. The total flavonoid content was the highest in the 5 ppm group, followed by the blank and 1 ppm groups, and finally the 3 ppm group on day 7; however, TFC in the 3 ppm group exceeded that in the 1 ppm group on the 21st day of storage. The TFC of the 5 ppm group was 0.29 CE mg per g FW on the 7th day, which increased by 12.39% compared with that for the initial time. However, the TFC in the 1 ppm and 3 ppm groups decreased during the first 7 days by 6.65% and 30.41%, respectively. On the 21st day, the total flavonoid content of the 5 ppm treatment group was 0.31 CE mg per g FW and that for the second blank group was 0.24 CE mg per g FW; moreover, the value for the 3 ppm treatment group was 0.23 CE mg per g FW, and the lowest value was found for the 1 ppm treatment group: 0.17 CE mg per g FW. In addition, the TFC content in the 5 ppm treatment group was significantly higher than those in the 1 ppm and 3 ppm treatment groups and blank group during the whole storage time (P < 0.05).3.2 TAC
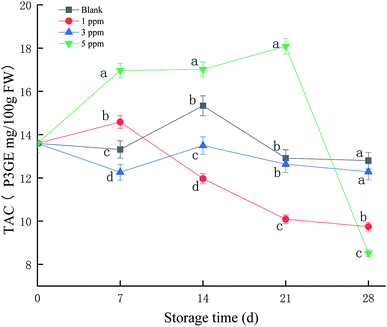
As shown in Fig. 2, TAC in the 5 ppm ozone treatment group continued to increase during the first 21 days of storage, reaching a maximum on the 21st day. The TAC values for the 3 ppm treatment group and blank group did not change significantly throughout the storage period; the maximum values were 13.5 and 15.3 P3GE mg/100 g FW, respectively, on the 14th day of storage. However, the TAC value for the 1 ppm treatment group increased slightly on the 7th day of storage and then continued to decrease, with a peak for 14.5 P3GE mg/100 g FW on the 7th day. Overall, the 5 ppm treatment group promoted the synthesis of anthocyanins in strawberries during storage, especially on the 21st day of storage, and the anthocyanin content was significantly higher than that in the blank group and the 1 ppm and 3 ppm ozone treatment groups (P < 0.05).3.3 TPC
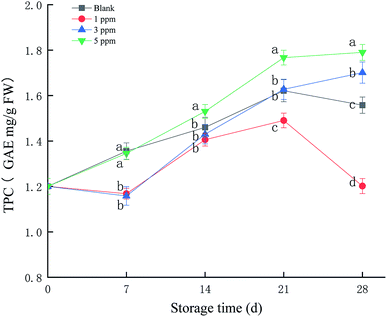
Different fruits have different characteristic phenols, and the main polyphenol in strawberries is p-hydroxybenzoic acid. Phenolic compounds can provide electrons or hydrogen atoms, participate in the scavenging of free radicals and prevent the accumulation of free radicals. As shown in Fig. 3, the total phenolic content (TPC) of the 5 ppm treatment group increased from 1.17 GAE mg per g FW at the beginning of storage to 1.75 GAE mg per g FW at the end of storage, an increase of 49.57%, which was the highest compared with those of the other treatment groups (P < 0.05) during the storage time. TPC in the 3 ppm treatment group was reduced on day 7 and then rapidly accumulated and exceeded the ck and 1 ppm treatment groups on day 21 and 28. The 3 ppm and 5 ppm treatment groups were able to prevent decrease in the total phenolic content in strawberries at the end of storage, and 5 ppm ozone treatment significantly promoted the formation of phenolic compounds.3.4 Protein identification and quantification
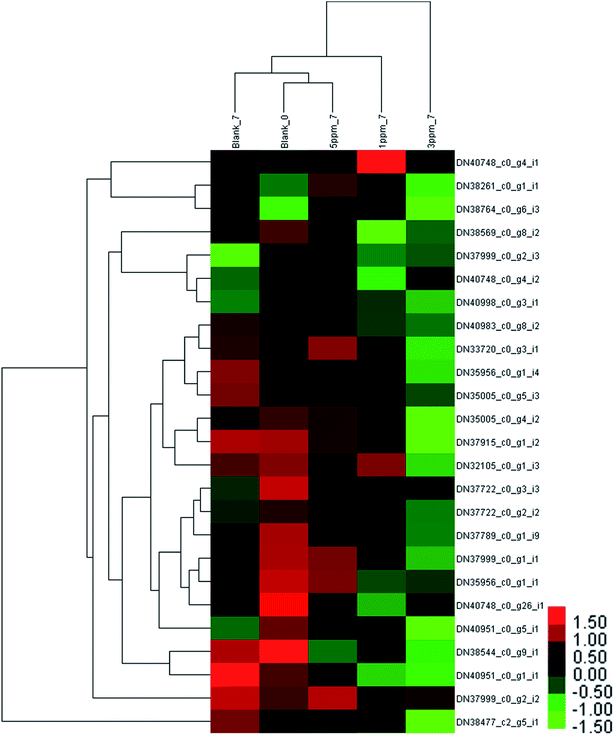
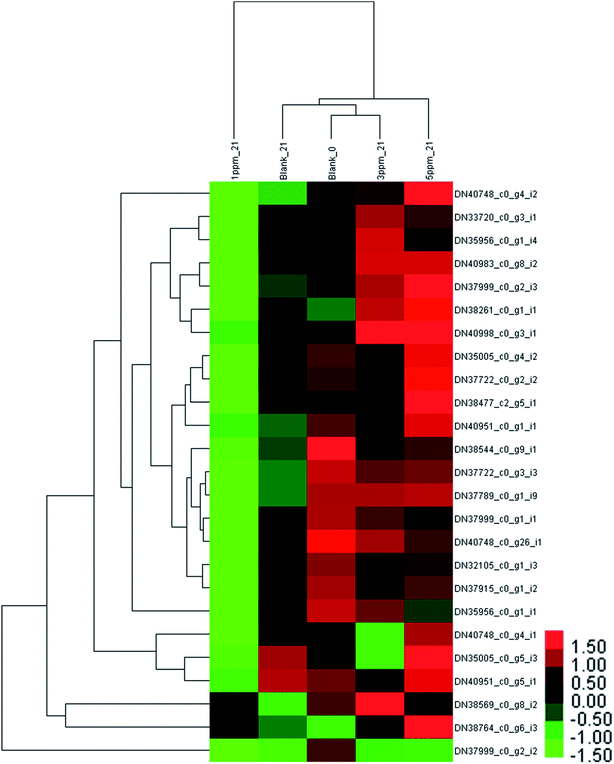
The results of the proteins associated with PAL metabolism between different treatment groups at different storage times are shown in Fig. 4 and 5 and ESI Table S2.†As shown in ESI Table S2,† 21 key proteins associated with PAL biosynthesis were investigated in all the detected proteins. The number of proteins detected as dihydroflavonol reductase (DFR) was 4, and the same number was detected for anthocyanidin synthase (ANS). Also, 6 proteins were related to the synthesis of chalcone and chalcone isomerase, and the numbers of the proteins associated with 4-coumarate, phenylalanine ammonia-lyase, UDP-glucose flavonoid 3-O-glucosyltransferase (3GT), flavanone 3-hydroxylase (F3H), and cinnamate were 2, 1, 1, 2, and 1, respectively.
The difference in the protein expressions associated with phenylpropanoid metabolism in the different treatment groups on the seventh day of storage was evident from Fig. 4. Compared with the initial value, the expressions of 4 proteins were up-regulated and those of 5 proteins were down-regulated in the control group on the seventh day of storage; the amount of 3 proteins in the 5 ppm ozone treatment group increased, and the expression of 2 proteins decreased; the content of the 2 proteins increased, and the expressions of 9 proteins decreased in the 1 ppm ozone treatment group; the expressions of 14 proteins were significantly down-regulated in the 3 ppm ozone treatment group. The protein content associated with phenylpropanoid biosynthesis did not increase significantly in each treatment group on the 7th day, but a significant downward trend in the 1 ppm ozone treatment group and the 3 ppm ozone treatment group was observed.
After storage for 21 days, the clustering heat map of the protein expression levels of each treatment group was obtained, as shown in Fig. 5. There was a significant downward trend in the control group and the 1 ppm ozone treatment group, and the expression levels of 10 proteins in the control group were significantly down-regulated compared with those of 20 in the 1 ppm treatment group. However, the content of 9 proteins in the 5 ppm treatment group significantly increased, and the expression of only one protein was down-regulated compared with the initial value.
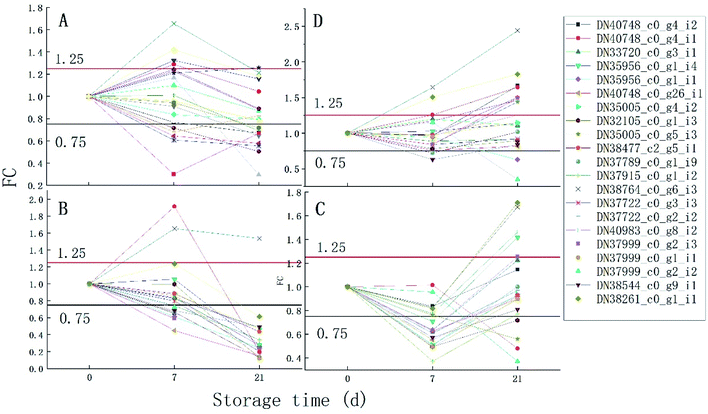
It can be seen from Fig. 6 that the trend of 21 proteins in the control group is unchanged first and then is up-regulated. However, the trend of these proteins in the 1 ppm treatment group was always decreasing, which was first reduced and then increased in the 3 ppm treatment group. There was no significant change in the protein expression in the 5 ppm treatment group on day 7, but it increased significantly on day 21.
Overall, only the 5 ppm ozone treatment group remained at a high level in terms of protein expression throughout the 21 days of storage.
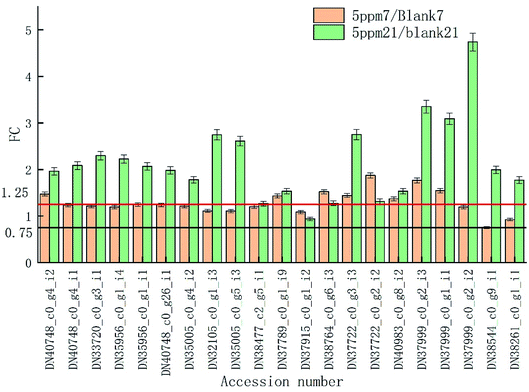
The proteins associated with phenylpropanoid metabolism were detected at the transcriptional level on day 7 and 14 of storage using qRT-PCR. As is shown in Fig. 6, most of the results are consistent with those of the label-free test except DN35005_c0_g5_i3, DN37789_c0_g1_i9, DN38764_c0_g6_i3, and DN40983_c0_g8_i2 on day 7 and DN35956_c0_g1_i4, DN35005_c0_g5_i3, DN37999_c0_g2_i2, DN35956_c0_g1_i1, and DN37915_c0_g1_i2 on day 21. DN37915_c0_g1_i2 did not change in the qRT-PCR results but was up-regulated in the label-free results, while other inconsistent protein results were highly expressed at the RNA levels (Fig. 7).
4. Discussion
Phenolic substances, flavonoids, and anthocyanins are considered to be the primary non-enzymatic antioxidants in plants.26,27 Many studies have found that ozone can induce the secondary metabolites of phenylpropanoid metabolism in plants. Francine et al. found that the leaves of P. edulis are resistant to ozone by accumulating flavonoids.28 Additionally, the accumulation of total phenolics and total flavonoids in postharvest grapes and Ganoderma lucidum is promoted by ozone treatment.29,30 Piyatida et al. found that B. cereus enhances the resistance to O3 by increasing flavonoids in plant tissues.31 Mohammad et al. found that the total phenolic and flavonoid contents of pineapples and bananas increased significantly when exposed to ozone for 20 minutes.32 A majority of the flavonoids in the pericarp of hot peppers increased upon treatment with ozone for 3 hours.7 In this study, TFC, TAC and TPC in the 5 ppm ozone treatment group were higher than those of the other three treatment groups throughout the duration of storage except for the sudden decrease in anthocyanins on the 28th day. The transfer of anthocyanins in fruits and the strong oxidative properties of ozone may be responsible for the rapid decline at the end of storage in the 5 ppm treatment group;33,34 also, high concentrations of ozone treatment can lead to the production of more intermediate free radicals, which can promote the nucleophilic or electrophilic substitution reaction of the ortho and para positions of the aromatic compound with high electron density, resulting in decrease in the anthocyanin content.35 TPC and TFC were maintained at a high level in the 5 ppm treatment group at the end of storage, which may be due to the oxidative metabolism of anthocyanins to phenolic acids and flavonoids.36–38 However, the 3 ppm treatment group and the 1 ppm treatment group did not have an obvious preservation effect compared with the control group; TPC, TAC and TFC in the 3 ppm and 1 ppm ozone treatment groups were significantly lower than that in the control group at day 7 and 21, respectively, which may be because different ozone concentrations induce different metabolic pathways.39Transcriptomics and proteomics can explain the mechanism for the changes in total phenolics, total flavonoids and anthocyanins.14 Li et al. discovered the potential target proteins of gene modification in the breeding program by investigating the protein expression and metabolite profiles of phenolic biosynthesis during the ripening of blueberry fruits.40 Fitzgerald et al. found that the transcription of a large number of phenylpropyl pathway genes in Arabidopsis thaliana L. is stimulated by ozone, which may be an important mechanism for some plants to resist ozone stress.41 The induction of defense-related secondary metabolites and the concomitant increase in the transcript levels of PAL and CHS genes by semi-quantitative RT-PCR gene expression analysis indicated that Liriodendron tulipifera utilized this pathway to partially offset the oxidative damage of ozone.42 The important roles of CHI and CHS, two key flavonoid synthetases, in the phenylpropanoid metabolic pathway have been demonstrated by a large number of studies.43,44 Zhang et al. found that the overexpression of the CHS gene can increase the anthocyanin content in leaves and isoflavonoid biosynthesis in soybeans was stimulated by the expression of CHS8.45,46 There is a positive correlation between the gene expression of CHI and the content of total flavonoids during grape ripening.47 An increase in the CHI transcript level and CHI activity increases the accumulation of flavonoids.48 Phenylalanine ammonia lyase (PAL), cinnamic acid 4-hydroxylase (C4H) and 4-coumaric acid:CoA ligase (4CL) participate in the general phenylpropane pathway.49,50 Dihydroflavonol 4-reductase (DFR), a protein closely related to the anthocyanin content and strawberry coloration,51–53 can catalyze the formation of strawberry leucoanthocyanidin by dihydroflavonols,54,55 and the ANS enzyme catalyzes the production of colored anthocyanins from strawberry proanthocyanidins (especially pelargonidin);56 the F3H enzyme hydroxylates flavanones form 3-hydroxy flavonol, a common precursor of anthocyanins, flavanols, and proanthocyanidins.57
The phenylpropanoid metabolism of ozone-treated strawberries has not been explored at the transcriptomics and proteomics levels. In this study, the expression levels of PAL (DN38544_c0_g9_i1), 4CL (DN37789_c0_g1_i9 and DN37915_c0_g1_i2), C4H (DN38261_c0_g1_i1) and the three CHI (DN33720_c0_g3_i1, DN35956_c0_g1_i4 and DN35956_c0_g1_i1) proteins were lower than those of the control group on the 7th day of storage; the abundances of ANS (DN40983_c0_g8_i2, DN37999_c0_g1_i1) and all 4 proteins identified as DFR (DN35005_c0_g4_i2, DN32105_c0_g1_i3, DN35005_c0_g5_i3 and DN38477_c2_g5_i1) were also less in the 3 ppm treatment group compared with that for the other three groups. This indicated that the phenylpropanoid metabolic pathway was inhibited in the pre-storage phase of the 3 ppm treatment group, resulting in low TPC, TAC, and TFC.
The reason for higher TAC in the 1 ppm treatment group and the 5 ppm treatment group than that in the CK and 3 ppm treatment groups may be because CHS DN40748_c0_g4_i1 in the 1 ppm treatment group, CHS (DN40748_c0_g4_i2) in the 5 ppm treatment group, and F3H (DN37722_c0_g3_i3 and DN37722_c0_g2_i2) in the two treatment groups were higher than those in the control group and the 3 ppm treatment group.
On the 21st day of storage, TPC, TAC and TFC in the 1 ppm treatment group were significantly lower than those in the other three treatment groups, which was consistent with the results of proteomics except for DN38764_c0_g6_i3 and DN38544_c0_g9_i1. The expressions of most proteins in the 3 ppm treatment group and the 5 ppm treatment group were higher than that in the control group. However, TAC and TFC in the 3 ppm treatment group were still lower than those in the control group, which may be because very little precursor substances accumulated in the early stage.
Interestingly, TFC and TAC of strawberries in the 5 ppm treatment group were significantly higher than those in the other three groups on the 7th and 21st day of storage, but the number and type of higher abundance proteins in the 5 ppm treatment group were different compared to those of the other three treatment groups. This indicated that the effect of ozone on the phenylalanine metabolic pathway of postharvest strawberries is a complex regulation process, and the change in ozone concentration has different stimulating effects on the key genes related to phenylpropanoid metabolism in postharvest strawberries. In addition, 0.3 ppm ozone water and 5 ppm ozone gas could promote the accumulation of TPC, but the ozone gas concentration at 5000 mg L−1 reduced the phenolic contents and procyanidins; this may be observed because different ozone forms have different suitable concentrations for strawberry fresh-keeping, and a very high ozone concentration may directly oxidize the antioxidants of the postharvest strawberries.36,58 These results indicated that it is necessary to explore the appropriate concentration of ozone for the preservation of different fruits and vegetables, which was emphasized in the review by Glowacz et al.59,60
In general, the production of total phenol, total flavonoids and total anthocyanins in postharvest strawberry phenylpropanoid metabolites was significantly promoted in the 5 ppm ozone treatment group compared with that in the other three treatment groups, and the conclusions of proteomics were also consistent with these results; this indicated that a suitable concentration of ozone produces a higher level of antioxidant secondary metabolites by inducing the expression of key proteins in the metabolic pathway of phenylpropanoid–anthocyanin.
Conflicts of interest
The authors declare there is no competing financial interest.Acknowledgements
This work was supported by National Natural Science Foundation of China Youth Science Fund Project (31501547); 13th Five Key Research and Development of China (2016YFD0400903-05, 2018YFF0213605-2); the Innovation Team of the Tianjin Forestry & Pomology Research System (ITTFPRS2018009); Tianjin Science and Technology Plan (17YFYZCG00010, 16ZXZYNC00070); Tianjin Natural Science Foundation Youth Project (16JCQNJC14800); Tianjin Agricultural Science and Technology Achievements Transformation and Promotion Project (201701100, 201602090); Tianjin Academy of Agricultural Sciences Dean's Fund (17014, 17012).References
- M. Glowacz, R. Colgan and D. Rees, J. Sci. Food Agric., 2015, 95(4), 662–671 CrossRef CAS PubMed.
- Y. Jiawei, L. Zisheng, B. Zhaojun, L. Hongyan, L. Dong and Y. Dongmei, Postharvest Biol. Technol., 2019, 147, 29–38 CrossRef.
- F. Giampieri, J. Alvarez-Suarez, M. Gasparrini, T. Y. Forbes-Hernandez, S. Afrin and S. Bompadre, et al., Food Chem. Toxicol., 2016, 94(8), 128–137 CrossRef CAS PubMed.
- I. Lara, P. García and M. Vendrell, Sci. Hortic., 2006, 109(1), 48–53 CrossRef CAS.
- M. S. Aday, M. B. Büyükcan, R. Temizkan and C. Caner, Ozone: Sci. Eng., 2014, 36(1), 43–56 CrossRef CAS.
- Z. Hongyin, M. Longchuan, J. Song, D. Ying and Z. Xiaodong, Trans. Chin. Soc. Agric. Eng., 2009, 25(5), 258–263 Search PubMed.
- E. M. C. Alexandre, D. M. Santos-Pedro, T. T. S. BrandãO and C. L. M. Silva, J. Food Eng., 2011, 105(2), 277–282 CrossRef CAS.
- H. Ikeura, F. Kobayashi and M. Tamaki, J. Hazard. Mater., 2011, 186(1), 956–959 CrossRef CAS PubMed.
- M. S. Aday and C. Caner, LWT--Food Sci. Technol., 2014, 57(1), 344–351 CrossRef CAS.
- A. Emc, B. Trs and S. Clm, J. Food Eng., 2012, 108(3), 417–426 CrossRef.
- A. Allende, M. Alicia, B. Begoña, T. Francisco and M. I. Gil, Postharvest Biol. Technol., 2007, 46(3), 201–211 CrossRef CAS.
- C. Chen, X. Zhang, H. Zhang, Z. Ban, L. Li and C. Dong, et al., RSC Adv., 2019, 9, 676–689 RSC.
- A. C. Allan, R. P. Hellens and W. A. Laing, Trends Plant Sci., 2008, 13(3), 99–102 CrossRef CAS PubMed.
- T. Vogt, Phenylpropanoid biosynthesis, Mol. Plant, 2010, 3(1), 2–20 CrossRef CAS PubMed.
- L. Miao, Y. Zhang, X. Yang, J. Xiao, H. Zhang and Z. Zhang, et al., Food Chem., 2016, 207(15), 93–100 CrossRef CAS PubMed.
- J. Song, L. Du, L. Li, W. Kalt, L. C. Palmer and S. Fillmore, et al., J. Proteomics, 2015, 122, 1–10 CrossRef CAS PubMed.
- W. Xu, H. Peng, T. Yang, B. Whitaker, L. Huang and J. Sun, et al., Plant Physiol. Biochem., 2014, 82, 289–298 CrossRef CAS PubMed.
- J. Zhishen, T. Mengcheng and W. Jianming, Food Chem., 1999, 64(4), 555–559 CrossRef CAS.
- F. Xu, L. Shi, W. Chen, S. Cao, X. Su and Z. Yang, Sci. Hortic., 2014, 175, 181–186 CrossRef CAS.
- S. Cao, Z. Hu, Y. Zheng, Z. Yang and B. Lu, Food Chem., 2011, 125(1), 145–149 CrossRef CAS.
- K. Slinkard and V. L. Singleton, Am. J. Enol. Vitic., 1977, 28(1), 49–55 CAS.
- J. Cox, N. Neuhauser, A. Michalski, R. A. Scheltema, J. V. Olsen and M. Mann, J. Proteome Res., 2011, 10(4), 1794–1805 CrossRef CAS PubMed.
- J. Cox and M. Mann, Nat. Biotechnol., 2008, 26(12), 1367 CrossRef CAS PubMed.
- K. Eitner, U. Koch, T. Gaweda and J. Marciniak, Bioinformatics, 2010, 26(23), 2933–2935 CrossRef CAS PubMed.
- M. Q. Dong, J. D. Venable, N. Au, T. Xu, S. K. Park and D. Cociorva, Science, 2007, 317(5838), 660–663 CrossRef CAS PubMed.
- F. Brahmi, B. Mechri, S. Dabbou, M. Dhibi and M. Hammami, Ind. Crops Prod., 2012, 38, 146–152 CrossRef CAS.
- K. E. Olagaray and B. J. Bradford, Anim. Feed Sci. Technol., 2019, 251(5), 21–36 CrossRef CAS.
- F. F. Fernandes, M. P. Esposito, M. R. G. da Silva Engela, P. Cardoso-Gustavson, C. M. Furlanand and Y. Hoshika, et al., Sci. Total Environ., 2019, 656, 1091–1101 CrossRef CAS PubMed.
- M. Margherita, P. Milena, F. Roberto, Z. Luigi, S. Marco and M. Fabio, Food Res. Int., 2018, 112(10), 369–377 Search PubMed.
- S. Sudheer, W. K. Yeoh and S. Manickam, Postharvest Biol. Technol., 2016, 117, 81–88 CrossRef CAS.
- P. Pheomphun, C. Treesubsuntorn, P. Jitareerat and P. Thiravetyan, Ecotoxicol. Environ. Saf., 2019, 171(4), 805–812 CrossRef CAS PubMed.
- M. Alothman, B. Kaur, A. Fazilah, R. Bhat and A. A. Karim, Innovative Food Sci. Emerging Technol., 2010, 11(4), 666–671 CrossRef CAS.
- M. Sachadyn-Król, M. Materska, B. Chilczuk, M. Karaś, A. Jakubczyk, I. Peruckaa and I. Jackowska, Food Chem., 2016, 211(11), 59–67 CrossRef PubMed.
- S. R. Segade, M. A. Paissoni, S. Giacosa, A. B. Bautista-Ortín, E. Gómez-Plaza, V. Gerbi and L. Rolle, Food Chem., 2019, 271, 673–684 CrossRef PubMed.
- R. Bossuyt, Milchwissenschaft, 1978, 33, 11–13 CAS.
- B. K. Tiwari, C. P. O'Donnell, A. Patras, N. Brunton and P. J. Cullen, Food Chem., 2009, 113(4), 1119–1126 CrossRef CAS.
- M. Özkan, Food Chem., 2002, 78(4), 499–504 CrossRef.
- G. Hrazdina and A. J. Franzese, Phytochemistry, 1974, 13(1), 231–234 CrossRef CAS.
- R. L. Heath, Environ. Pollut., 2008, 155, 453–463 CrossRef CAS PubMed.
- X. Li, J. Liang, X. Pan, L. Yang and W. Guo, Food Chem., 2019, 290(8), 216–228 CrossRef CAS PubMed.
- F. L. Booker, K. O. Burkey and A. M. Jones, Plant, Cell Environ., 2012, 35(8), 1456–1466 CrossRef CAS PubMed.
- E. Pellegrini, A. Campanella, L. Cotrozzi, M. Tonelli, C. Nali and G. Lorenzini, Environ. Sci. Pollut. Res., 2017, 25(3), 8148–8160 Search PubMed.
- Y. Wang, J. Li and R. Xia, Sci. Hortic., 2010, 125(2), 110–116 CrossRef CAS.
- Y. Wang, Y. Dou, R. Wang, X. Guan, Z. Hu and J. Zheng, Gene, 2017, 635(7), 16–23 CrossRef CAS PubMed.
- X. H. Zhang, X. T. Zheng, B. Y. Sun, C. L. Peng and W. S. Chow, Environ. Exp. Bot., 2018, 154, 33–44 CrossRef CAS.
- J. Yi, M. R. Derynck, X. Li, P. Telmer, M. Frédéric and S. Dhaubhadel, Plant J., 2010, 62(7), 1019–1034 CAS.
- W. Wang, H. L. Wang, S. B. Wan, J. H. Zhang, P. Zhang, J. C. Zhan and W. D. Huang, Biol. Plant., 2012, 56(3), 545–550 CrossRef CAS.
- H. C. Zhang, J. M. Liu, H. Y. Lu and S. L. Gao, Plant Cell Rep., 2009, 28(8), 1205–1213 CrossRef CAS PubMed.
- R. Zhai, Z. Wang, S. Zhang, G. Meng, L. Song, Z. Wang, P. Li, F. Ma and L. Xu, J. Exp. Bot., 2016, 67(5), 1275–1284 CrossRef CAS.
- C. Camila, D. Thomas, C. Alvaro, K. Sebastian, S. Ronan, L. Andrea, S. Dirk, F. R. Alisdair, W. Lothar and H. A. Matthew, Plant J., 2011, 67(5), 869–884 CrossRef PubMed.
- Y. Chu, J. Pan, A. Wu, R. Cai and H. Chen, Sci. Hortic., 2014, 165, 398–403 CrossRef CAS.
- C. D. Viljoen, M. C. Snyman and J. J. Spies, S. Afr. J. Bot., 2013, 87, 18–21 CrossRef CAS.
- P. Petit, T. Granier, B. Langlois d'Estaintot, C. Manigand, K. Bathany and J. M. Schmitter, et al., J. Mol. Biol., 2007, 368(5), 1345–1357 CrossRef CAS PubMed.
- F. Henryk, H. Heidi, T. Dieter, R. Klaus, H. Magda-Viola, S. Iris, G. Christian, S. Karl and F. C. Thilo, Plant Physiol. Biochem., 2011, 51, 18–25 Search PubMed.
- D. K. Owens, K. C. Crosby, J. Runac, B. A. Howard and B. S. J. Winkel, Plant Physiol. Biochem., 2008, 46(10), 833–843 CrossRef CAS PubMed.
- S. Lunkenbein, M. Bellido, A. Aharoni, E. M. J. Salentijn, R. Kaldenhoff, H. A. Coiner, M. O. Juan and S. Wilfried, Plant Physiol., 2006, 140(3), 1047–1058 CrossRef CAS PubMed.
- Y. Han, K. Huang, Y. Liu, T. Jiao, G. Ma, Y. Qian, P. Wang, X. Dai, L. Gao and T. Xia, Gene, 2017, 8, 300 CrossRef PubMed.
- R. Criegee, Angew. Chem., Int. Ed. Engl., 1975, 14(11), 745–752 CrossRef.
- M. Glowacz and D. Rees, J. Sci. Food Agric., 2016, 96(14), 4637–4643 CrossRef CAS PubMed.
- M. Glowacz, R. Colgan and D. Rees, J. Sci. Food Agric., 2015, 95(4), 662–671 CrossRef CAS PubMed.
Footnote |
| † Electronic supplementary information (ESI) available. See DOI: 10.1039/c9ra03988k |
| This journal is © The Royal Society of Chemistry 2019 |

