DOI:
10.1039/C9RA04316K
(Paper)
RSC Adv., 2019,
9, 34351-34358
Detoxification of DON by photocatalytic degradation and quality evaluation of wheat†
Received
9th June 2019
, Accepted 10th October 2019
First published on 25th October 2019
Abstract
Deoxynivalenol (DON) is regarded as the most common contaminant of cereal grains. Therefore, finding an efficient and safe detoxification technology is of great significance in the field of food. In this study, upconversion nanoparticles@TiO2 composites were used for the photocatalytic degradation of DON in wheat. The effect of photocatalytic oxidation on wheat quality was also evaluated by studying the basic physical and chemical indexes of wheat. The results showed that the removal rate of DON in wheat could reach 72.8% within 90 min when the dosage of photocatalyst UCNP@TiO2 was 8 mg mL−1 and the ratio of wheat to liquid was 1![[thin space (1/6-em)]](https://www.rsc.org/images/entities/char_2009.gif) :2. In addition, the composites can be easily removed by washing, thus ensuring the low exposure dose of the nanomaterials in wheat. Studies on the nutritional quality of wheat showed that photocatalytic technology had little effect on the starch, protein, amino acid content of wheat (p > 0.05). The whiteness of wheat flour decreased and the yellowness increased. The scanning electron microscopy (SEM) images of wheat starch showed that the surfaces of starch granules were damaged to varying degrees with the prolongation of illumination time. Meanwhile, the fatty acid value and wet gluten content and pasting properties of wheat decreased significantly during photocatalysis (p < 0.05). This study demonstrates that photocatalytic degradation will have a promising prospect in toxin removal.
:2. In addition, the composites can be easily removed by washing, thus ensuring the low exposure dose of the nanomaterials in wheat. Studies on the nutritional quality of wheat showed that photocatalytic technology had little effect on the starch, protein, amino acid content of wheat (p > 0.05). The whiteness of wheat flour decreased and the yellowness increased. The scanning electron microscopy (SEM) images of wheat starch showed that the surfaces of starch granules were damaged to varying degrees with the prolongation of illumination time. Meanwhile, the fatty acid value and wet gluten content and pasting properties of wheat decreased significantly during photocatalysis (p < 0.05). This study demonstrates that photocatalytic degradation will have a promising prospect in toxin removal.
Introduction
Deoxynivalenol (DON) is the metabolite of Fusarium graminearum, the pathogen of wheat scab and is the most common mycotoxin in cereals.1 Grain contaminated by DON will greatly reduce its yield and nutrient quality value, which will cause serious losses to the agricultural economy. DON has neurotoxicity, cytotoxicity, teratogenicity and carcinogenicity, and can cause liver and kidney tissue damage and immunosuppression.2,3 Human consumption of cereals and their products contaminated by DON toxin can cause diarrhea, vomiting and other symptoms, and serious cases can cause acute or chronic poisoning, which threatens human health. Therefore, the pollution of DON on cereals and their products has become a problem that cannot be ignored. In recent years, China's food security problems caused by DON pollution have caused hundreds of millions in economic losses, so it is necessary to study safe, economic and efficient technologies to inhibit fungal growth and remove DON from wheat grains.
Photocatalytic technology has many advantages, such as complete mineralization of degraded products, no waste disposal problem, mild reaction conditions and low cost.4 Among photocatalysts, TiO2 has attracted extensive attention and research because of its stability, nontoxicity and high catalytic activity. Photocatalysts can produce electron–hole pairs under the irradiation of light. They can react with oxygen and water molecules in the system to produce strong oxidative free radicals, such as OH and O2−. After that, free radicals could act on pollutants and mineralize them. However, due to the defect of the wide band gap of TiO2 itself, it can only play a photocatalytic activity under UV light. Therefore, it is necessary to modify TiO2 to further improve its utilization of sunlight.
Upconversion material is a type of luminescent nanomaterial that can convert low-energy photons into high-energy photons. By compounding upconversion nanoparticles with TiO2, the defect of TiO2 could be solved and the degradation efficiency can be improved. At the same time, our previous work has proved that the UCNP@TiO2 composite can exhibit higher photocatalytic activity than pure TiO2 under simulated sunlight irradiation.5,6 At present, photocatalytic degradation has been widely used in the field of food disinfection, the keeping fresh of fruit and vegetable and prolonging the storage period of food. Maneerat7 explored the inhibitory effect of TiO2 on Penicillium in fruits. The results showed that TiO2 coating could effectively inhibit fruit decay, after storage for one week; TiO2 coating was the only treatment without obvious tomato decay. The UV treatment with TiO2, UV irradiation, sodium hypochlorite (NaOCl) treatment and tap water treatment were compared. The results showed that the growth rate of microbial flora in samples treated by UV treatment with TiO2 was lower than that of other treatment during 9 days of storage.8
Because of the complexity of food ingredients, the free radicals produced by photocatalyst will react directly or indirectly with the components in wheat after illumination, which may cause changes in the nutritional components of wheat. Li9 found that the peak viscosity and setback value of wheat decreased after 4 h of treatment with different ozone concentration. Chen10 used ozone to degrade AFB1 in peanuts. The results showed that the degradation rate of AFB1 reached 65.9% after 6 mg L−1 ozone for 30 min. It also proved that ozone treatment had no significant effect on the fatty acid value of peanuts. Gecgel11 also reported that irradiation does not cause significant changes in the fatty acid value of nuts. Abramson12 applied alkali treatment (1 mol L−1 sodium carbonate solution) to the DON contaminated samples. The DON content in the samples approached zero after 8 days. However, it may have adverse effects on the nutritional value of feed and food while reducing the amount of toxin. At present, there is a lack of research on the changes in physicochemical properties, nutritional quality, and processing properties of wheat after photocatalytic treatment. Therefore, the purpose of this study is to explore the effect of photocatalytic technology on the detoxification of DON in wheat and to evaluate the effect of photocatalytic technology on wheat quality, such as starch, fatty acids and other qualities. Finally, it can provide a basis for evaluating the feasibility of photocatalytic technology in eliminating DON in wheat.
Materials and methods
Materials
Yttrium chloride hexahydrate (YCl3·6H2O), ytterbium(III) chloride hexahydrate (YbCl3·6H2O), and thulium(III) chloride hexahydrate (TmCl3·6H2O) were purchased from J & K Scientific Ltd. Ammonium fluoride (NH4F), sodium hydroxide (NaOH), oleic acid (OA), sodium chloride (NaCl), potassium sulfate (K2SO4), cupric sulfate (CuSO4·5H2O), sulfuric acid (H2SO4), boric acid (H3BO3), sodium hydroxide (NaOH), benzene, methanol and cyclohexane were obtained from Sinopharm Chemical Reagent Co., Ltd. (Shanghai, China). DON (analytical standard, purity 99%) used as the standard was purchased from Sigma-Aldrich (St. Louis, MO, USA). An ultrapure water of resistivity 18.2 MΩ cm−1 was used in the subsequent experiments. All the chemicals were used as received without further purification.
Photocatalytic degradation of DON standard
UCNP@TiO2 composite was prepared by high temperature thermal decomposition method (see Fig. S1†) and the photocatalytic activity of the composite was proved under the condition of full wavelength (200–2500 nm). First, accurately weighed solid portions of DON were dissolved into ultrapure water to prepare a 1000 μg mL−1 stock solution, and the standard working solutions (10 μg mL−1) of DON were prepared by diluting the stock solution. In a typical experiment, 18 mg of photocatalyst was dispersed into a glass tube containing 3 mL of DON standard working solution. At the same time, the blank group without photocatalyst was used as control. It was stirred and kept in the dark to establish the adsorption–desorption equilibrium of DON and the surface of the UCNP@TiO2 particles before irradiation. A 50 W Xe lamp was used as the simulated sunlight. Subsequently, 0.2 mL of DON solution was extracted at certain time intervals and centrifuged to remove the photocatalyst. The concentration of the DON solution was analyzed by the UPLC-TQD MS system. The photocatalytic degradation rate of DON was obtained by calculating the ratio of DON concentration C to initial concentration C0.
Photocatalytic degradation of DON in wheat
The DON concentration of naturally polluted wheat reached 2.89 μg g−1. UCNP@TiO2 with 6 mg mL−1 and 8 mg mL−1 being added into the wheat (5 g) respectively. The ratio of wheat grain to liquid was 1:1, stirred with a glass rod to make the material fully contact with the wheat and was then irradiated with a Xe lamp (200–2500 nm). To determine the degradation rate of DON in wheat samples, and 5 mL of acetonitrile water (84:16) solution was added to the sampled wheat, and shaken at 25 °C for 40 min to extract DON from the wheat. The nanocomposites and wheat were precipitated to the bottom of the tube by centrifugation, and the supernatant was collected. NaCl was added to the filtrate to remove impurities such as proteins and other macromolecules, and the supernatant was collected by centrifugation. After N2 drying, it was redissolved with 1 mL of deionized water. Then, the concentration of the solution was detected by the UPLC-TQD MS system. After photocatalytic degradation, deionized water of the same volume as the previous solution was added to wash away the nanocomposites. After shaking, the fluorescence intensity of the detergent was measured.
Determination of basic physicochemical indexes of wheat
The starch content of flour was estimated using Megazyme kits (SuZhou Comin Biotechnology Co., Ltd., China). Fatty acid values were determined in accordance with the Chinese National Standard GB/T 5510-2011. The protein content of wheat was determined according to the AOAC 979.09 by using nitrogen with a protein conversion of (N) × 5.70 (Kjeldahl determination).
Determination of amino acids in wheat flour
Wheat flour of 100 mg and 8 mL 6 M HCl were added into the hydrolysis tube and shaken well to make the wheat flour fully wet. N2 was filled into the hydrolysis tube to bring the solution to slightly boiling and the cap of the hydrolysis tube was tightened. The hydrolysis tube was put into an oven at 120 °C and hydrolyzed for 22 h. Subsequently, the sample in the tube was transferred to the test tube, 4.8 mL 10 M NaOH were added, and the volume was fixed to the calibration line with deionized water. The liquid in the volumetric bottle was filtered, filtrate was collected and centrifuged, and 400 μL supernatant was put into the liquid sample bottle. Determination of amino acids was conducted by HPLC.
Determination of the wet gluten content of wheat flour
Wheat flour of 10 g (m1) was added into a 5 mL NaCl solution and stirred continuously until dough was formed. The dough was rinsed with NaCl solution for 8 min and kneaded continuously. Then, it was rinsed and kneaded with tap water until the starch was washed. Finally, the free water in the gluten was removed by extrusion with clean glass sheet and gluten weight m2 was recorded. The wet gluten content of wheat flour was (m2/m1) × 100.
Determination of the chromaticity of wheat flour
The color of the wheat flour samples was evaluated using Ultra Scan Pro 1166 (Hunterlab, USA). First, the instrument was calibrated with calibration standard black and white board. After calibration, the color of wheat flour was expressed by CIE-L*a*b* Chroma system. The value of L* represents the brightness of the color, the value of a* represents the whiteness of the color, and the value of b* represents the yellowness of the color.
Determination of the pasting properties of wheat flour
The pasting properties of wheat flour were determined with the Chinese National Standard GB/T 24853-2010 using the rapid visco analyzer (RVA 4500, Perten, Australia). The standard profile 1 of the RVA was employed. A total of 4 g of wheat flour was weighed in the sample tube and 25 mL of deionized water was added. The samples were dispersed by agitating them up and down. The sample was heated from 50 °C to 95 °C and kept for 4 min, and then cooled to 50 °C. The total process is 13 min.
Results and discussion
Photocatalytic experiment
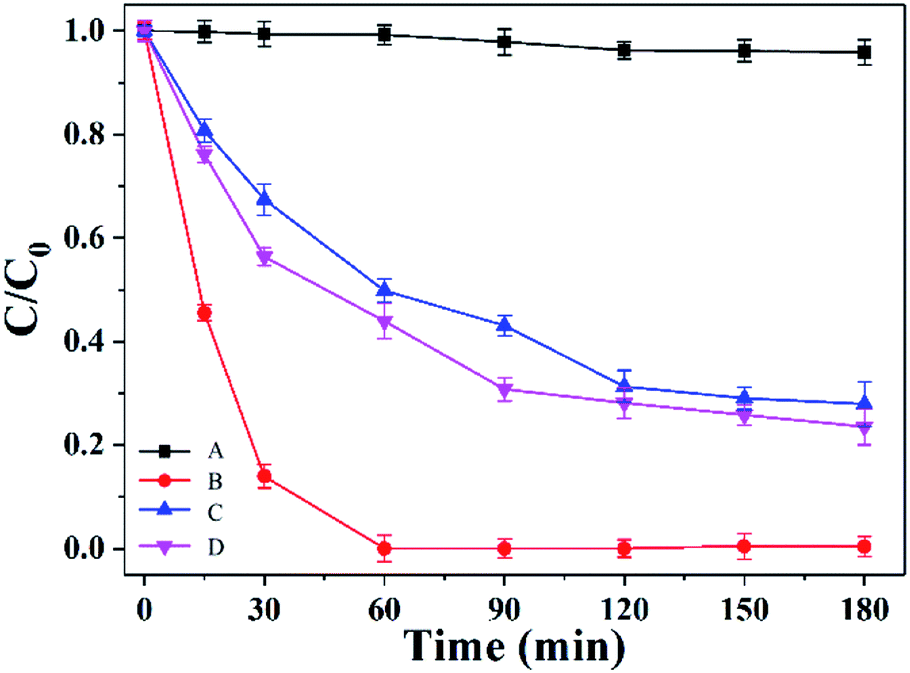
Fig. 1 is the degradation effect of the photocatalyst on the DON standard and DON in wheat. It can be seen that the degradation rate of DON increases gradually with time. After 60 min, the degradation rate of DON standard reached 100%, while the concentration of DON in the blank group (without photocatalyst) hardly changed, which indicated that DON was stable under Xe lamp irradiation. The decrease in DON concentration was caused by photocatalysis of composite materials. Under the same conditions, the degradation rate of DON in wheat was lower than that of the DON standard, which may be due to the combination of DON with protein, starch and other macromolecules in wheat, affecting the degradation effect. However, because of the shielding effect of wheat grains, light cannot be uniformly distributed on the contaminated wheat, which will also affect the degradation efficiency. At the same time, this Fig. 1 shows that the degradation rate of DON in wheat by 8 mg mL−1 UCNP@TiO2 is higher than that by 6 mg mL−1 UCNP@TiO2. At 90 min, the removal rate of DON by 8 mg mL−1 UCNP@TiO2 could reach 69.2%. Composite materials used in photocatalytic treatment are nanoscale, so they are easily washed away by water and will not remain in wheat.
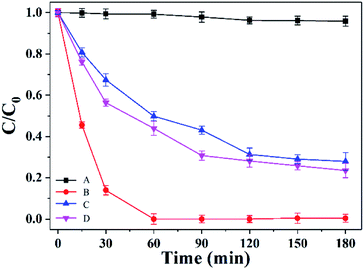 |
| | Fig. 1 Photocatalytic degradation of DON without photocatalyst (A), degradation of DON standard by 6 mg mL−1 UCNP@TiO2 (B), degradation of DON in wheat by 6 mg mL−1 UCNP@TiO2 (C), degradation of DON in wheat by 8 mg mL−1 UCNP@TiO2 (D). | |
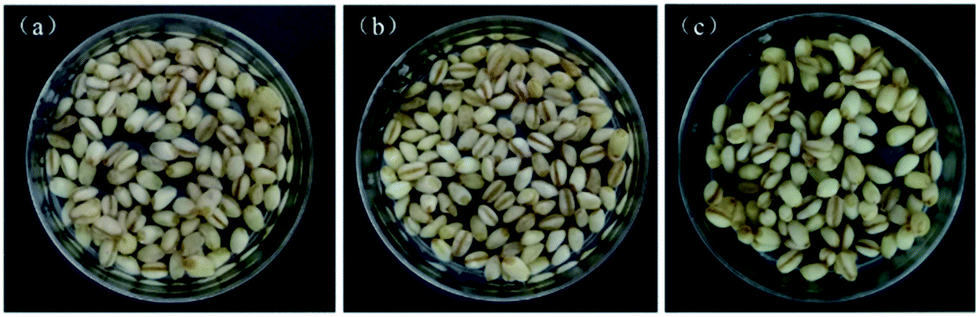
Although DON was still degraded after 90 min, the degradation rate tended to be flat. Considering the economic effect and the influence of light on wheat quality, the condition of photocatalytic degradation was set at 8 mg mL−1 for 90 min. There is no obvious change from the appearance after illumination and photocatalysis (in Fig. 2).
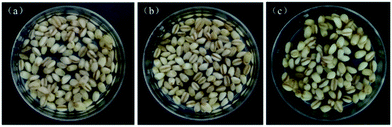 |
| | Fig. 2 Wheat samples before illumination (a), wheat samples after illuminated for 90 min (b), wheat samples after photocatalysis for 90 min (c). | |
Effect of wheat–liquid ratio
To improve the degradation efficiency, the wheat–liquid ratio was optimized to find the best ratio between wheat and nanocomposite solution. UCNP@TiO2 composite solution of 5 mL, 10 mL, 15 mL, and 20 mL were added into the wheat respectively, so that the ratio of wheat grain to liquid was 1:(1–4). Fig. 3 shows that when the ratio of material to liquid is 1:2, the degradation efficiency of DON in wheat is the highest, reaching 72.8%. When the liquid volume is too large, the proteins and starches in the food matrix may dissolve in the solution. These substances could react with the free radicals produced by photocatalysis, which may protect DON and reduce the damage caused by free radicals. In addition, due to the high content of protein and starch in the solution, it may block the contact between light and UCNP and reduce the number of free radicals produced. Although the differences between 1:2 and 1:3 are not significant, considering the economic factors and the highest degradation rate of 1:2, the optimum ratio of wheat to liquid is 1:2 in the photocatalytic process.
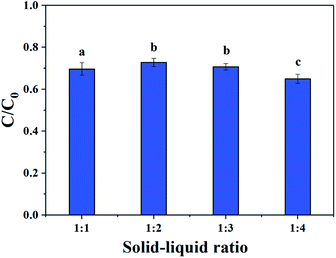 |
| | Fig. 3 Effect of wheat–liquid ratio on DON degradation in wheat. Significant difference in different letters between groups. | |
Residue of photocatalyst in wheat
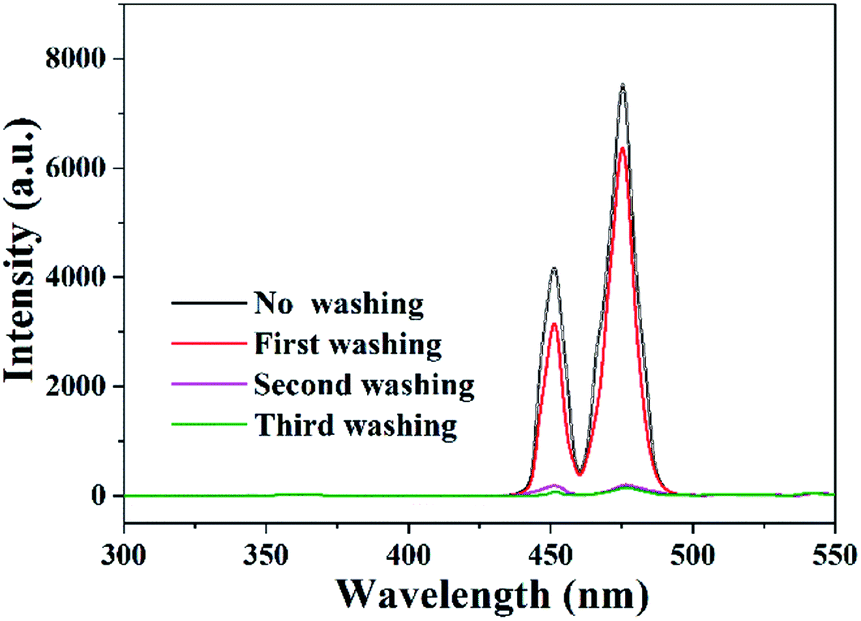
Due to the good water solubility of UCNP@TiO2 composites, they can be easily washed away by water flow after being applied to actual samples, and there will be no large amount of materials remaining in actual wheat samples. To verify that the final exposure dose of nanocomposites to wheat grains was very low, wheat was washed after photocatalytic degradation. From Fig. 4, it can be seen that the fluorescence intensity decreased with the washing time, and hit a low level after washing two and three times. It indicated that UCNP@TiO2 composites can be dramatically moved away from wheat after washing once, and completely separated from wheat after washing twice.
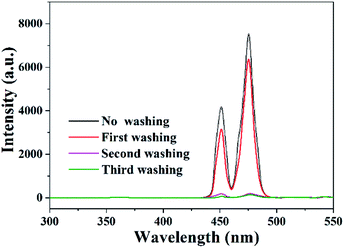 |
| | Fig. 4 Fluorescence intensity of composites separated from wheat seeds. | |
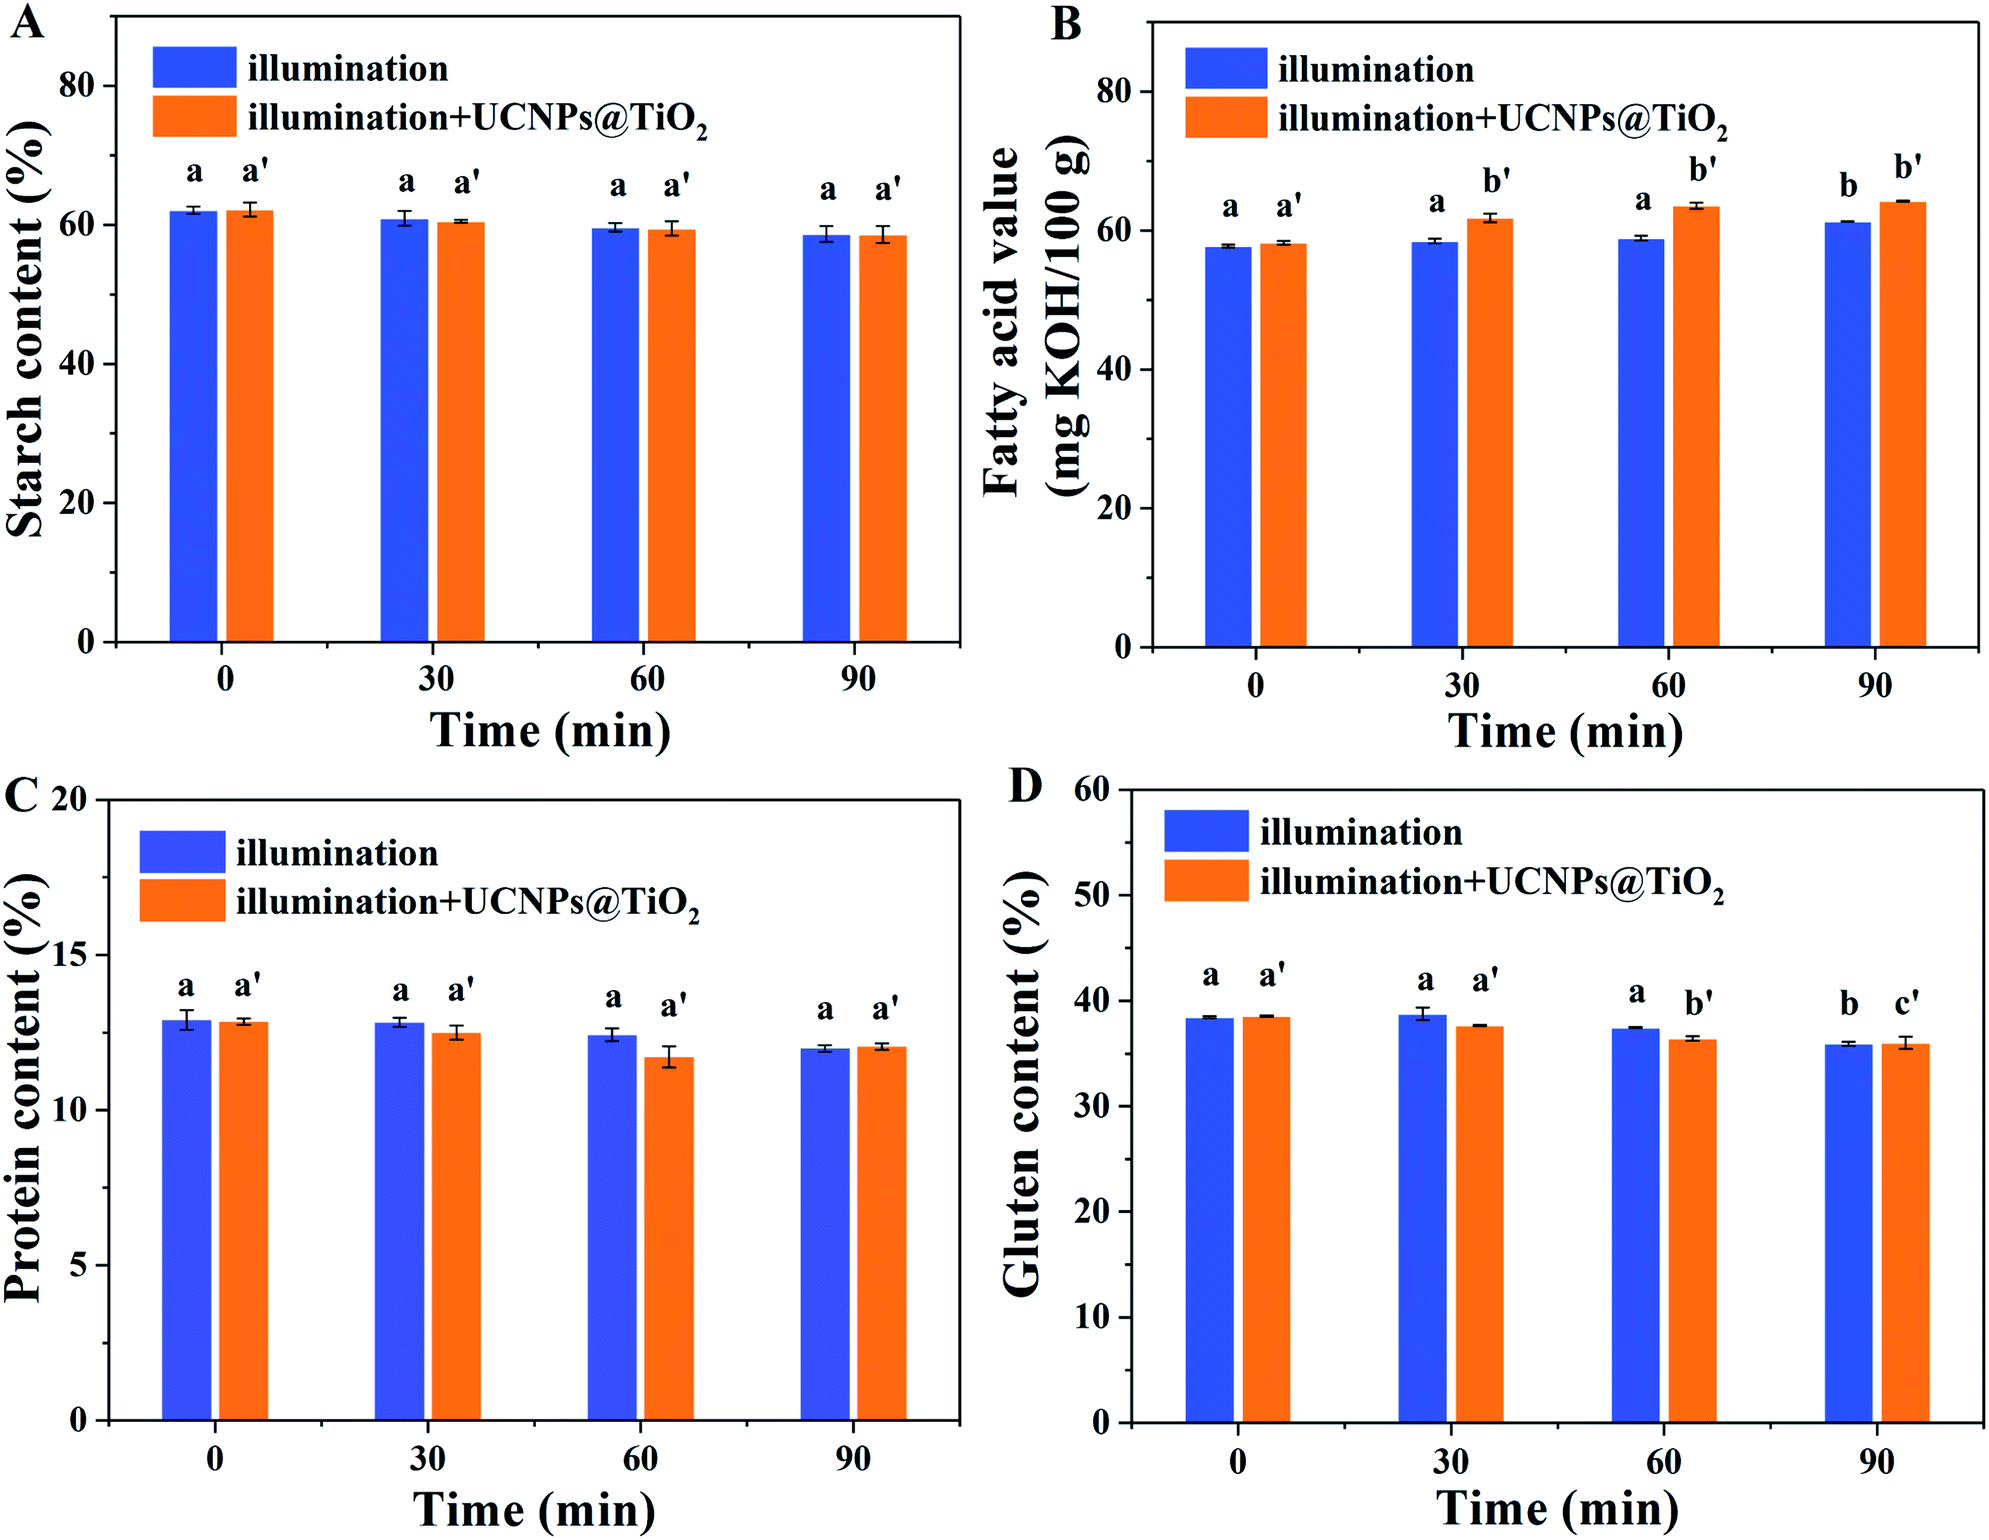
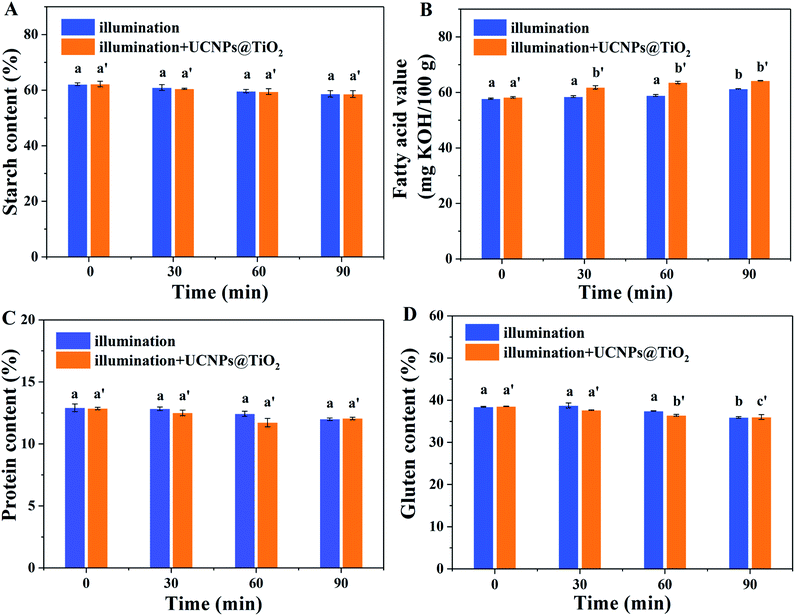
Effect of photocatalytic technology on the starch content of wheat
Starch is the most abundant component in wheat grains, accounting for approximately 70% and is the main source of human energy. Starch in wheat grains in the form of starch grains exists in endosperm cells. Amylose accounted for approximately 1/4, and amylopectin accounted for approximately 3/4.13 Fig. 5A shows that with the extension of illumination time, there is no significant difference in starch content between the control group with only illumination and the experimental group with composite material illumination. The starch content of wheat decreased by 3.89% in the control group and 5.81% in the experimental group. The difference between the experimental group and the control group may be due to the free radicals released by the composite after irradiation, which can further depolymerize starch and then decrease starch content. Hydroxyl groups in glucose molecule can be oxidized to carbonyl and carboxyl groups. Increasing carboxyl content can improve starch swelling potential and affect starch gelatinization properties.14
 |
| | Fig. 5 Effect of photocatalytic technology on starch content (A), fatty acid value (B), protein content (C) and gluten content (D) of wheat. Significant difference in different letters between groups. | |
Effect of photocatalytic technology on the fatty acid value of wheat
There is a small amount of lipids in wheat flour, which also have a great impact on the quality of wheat and dough characteristics. The fatty acid value reflects the acidity of fat in wheat during storage. The content of fatty acid in the national standard15 is less than 80 mg KOH/100 g. From Fig. 5B, it can be seen that the fatty acid value of wheat flour increased significantly (p < 0.05) after 90 min of Illumination. Although, the fatty acid value of wheat increased 5.79% in the control group and 10.30% in the experimental group, it was lower than 80 mg KOH/100 g, which lay in the suitable storage range. Long-term light treatment can oxidize the fat in wheat and increase the fatty acid value of wheat flour. With the addition of composite materials, the oxidation of wheat flour fat is higher than that of the control group because hydroxyl radicals are produced during the illumination process, which accelerates the decomposition of fat. The results showed that although the photocatalytic reaction had a significant effect on the fatty acid value of wheat flour, the fatty acid content of wheat flour was still acceptable. Lee16 also indicated that the increase in fatty acid content during irradiation may be due to the acceleration of fat decomposition by free radicals produced by irradiation.
Effect of photocatalytic technology on the protein content of wheat
Protein, an important component in wheat grains, accounts for approximately 10–15% of wheat grains. Its content and quality have a very important impact on the nutritional quality and processing characteristics of wheat. As seen from Fig. 5C, with the extension of illumination time, the protein content of the control group and the experimental group decreased slightly (p > 0.05), which is decreased 6.23% for the control group and 7.13% for the experimental group. The decrease in protein content may be due to the destruction of gluten structure, and the free radicals released during photocatalytic process cause different changes in protein content between the two groups. The results showed that the photocatalytic treatment of polluted wheat had little effect on the protein content of wheat. Wang17 found that the protein content of corn treated with ozone decreased compared with that of untreated corn, indicating that corn protein may be destroyed during ozone treatment. Radiation also produces free radicals, which affect the nutrients of protein or fat in grain. Treating different wheat varieties by irradiation method, it was found that the protein content of each sample basically did not change with the increase in irradiation dose.
Effect of photocatalytic technology on amino acids content in wheat
Tables S1 and S2† are the changes of amino acid content in wheat after treatment of the control group and experimental group, respectively. Table S1† shows that the total amount of essential amino acids (EAA) and total amino acids (TAA) decreased after 90 min of single illumination, but the ratio of EAA to TAA did not change significantly. For the experimental group (Table S2†), except for the total amount of EAA and TAA, the ratio of EAA to TAA is also decreasing, which may be the effect of free radicals produced by the composite on amino acids and increase the decrease in amino acids. The results showed that the control group had no effect on the balance of amino acids after 90 min of irradiation, and the balance of amino acids in the experimental group decreased slightly. Matloubi18 studied the effect of irradiation on amino acids in infant food. The results showed that with the increase of irradiation dose, the change trend of the amino acid content of infant food protein was not obvious. Wang19 showed that ozone treatment had no significant effect on the balance of amino acids in wheat.
Effect of photocatalytic technology on gluten content in wheat
Gluten is a viscoelastic substance in wheat flour. Wheat gluten comprises gliadin and glutenin, which give the dough ductility and elasticity. Its content and quality are important indicators of wheat protein quality. As shown in Fig. 5D, the wet gluten content decreased with the extension of illumination time (p < 0.05), the gluten content decreased by 7.75% in the control group and 8.89% in the experimental group. It demonstrates that the wet gluten content treated by illumination and photocatalysis belongs to the first class of wheat, which contains more than 35% wet gluten. The same conclusion was reached by Piemontese et al.20 The gluten content of wheat treated with ozone was significantly lower than that of the untreated (p < 0.05).
Effect of photocatalytic technology on the color of wheat flour
The color of wheat flour can directly reflect its quality, so the change in color is the most direct observation index of wheat quality change. Table 1 shows that the brightness and whiteness of wheat flour in the control group and experimental group decreased (p < 0.05) with time, and the yellowness value of the wheat flour increased slightly (p > 0.05). This may be due to Maillard reaction in wheat flour caused by illumination, resulting in a decrease in whiteness and an increase in the yellowness of the wheat flour. László21 studied the effects of UV and ozone treatment on the color of flour. The results showed that the whiteness of wheat flour decreased after UV irradiation. The brightness and the whiteness of wheat flour increased after ozone treatment, which may be due to the reaction between ozone and carotenoids in wheat.22
Table 1 Effect of photocatalytic technology on the color of wheat floura
| Method |
Time (min) |
L* |
a* |
b* |
| L* represents the brightness of the color, a* represents the red-green value of the color, and b* represents the yellow-blue value of the color. Values are presented as means ± standard deviations (n = 3). Means followed by different letters in the same column are statistically different (P < 0.05). |
| Illumination |
0 |
106.28 ± 0.01a |
1.74 ± 0.01a |
11.67 ± 0.07a |
| 30 |
105.75 ± 0.01a |
1.61 ± 0.08b |
11.84 ± 0.03a |
| 60 |
104.61 ± 0.01b |
1.56 ± 0.05b |
12.02 ± 0.06a |
| 90 |
103.94 ± 0.02b |
1.51 ± 0.04b |
12.66 ± 0.01a |
| Illumination + UCNP@TiO2 |
0 |
106.36 ± 0.01a′ |
1.79 ± 0.01a′ |
11.78 ± 0.00a′ |
| 30 |
105.52 ± 0.01b′ |
1.54 ± 0.03b′ |
11.71 ± 0.02a′ |
| 60 |
103.25 ± 0.03c′ |
1.78 ± 0.11a′ |
12.31 ± 0.08a′ |
| 90 |
102.28 ± 0.02c′ |
1.67 ± 0.04a′ |
11.98 ± 0.01a′ |
Effect of photocatalytic technology on the pasting properties of wheat flour
Table 2 shows the change in pasting properties of wheat flour in the control group and experimental group. The pasting properties of wheat flour have different effects on its processing quality. Photocatalysis may change the physicochemical properties of starch, which may lead to the change in pasting properties. It can be seen from Table 2 that the pasting properties of wheat flour, including peak viscosity, trough, final viscosity, breakdown and setback, decreased with time. With the extension of illumination time, the peak viscosity of wheat flour decreased from 2861, 2872 to 2613, 2498 in the control group and the experimental group, respectively. This may be due to the breakdown of starch granules caused by light and free radicals released by composite materials. Amylopectin content is positively correlated with viscosity. Therefore, it can be inferred that amylopectin would be destroyed by free radicals and its content decrease in the process of photocatalysis. Similarly, the peak viscosity is positively correlated with the swelling ability of starch, and amylose can form a saturated structure with aliphatic compounds in wheat, leading to the decrease of the swelling ability. As shown in Table 2, the peak viscosity decreases, demonstrating that the swelling ability decreases. Thus, it is deduced that the content of amylose can be influenced by photocatalytic reaction.23 The final viscosity is due to the rearrangement of amylose and the increase in the viscosity by polymerization. With the prolongation of illumination time, the final viscosity of wheat flour decreased significantly. This was attributed to the decrease in the degree of polymerization of starch, due to the breakage of starch chains, which leads to the reduction of final viscosity.24 Breakdown indicates the stability of wheat flour during stirring and heating. The breakdown value of the control group and the experimental group decreased significantly (p < 0.05), which could be ascribed to the breakage of starch granules under illumination. The setback represents the rising viscosity of starch solution during cooling (the difference between the final viscosity and the lowest viscosity). The aging of starch is due to the decrease in temperature, the weakening of molecular movement and the reorganization of starch molecules, which increase the viscosity of starch solution. The increase in viscosity after retrogradation varies from species to species. Amylose is mostly a linear molecule of amylose, which is easier to regenerate than amylopectin because of its small space barrier. In the experiment, the setback values of wheat flour decreased by 203 and 119 respectively. This may be due to the decrease in the amylose polymerization degree caused by illumination, which led to the decrease in retrogradation value.25 However, the carboxyl substituted hydroxyl groups limited the recrosslinking of starch molecules. In the existing literature reports, the pasting properties of rice, corn and soybean powder were also reduced by irradiation and ozone treatment.26
Table 2 Effect of photocatalytic technology on pasting properties of wheat floura
| Method |
Time (min) |
Peak viscosity (cP) |
Trough (cP) |
Final viscosity (cP) |
Breakdown (cP) |
Setback (cP) |
| Values are presented as means ± standard deviations (n = 3). Means followed by different letters in the same column are statistically different (P < 0.05). |
| Illumination |
0 |
2861 ± 4a |
1605 ± 5a |
3432 ± 2a |
995 ± 3a |
1587 ± 5a |
| 30 |
2839 ± 3a |
1590 ± 2a |
3151 ± 3a |
943 ± 4a |
1539 ± 8a |
| 60 |
2734 ± 2b |
1553 ± 4b |
2920 ± 4b |
911 ± 5b |
1486 ± 6b |
| 90 |
2613 ± 3c |
1536 ± 4b |
2805 ± 6c |
876 ± 5c |
1384 ± 6c |
| Illumination + UCNP@TiO2 |
0 |
2872 ± 3a′ |
1592 ± 3a′ |
3478 ± 3a′ |
988 ± 6a′ |
1575 ± 4a′ |
| 30 |
2799 ± 7a′ |
1483 ± 3b′ |
3107 ± 4a′ |
937 ± 7b′ |
1539 ± 8a′ |
| 60 |
2602 ± 7b′ |
1465 ± 4c′ |
2998 ± 5b′ |
891 ± 3c′ |
1428 ± 8b′ |
| 90 |
2498 ± 9c′ |
1451 ± 3c′ |
2790 ± 5c′ |
851 ± 4d′ |
1356 ± 5c′ |
Microstructure of wheat starch
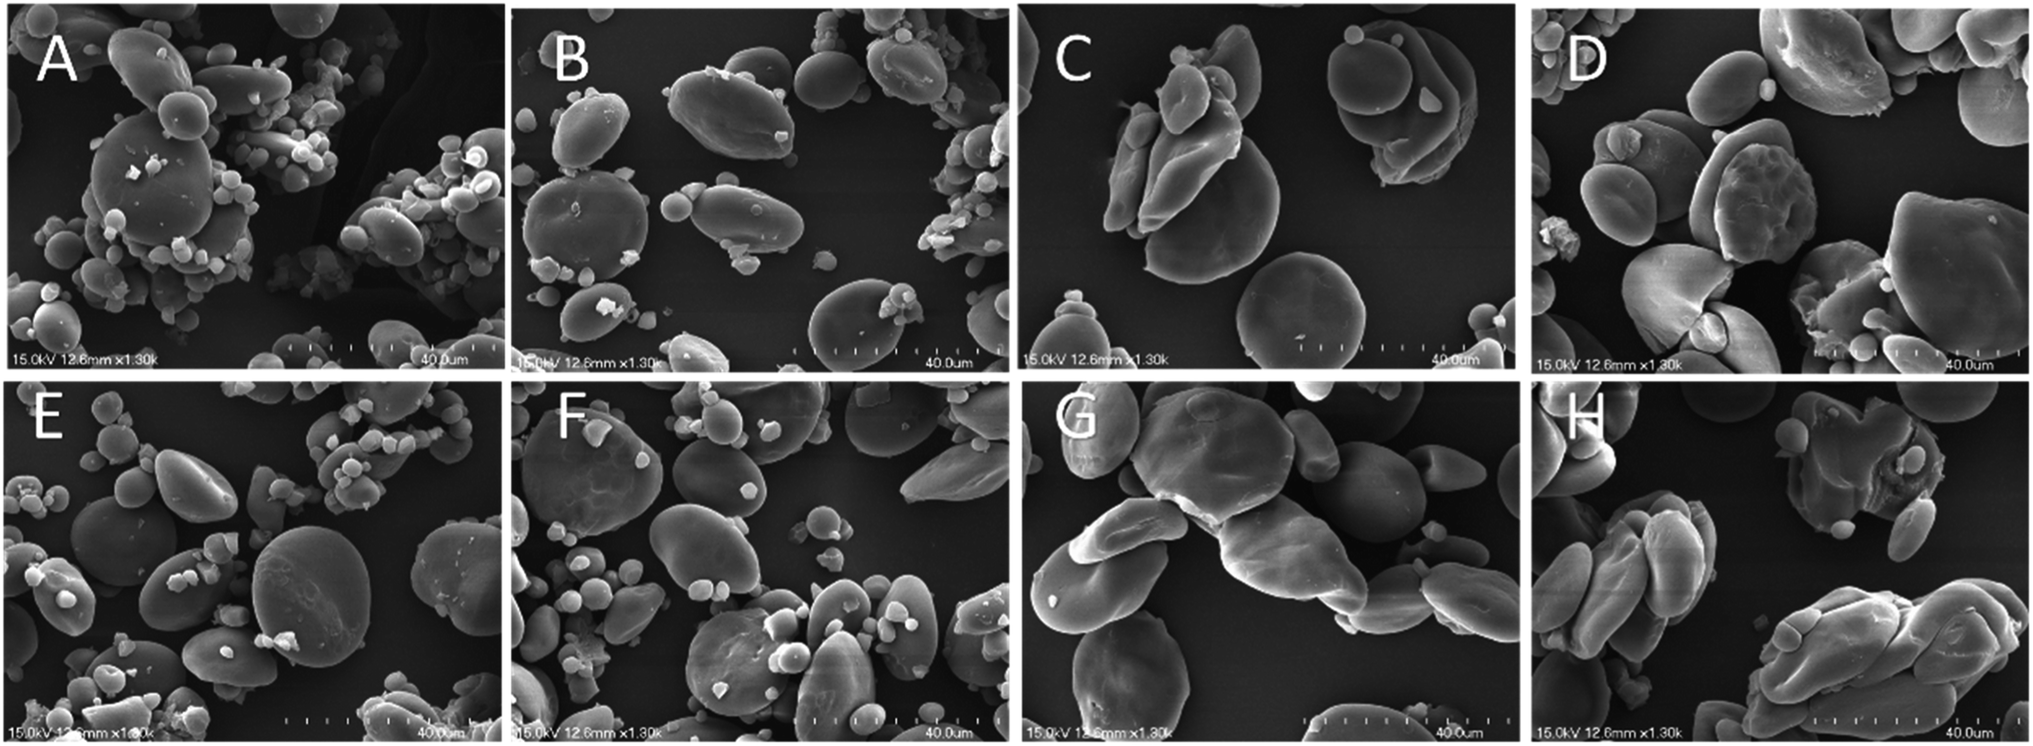
The SEM photographs of starch granules in control and experimental groups after illumination is shown in Fig. 6. At 0 min, the starch granules in the experimental group and the control group were flat spherical, while most starch granules had smooth surface and regular shape. Some starch surface damage may be caused by mechanical grinding. With the prolongation of illumination time, the number of damaged starch granules increased, and the damage degree of different granules was not consistent. Some granules had obvious depressions on the surface; the starch granules were seriously deformed. Some starch granules were damaged to a lesser extent and could still maintain the integrity of the granules. With the extension of time, starch particles agglomerate because of the hydration between starch and water molecules, and the increase in water content makes agglomeration easier.27 There were no surface cracks on starch surface, which may be due to the effect of the wheat–liquid ratio in the process of the photocatalytic degradation of wheat DON. Because the presence of water softens wheat starch, it is not easy for cracks to appear on the surface.
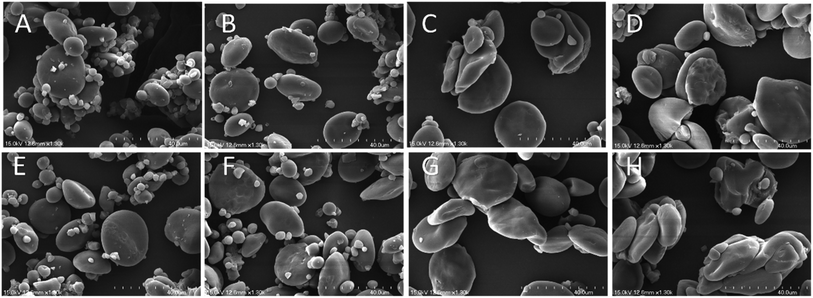 |
| | Fig. 6 Scanning electron microscopy of starch granules treated by illumination (A) 0 min, (B) 30 min, (C) 60 min, and (D) 90 min, scanning electron microscopy of starch granules treated by illumination and UCNP@TiO2 (E) 0 min, (F) 30 min, (G) 60 min, (H) 90 min. | |
Conclusions
In this paper, the effect of photocatalytic degradation of DON in wheat by UCNP@TiO2 composite was studied. The results showed that the degradation rate of DON reached 72.8% in 90 min with 8 mg mL−1 UCNP@TiO2. Under this conditions, the residual amount of DON in wheat was 0.78 μg g−1, which is definitely meet the national standard. After washing, the composite photocatalyst can be easily separated from the wheat sample completely, thus ensuring the safety of the composite photocatalyst in the process of wheat DON removal. The study on the nutritional quality of wheat demonstrated that illumination and photocatalysis had little effect on the starch content, protein content, amino acid content and fatty acid value of wheat. The gluten content and pasting properties of wheat flour in both the control group and the experimental group decreased significantly. Meanwhile, the SEM showed that there were different degrees of depression on the surface of starch. These findings indicated that both illumination and photocatalysis technology could affect the processing quality of wheat flour. In addition, it was found that the effects of the two technologies on wheat quality were different, which was possibly due to the hydroxyl radicals with strong oxidation ability produced by the composite photocatalyst. Furthermore, the comparison between the effect of photocatalytic technology and physical, chemical and biological methods on degradation rate and physiochemical properties of wheat were analysed. This work can provide the theoretical basis and feasibility analysis for the practical application of photocatalytic technology in the removal of mycotoxins from grain. The photocatalytic process can be applied to the actual wheat processing technology, such as rinsing and moistening, and the photocatalytic reaction conditions can be further adjusted according to the needs of the processing technology to ensure that the impact of wheat processing quality can be minimized.
Conflicts of interest
There are no conflicts to declare.
Acknowledgements
This work was supported by National Natural Science Fund of China (NSFC 31772086), Jiangsu Agriculture Science and Technology Innovation Fund (CX(18)2025), Key Research and Development Program of Jiangsu Province (BE2016306), Fundamental Research Funds for the Central Universities (JUSRP21826), and Young Elite Scientists Sponsorship Program by CAST (2017QNRC001).
Notes and references
- L. Wu and B. Wang, Food Chem., 2016, 202, 149–155 CrossRef CAS
 .
. - A. Huwig, S. Freimund, O. Käppeli and H. Dutler, Toxicol. Lett., 2001, 2, 179–188 CrossRef .
- K. O'Neill, A. P. Damoglou and M. F. Patterson, Food Addit. Contam., Part A, 1993, 2, 209–215 CrossRef PubMed .
- T. Xu, L. Zhang, H. Cheng and Y. Zhu, Appl. Catal., B, 2011, 101, 382–387 CrossRef CAS .
- S. J. Wu, J. J. Lv, F. Wang, N. Duan, Q. Li and Z. Wang, Sci. Rep., 2017, 7, 14435 CrossRef .
- Y. Lv, L. Yue, Q. Li, B. Shao, S. Zhao and H. Wang, Dalton Trans., 2018, 47, 1666–1673 RSC .
- C. Maneerat and Y. Hayata, Int. J. Food Microbiol., 2006, 107, 99–103 CrossRef CAS .
- B. K. Young, J. C. Yoon, K. Soohyun, P. Jonghyun, C. Myongsoo, S. K. Bin, H. Ingyun, K. Kisung and P. Jiyong, J. Food Prot., 2009, 72, 1916–1922 CrossRef .
- M. M. Li, E. Q. Guan and K. Bian, Food Addit. Contam., Part A, 2015, 4, 544–553 CrossRef .
- R. Chen, F. Ma, P. W. Li, W. Zhang, X. X. Ding, Q. Zhang, M. Li, Y. R. Wang and B. C. Xu, Food Chem., 2014, 146, 284–288 CrossRef CAS .
- U. Gecgel, T. Gumus, M. Tasan, O. Daglioglu and M. Arici, Radiat. Phys. Chem., 2011, 4, 578–581 CrossRef .
- D. Abramson, J. D. House and C. M. Nyachoti, Mycopathologia, 2005, 4, 297–301 CrossRef .
- D. Kuakpetoon and Y. J. Wang, Starch, 2001, 5, 211–218 CrossRef .
- H. T. Chan, R. Bhat and A. A. Karim, J. Agric. Food Chem., 2009, 13, 5965–5970 CrossRef .
- J. S. Ha and X. M. Lin, GB 1355-1986, National Health and Family Planning Commission of PRC, China, 1986 .
- E. J. Lee and D. U. Ahn, J. Food Sci., 2003, 1, 6 Search PubMed .
- Y. Wang, J. M. King, Z. Xu, J. Losso and A. Prudente, J. Agric. Food Chem., 2008, 17, 7942–7949 CrossRef .
- H. Matloubi, F. Aflaki and M. Hadjiezadegan, J. Food Compos. Anal., 2004, 2, 133–139 CrossRef .
- L. Wang, H. L. Shao, X. H. Luo, R. Wamg, Y. F. Li, Y. Li and Z. Chen, PLoS One, 2016, 11, e0147613 CrossRef PubMed .
- L. Piemontese, M. C. Messia, E. Marconi, L. Falasca, R. Zivoli, L. Gambacorta, G. Perroneet and M. Solfrizzo, Food Addit. Contam., Part A, 2018, 35, 760–771 CrossRef CAS .
- Z. H. László, S. Beszéde, S. Kertész, E. Gyimes and C. Hodúr, Ozone: Sci. Eng., 2008, 6, 413–417 CrossRef .
- A. Aboltins, J. Palabinskis and A. Lauva, Acta Hortic., 2010, 858, 449–455 CrossRef .
- W. Ding, Y. Wang, W. Zhang, Y. Shi and D. Wang, Int. J. Food Sci. Technol., 2015, 3, 744–749 CrossRef .
- G. E. Vandeputte, R. Vermeylen, J. Geeroms and J. A. Delcour, J. Cereal Sci., 2003, 1, 61–68 CrossRef .
- B. A. Ashwar, A. Shah, A. Gani, S. A. Rather, S. M. Wani, I. A. Wani, F. A. Masoodi and A. Gani, Radiat. Phys. Chem., 2014, 99, 37–44 CrossRef CAS .
- A. Gani, M. Bashir, S. M. Wani and F. A. Masoodi, LWT--Food Sci. Technol., 2012, 1, 162–169 CrossRef .
- Z. Zhang, S. Zhao and S. Xiong, Carbohydr. Polym., 2010, 79, 341–348 CrossRef CAS .
Footnote |
| † Electronic supplementary information (ESI) available. See DOI: 10.1039/c9ra04316k |
|
| This journal is © The Royal Society of Chemistry 2019 |
Click here to see how this site uses Cookies. View our privacy policy here. 
 Open Access Article
 This Open Access Article is licensed under a Creative Commons Attribution-Non Commercial 3.0 Unported Licence
 *abcd
*abcd