 Open Access Article
Study of palladium and boric acid ion co-doped Li3V2(PO4)3/C cathode material with high performance
Yu Zhang *
*
College of Pharmacy, Xinjiang Medical University, Urumqi, 830011 Xinjiang, China
First published on 19th August 2019
Abstract
A palladium and boric acid ion co-doped Li3V2(PO4)3/C composite was successfully synthesized by a simple method. A series of characteristics, such as its microstructures and electrochemical properties, were studied. The results show that the modified materials have relatively regular spherical particles and good electrochemical performances for cathode materials. It delivers a high special capacity of 159.2 mA h g−1 at 0.2C and 128.9 mA h g−1 at 5C in the voltage range of 2–4.3 V. After cycling at different rates, the initial discharge capacity retention rate was 97.5%. The enhanced electrochemical properties indicate that the modification method, using anions and cations to collaborative dope the material, effective to improve the electrochemical performance of the electrode material.
1. Introduction
In 1997, Goodenough et al. discovered that LiFePO4 has the property of reversible deintercalation of lithium ions. Compounds with PO43− as polyanions became the focus of battery material investigators around the world. In particular, the Li3V2(PO4)3 material, which has numerous advantages such as high discharge capacity, good stability, and environmental friendliness, has been favored by researchers.1–5Previous studies show that the monoclinic Li3V2(PO4)3 material has a three-dimensional network structure formed by alternating VO6 octahedrons and PO4 tetrahedrons sharing oxygen-atom vertices.6–8 This structure can provide three-dimensional diffusion channels for Li+ in compounds, which is helpful to improve the Li+ transmission and cycling stability. However, it also increases the distance between the transition metal atoms in the material, leading to reduced conductivity and limited practical applications for Li3V2(PO4)3 materials.9–13 At present, a number of methods have been adopted to overcome the defects of the samples, and the most commonly used methods are the reduction in particle size, doping of anions or cations, and the coating of a conductive film on the material surface.14–17
Among these methods, the introduction of foreign anions or cations is the most prominent methods in the current modifications. Compared with the cationic doping methods, the anion doping methods are less studied. It was reported earlier that in 2009, Zhong Shengkui et al. modified the Li3V2(PO4)3 material by doping with fluoride ion. When the doping amount x = 0.10 (Li3V2(PO4)2.90F0.10), the electrochemical performance of the pure material was significantly improved.18 With the development of research, Hu Yisheng et al. used boric acid and graphene to modify Li3V2(PO4)3 materials in 2017, and good results were obtained in this study. The boric acid doping ratio is wt 5%, in the voltage range of 3.0–4.8 V, it delivers specific capacities of 183.2, 178.0, 166.9 and 153.6 mA h g−1 at 1, 2, 5 and 10C, respectively,19 which proves that the method of boric acid doping can greatly improve the discharge capacity of Li3V2(PO4)3 material. Common cations include K+,20 Na+,21 Mn2+,22 Co2+,23 Ni2+,24 Fe3+,25 Y3+,26 Cr3+,27 Ge4+,8 Ti4+,28 Nb5+,29 etc. The introduction of these cations can improve the electrochemical properties of Li3V2(PO4)3 materials in varying degrees, especially in the aspect of rate performance. Interestingly, as an important platinum group metal, palladium has a very wide range of applications in mechanics, materials, catalysts and other fields. It can play a good role in promoting, and seems to have become a star in various fields of scientific research. But it looks like that there have not any report of preparation and modification of Li3V2(PO4)3 materials.
In this study, palladium ions and boric acid ions, respectively, were initially used as dopants to decorate the Li3V2(PO4)3/C electrode materials. A series of experimental data shows that these two modification methods can signally increase the rate capacity and discharge capability of Li3V2(PO4)3/C electrode materials, under a lower range of charge–discharge voltage, and the best doping ratios were all found to be 5 wt%. Therefore, the two methods were combined to modify the material by co-doping of the anion and cation, and to explore whether the method can yield a better result. Then, palladium ions and boric acid ions, with the best doping ratios, were simultaneously doped into Li3V2(PO4)3/C samples, and the anion–cation co-doped Li3V1.95Pd0.05(PO4)2.95(BO3)0.05/C material was successfully synthesized for the first time. The morphology, microstructure, and properties of the synthesized anion–cation co-doped material were investigated and compared with those of the pd-doped, BO33−-doped, and bare Li3V2(PO4)3/C materials respectively. The results show that the anion–cation co-doped modification can gain quite obviously synergy from the anion and cation, and further improve the electrochemical performance of the material.
2. Experimental details
The anion–cation co-doped Li3V1.95Pd0.05(PO4)2.95(BO3)0.05/C cathode material was synthesized by a sol–gel method using CH3COOLi·2H2O, V2O5, PdCl2, H3PO4 and H3BO3 as the starting materials and citric acid as the carbon source with a molar ratio of 3.15![[thin space (1/6-em)]](https://www.rsc.org/images/entities/char_2009.gif) :
:![[thin space (1/6-em)]](https://www.rsc.org/images/entities/char_2009.gif) (1 − 0.5x)
(1 − 0.5x)![[thin space (1/6-em)]](https://www.rsc.org/images/entities/char_2009.gif) :
:![[thin space (1/6-em)]](https://www.rsc.org/images/entities/char_2009.gif) x
x![[thin space (1/6-em)]](https://www.rsc.org/images/entities/char_2009.gif) :
:![[thin space (1/6-em)]](https://www.rsc.org/images/entities/char_2009.gif) (3 − y)
(3 − y)![[thin space (1/6-em)]](https://www.rsc.org/images/entities/char_2009.gif) :
:![[thin space (1/6-em)]](https://www.rsc.org/images/entities/char_2009.gif) y
y![[thin space (1/6-em)]](https://www.rsc.org/images/entities/char_2009.gif) :
:![[thin space (1/6-em)]](https://www.rsc.org/images/entities/char_2009.gif) (1 − 0.5x) (x = 0.05, y = 0.05). The purity of these chemical reagents are analytical pure, from Tianjin Zhiyuan Chemical Reagents Co., Ltd. First, to mix the requisite amount of V2O5 and deionized water (20 mL) into slurry with magnetic stirring; then, an appropriate amount of H2O2 was added to dissolve the slurry until an orange apparent solution was obtained. The addition of stoichiometric CH3COOLi·2H2O to this solution produced a yellow solution, A. Separately, a stoichiometric amount of PdCl2 was stirred in concentrated hydrochloric acid with constant stirring at 80 °C until it appeared to be dissolved, forming solution B. Then, solutions A and B were combined. A stoichiometric mixture of H3BO3, H3PO4, and citric acid (dissolved in 60 mL of deionized water) was then slowly introduced into the combined solution with sustained magnetic stirring for 2 h; the color of the solution changed from yellow to green. The green solution was dried at 90 °C for 12 h in an oven, affording a green solid. The solid was ground into a powder, pre-sintered at 350 °C for 4 h, and then sintered at 800 °C for 12 h in a tube furnace under a flowing argon atmosphere. The annealed powders were cooled to room temperature and ground.
(1 − 0.5x) (x = 0.05, y = 0.05). The purity of these chemical reagents are analytical pure, from Tianjin Zhiyuan Chemical Reagents Co., Ltd. First, to mix the requisite amount of V2O5 and deionized water (20 mL) into slurry with magnetic stirring; then, an appropriate amount of H2O2 was added to dissolve the slurry until an orange apparent solution was obtained. The addition of stoichiometric CH3COOLi·2H2O to this solution produced a yellow solution, A. Separately, a stoichiometric amount of PdCl2 was stirred in concentrated hydrochloric acid with constant stirring at 80 °C until it appeared to be dissolved, forming solution B. Then, solutions A and B were combined. A stoichiometric mixture of H3BO3, H3PO4, and citric acid (dissolved in 60 mL of deionized water) was then slowly introduced into the combined solution with sustained magnetic stirring for 2 h; the color of the solution changed from yellow to green. The green solution was dried at 90 °C for 12 h in an oven, affording a green solid. The solid was ground into a powder, pre-sintered at 350 °C for 4 h, and then sintered at 800 °C for 12 h in a tube furnace under a flowing argon atmosphere. The annealed powders were cooled to room temperature and ground.
The as-prepared anion–cation co-doped, pd-doped, BO33−-doped and bare Li3V2(PO4)3/C samples were tested by X-ray diffraction (XRD, Bruker D2) using Cu Kα radiation. The diffraction data were collected at 30 kV and 10 mA, in the step mode over the angular range of 10–70°, with a step size of 0.02°. The morphologies of the materials were characterized by transmission electron microscopy (TEM, Philips CM10) and accelerating voltage was 200 kV. The electronic states of the elements were assessed by X-ray photoelectron spectroscopy (XPS, ESCALAB 250Xi).
The electrodes were obtained by mixing the active material, acetylene black, and politetrafluoroethylene (PTFE) with a weight ratio of 80![[thin space (1/6-em)]](https://www.rsc.org/images/entities/char_2009.gif) :
:![[thin space (1/6-em)]](https://www.rsc.org/images/entities/char_2009.gif) 15
15![[thin space (1/6-em)]](https://www.rsc.org/images/entities/char_2009.gif) :
:![[thin space (1/6-em)]](https://www.rsc.org/images/entities/char_2009.gif) 5. The mixed slurry was evenly coated on the aluminium foil, then, drying at room temperature and cutting into slices with diameters of 10 mm and these were dried under a vacuum (110 °C for 12 h). Lithium slices were used as the anode, anion and cation co-doped Li3V1.95Pd0.05(PO4)2.95(BO3)0.05/C material as the cathode, PP/PE/PP composite diaphragm as a separator, and the electrolyte was a 1 M-LiPF6 solution in a mixture of ethylene carbonate and dimethyl carbonate (1
5. The mixed slurry was evenly coated on the aluminium foil, then, drying at room temperature and cutting into slices with diameters of 10 mm and these were dried under a vacuum (110 °C for 12 h). Lithium slices were used as the anode, anion and cation co-doped Li3V1.95Pd0.05(PO4)2.95(BO3)0.05/C material as the cathode, PP/PE/PP composite diaphragm as a separator, and the electrolyte was a 1 M-LiPF6 solution in a mixture of ethylene carbonate and dimethyl carbonate (1![[thin space (1/6-em)]](https://www.rsc.org/images/entities/char_2009.gif) :
:![[thin space (1/6-em)]](https://www.rsc.org/images/entities/char_2009.gif) 1 by volume). Finally, the two-electrode electrochemical cells were assembled in an argon-filled glove box. The charge–discharge curves and cycle lives of the cells were evaluated with a battery test instrument (LAND, CT-2001A) at different rates (0.2, 0.5, 1, 2, and 5C) in the voltage range of 2–4.3 V. Cyclic voltammetry (CV) was performed using an electrochemical workstation (LK2005A), scanning in the voltage range of 2–4.3 V at a scan rate of 0.1 mV s−1. Then, electrochemical impedance spectroscopy (EIS) measurements were carried out over the frequency range of 100 kHz to 10 MHz after the electrochemical tests.
1 by volume). Finally, the two-electrode electrochemical cells were assembled in an argon-filled glove box. The charge–discharge curves and cycle lives of the cells were evaluated with a battery test instrument (LAND, CT-2001A) at different rates (0.2, 0.5, 1, 2, and 5C) in the voltage range of 2–4.3 V. Cyclic voltammetry (CV) was performed using an electrochemical workstation (LK2005A), scanning in the voltage range of 2–4.3 V at a scan rate of 0.1 mV s−1. Then, electrochemical impedance spectroscopy (EIS) measurements were carried out over the frequency range of 100 kHz to 10 MHz after the electrochemical tests.
3. Results and discussion
The crystal structures of the anion–cation co-doped, pd-doped, BO33−-doped and bare Li3V2(PO4)3/C samples identified by X-ray diffraction (XRD) are shown in Fig. 1. The curves a, b, c, and d correspond to the bare, Pd-doped, BO33−-doped, and anion–cation co-doped Li3V2(PO4)3/C materials, respectively. Strong diffraction peaks can be observed in the XRD patterns, and all patterns are indexed as monoclinic structures with the P21/n space group, which is consistent with previously reported results.30–32 Moreover, no other impurity peaks are found, indicating that the synthesized materials are pure-phase and the carbon coated on the surface of the material is amorphous carbon. It has been proved in many related reports that the carbon film coated on the surface of the materials can effectively improve the electronic conductivity and the utilization ratio of active substances, and enhance the rate performance of the materials.33,34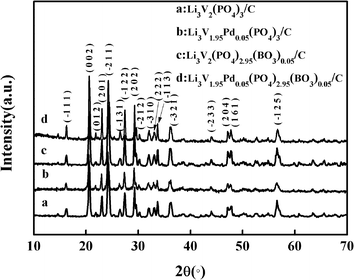 | ||
| Fig. 1 X-ray diffraction patterns of anion–cation co-doped, pd-doped, BO33−-doped, and bare Li3V2(PO4)3/C samples. | ||
Fig. 2 shows the transmission electron microscopy images of the bare, Pd-doped, BO33−-doped, and anion–cation co-doped Li3V2(PO4)3/C materials. Images a, b, c, and d have a unit size of 50 nm, and images e, f, g, and h have a unit size of 5 nm for the four materials, respectively. All four materials contain spherical particles with different radii, and the particle-size distribution of the bare, Pd-doped, BO33−-doped, and anion–cation co-doped Li3V2(PO4)3/C materials is in the range of 50–200 nm, 20–200 nm, 20–100 nm, and 10–120 nm, respectively. It can be seen that the particle size of the materials decreases gradually in the order of a, b, c, and d. This is because the radius of palladium ions (86 pm) is greater than that of vanadium ions (74 pm), and the total charge and radius of BO33− are smaller than those of PO43−. The introduction of foreign ions with different radii and charges reduces the lattice order and particle size of the materials. The spherical particles increase the contact area between the material and the electrolyte, and the smaller grain size reduces the lithium ion migration path, which contributes to the excellent electrochemical properties of the material. In the high-power transmission electron microscopy analysis of these four materials, e, f, g, and h, different crystal planes and uniform carbon film coating of the materials can be clearly observed, as shown in Fig. 2. The images are carefully compared with the standard XRD card of Li3V2(PO4)3 material, the lattice spaces of 0.345, 0.545, 0.330, 4.920 and 0.324 nm collected from the four materials correspond to the diffraction peaks of (−2 2 0), (−1 1 1), (1 3 1), (0 2 1), (−1 2 2) planes, respectively. It is further proved that the four synthesized samples are pure phases.35 The elemental analysis test results indicate that the carbon content of the four samples are in the range of 2.3–3.6%.
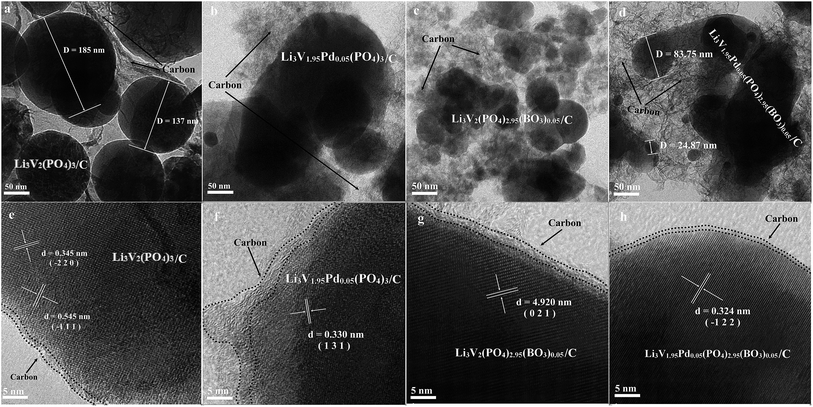 | ||
| Fig. 2 TEM images of the bare, Pd-doped, BO33−-doped, and anion–cation co-doped Li3V2(PO4)3/C materials ((a–d) unit size of 50 nm; (e–h) unit size of 5 nm). | ||
To investigate the chemical composition and states of the as-synthesized samples, XPS survey spectra of the materials are shown in Fig. 3(a). Curves a, b, c, and d represent the bare, Pd-doped, BO33−-doped, and anion–cation co-doped Li3V2(PO4)3/C materials, respectively. The enlarged XPS spectra in the range of 512–528 eV, shown in Fig. 3(b), reveal that all samples have two apparent peaks at binding energies of 517.08 and 524.08 eV corresponding to V 2p3/2 and V 2p1/2, respectively,36–38 suggesting that there is only one valence vanadium ion (+3) in the samples. Meanwhile, there are two clear peaks of binding energy of 336.08 and 341.38 eV from samples b and d in the enlarged diagram covering the bind energy range of 330–350 eV, which correspond to the Pd 3d5/2 and Pd 3d3/2 orbital energies, respectively. These data are consistent with those measured in PdO, indicating that the valence states of Pd in the materials are +2. In addition, there is one obvious peak of binding energy of 191.08 eV from samples c and d in the enlarged view in the bind energy range of 185–205 eV, which corresponds to the B 1s orbital energy. This result is match that measured in B2O3, suggesting that the valence states of B in the samples are +3. This proves that palladium atoms and boron atoms are successfully doped in samples b and d and samples c and d, respectively. Through XRD, TEM, and XPS measurements of the samples, it can be confirmed that pure phases of the bare, Pd-doped, BO33−-doped, and anion–cation co-doped Li3V2(PO4)3/C materials are prepared.
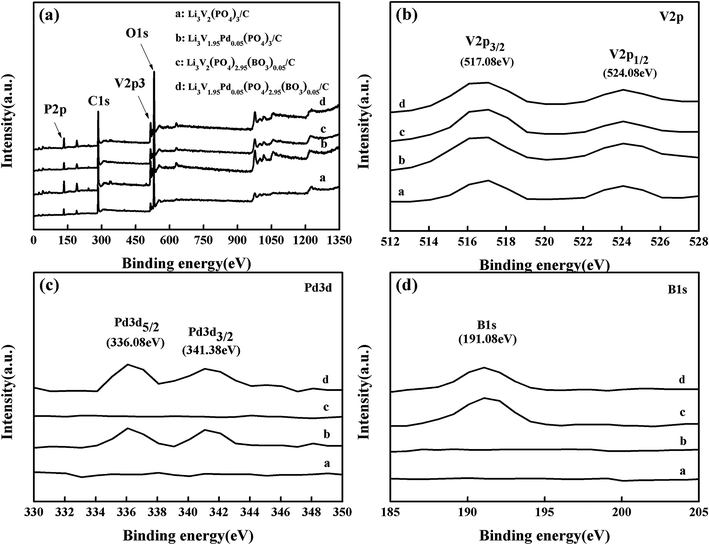 | ||
| Fig. 3 (a) XPS survey spectra of the prepared samples; (b), (c) and (d) enlarged diagrams over the ranges of 512–528 eV, 330–350 eV, and 185–205 eV, respectively. | ||
The discharge capacity of composite materials were further investigated by means of constant current test. Fig. 4 shows the special discharge of the synthesized materials. The curves a, b, c and d were represented the bare, Pd-doped, BO33−-doped and anion–cation co-doped Li3V2(PO4)3/C materials separately. As shown in the picture, the bare Li3V2(PO4)3/C material has three pairs obvious charging and discharging platforms, which represent the processes of embedding and releasing for the first two lithium ions in the sample. The reaction mechanism of Li3V2(PO4)3 material during charging and discharging is as follows:
 | (1) |
 | (2) |
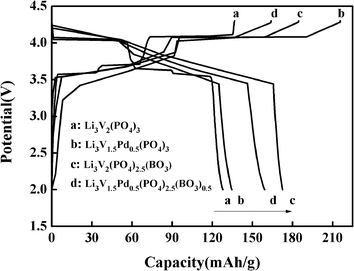 | ||
| Fig. 4 The first charge–discharge curves of the as-prepared composites at the 0.2C rate between 2.0 and 4.3 V. | ||
In the charge–discharge process of lithium vanadium phosphate, there exists phase transition for every lithium ion insertion/de-insertion. Within the potential range of 3.0–4.3 V, each cell unit can be reversibly deintercalated with two lithium ions, and three pairs of obvious charging and discharging platforms appear, corresponding to three phase transitions of Li3V2(PO4)3/Li2.5V2(PO4)3, Li2.5V2(PO4)3/Li2V2(PO4)3, Li2V2(PO4)3/LiV2(PO4)3, respectively.39 Meanwhile, we can clearly see that the decorated materials b, c and d almost contain two pairs charging and discharging platforms. By careful comparison, it can be found that in the charging process, the first charging platforms of the three doped materials have been reduced, and the palladium-doped material has the most obvious performance. At the same time, the second charging platforms of the materials have been improved. This is because the valence of Pd2+ is lower than that of V3+ and the charge of BO33− is lower than that of PO43−. Lower ion valence state and charge will cause the first charging platform to decrease, and the effect of lower ion valence state seems to be more important. In the process of charging, with the release of lithium ions, in order to compensate for the charge loss caused by the introduction of low-valent state and low-charge ions, more high-valent state phases will be produced, which will lead to the increase of the second charging platform. In the process of promoting phase transition, the effect of low-charge ions is more obvious, which will effectively improve the discharge capacity of materials to a large extent. This conclusion is also confirmed by the discharge capacity data. At the same time, it can be seen from the discharge curves that the doped materials have more content of high valence phase transform to low valence phase than Li3V2(PO4)3 material, which leads to the increase of the first and second discharge platforms. Therefore, part of platforms in the same charging or discharging processes of the modified materials are combined, relate to the charging and discharging platforms have changed from the original three pairs to the two pairs now. The first-discharge capacity of the samples are 127.9, 133.6, 172.6 and 159.2 mA h g−1, respectively, with the rate of 0.2C and in the voltage range of 2–4.3 V. Obviously, the doped materials can effectively improve the discharge capacity of the Li3V2(PO4)3/C material, especially those doped with boric acid ions, which may be also involved the special morphology of the materials in some way.
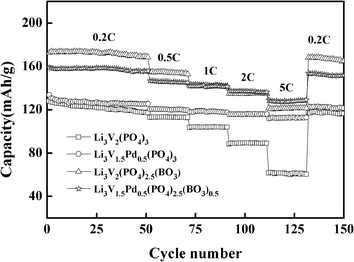
Fig. 5 presents the discharge capacities of the materials at different rates between 2 and 4.3 V; these are used to study the rate performance of the materials. The square, circle, triangle, and star represent the bare, Pd-doped, BO33−-doped, and anion–cation co-doped Li3V2(PO4)3/C materials, respectively. The discharge capacities of the synthesized materials with different rates and high-rate discharge capacity retentions (it will be represented by HRDCR in the following sections) relative to initial discharge capacity are shown in Table 1 for comparison. From the data displayed in Table 1, we can see that the first-discharge capacities of the bare are 127.9 mA h g−1 at 0.2C, and 128.9 mA h g−1 at 5C, respectively, in the voltage range of 2–4.3 V. A good special-discharge capacity is exhibited by the bare, which is similar to the theoretical capacity at the rate of 0.2C. However, as the rate increases, the capacity decays rapidly. The Pd-doped, BO33−-doped, and anion–cation co-doped methods can all effectively improve the rate performance of the materials. The difference is that the discharge capacity of the material doped with palladium ions cannot be improved greatly because palladium itself has no electrochemical activity. But at a discharge rate of 5C, it delivers the highest HRDCR of 83.8%, which projects an excellent rate performance. It because of palladium itself has good chemical stability owing to its own extranuclear electron arrangement. At the same time, the BO33−-doped Li3V2(PO4)3/C material can increase the discharge capacity considerably because the radius and total charge of BO33− are less than those of PO43−. Without affecting the content of active substances in the material, the particle size of the material tends to be smaller. Meanwhile, to balance the charge in the material, more vanadium with a higher valence is converted to that of a lower valence, which can create a greater release in the capacity of the prepared sample. But at a discharge rate of 5C, the HRDCR is 70.3%, which is lower than that of the Pd-doped Li3V2(PO4)3/C material.
| Sample | Special-discharge capacity (mA h g−1) | HRDCR (%) | ||||
|---|---|---|---|---|---|---|
| 0.2C | 0.5C | 1C | 2C | 5C | ||
| Li3V2(PO4)3/C | 127.9 | 112.8 | 103.6 | 88.5 | 61.5 | 48.1 |
| Li3V1.95Pd0.05(PO4)3/C | 133.6 | 120.5 | 118.0 | 115.9 | 111.9 | 83.8 |
| Li3V2(PO4)2.95(BO3)0.05/C | 172.6 | 155.0 | 142.7 | 134.9 | 121.4 | 70.3 |
| Li3V1.95Pd0.05(PO4)2.95(BO3)0.05/C | 159.2 | 147.0 | 142.0 | 137.5 | 128.9 | 81.0 |
Generally, Pd-doped material exhibit excellent rate performance, but its discharge capacity is not high. The BO33−-doped material has a good discharge capacity, but its rate performance is worse than that of the Pd-doped material. Finally, the anion and cation co-doped Li3V2(PO4)3/C material not only combines the advantages of Pd-doped and BO33−-doped Li3V2(PO4)3/C materials, but also just circumvents the disadvantages of both. It can effectively improve the discharge capacity of the material; besides, significantly enhances the rate performance of the material. At the discharge rate of 0.2C and 5C, its special-discharge capacity is 159.2 mA h g−1 and 128.9 mA h g−1, respectively. Its HRDCR is 81.0%, which is between those of the first two doped materials. As the rate decreases from 5C to 0.2C, the discharge capacity of the material can still reach 157.9 mA h g−1. After 150 cycles at different rates, the initial capacity retention rate is 97.5%, showing excellent electrochemical performance for cathode materials.
The mechanism of lithium-ion extraction/insertion and the reversibility of the materials is also investigated. The CV curves are obtained at a scanning rate of 0.1 mV s−1 in the potential range of 2–4.3 V after 150 cycles. Curves a, b, c, and d indicate the bare, Pd-doped, BO33−-doped, and anion–cation co-doped Li3V2(PO4)3/C materials, respectively. As shown in Fig. 6(a), all samples have three pairs of redox peaks, corresponding to three lithium-ion extraction/insertion processes.40,41 It is obvious that, after different rate cycling processes, the doped materials have sharper peaks and larger peak current values compared to the bare Li3V2(PO4)3/C electrode material, indicating that the doped electrode materials possess enhanced reversibility. Taking the redox peaks of four materials in the range of 3.8 V to 4.3 V as an example. As shown in Fig. 6(b), the difference between oxidation and reduction voltages of curves a, b, c and d is 0.419 V, 0.117 V, 0.162 V and 0.117 V, respectively. And the ratio of oxidation peak current to reduction peak current (ipa/ipc) is 2.710, 0.887, 0.823 and 0.868, respectively. It is well known that the smaller the difference between the oxidation peak and the reduction peak voltage of the material, the closer the ratio of the oxidation peak current to the reduction peak current is to 1, and the reversibility of the material is better. From the comparison we can see that the material doped with Pd2+ displays the best reversibility, which is consistent with the results of the study on the rate performance. Moreover, the anion–cation co-doped Li3V2(PO4)3/C electrode material just synthesizes the advantage of Pd-doped material, while retaining the high capacity of borate-doped material, and showing good electrochemical performance.
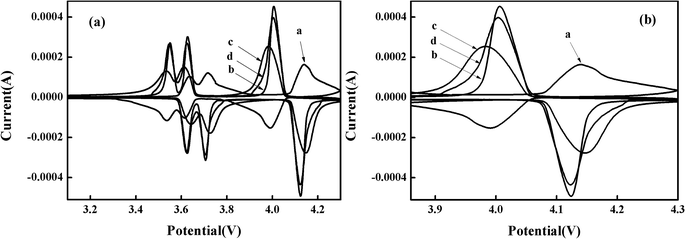 | ||
| Fig. 6 (a) CV curves of synthesized composites in the potential range of 2–4.3 V with a scan rate of 0.1 mV s−1 after 150 cycles; (b) is an enlarged view of a voltage range of 3.8–4.3 V. | ||
In order to further explore the effects of different doping methods on the electrochemical properties of materials, the electrochemical kinetic parameters were carried out by EIS after 150 cycles in the potential range of 2–4.3 V. Fig. 7(a) shows the Nyquist plots for the electrodes, and the inset in Fig. 7(a) shows an enlarged image of the range of 0–60 Ω. The square, circle, triangle, and star represent the bare, Pd-doped, BO33−-doped, and anion–cation co-doped Li3V2(PO4)3/C materials, respectively. As we can see that the shapes of the impedance spectra of the four samples are similar, and consist of a small intercept at high frequency, a semicircle in the medium frequency region, and a sloped line in the low-frequency region, which correspond to uncompensated resistance (Re), charge transfer resistance (Rct) and the diffusion of Li+ in the electrode (Ws), respectively.42–44 The lithium-ion diffusion coefficient D is calculated via the following equation.45,46
| D = R2T2/2A2n4F4C2σ2 | (3) |
| Zre = Re + Rct + σω−1/2 | (4) |
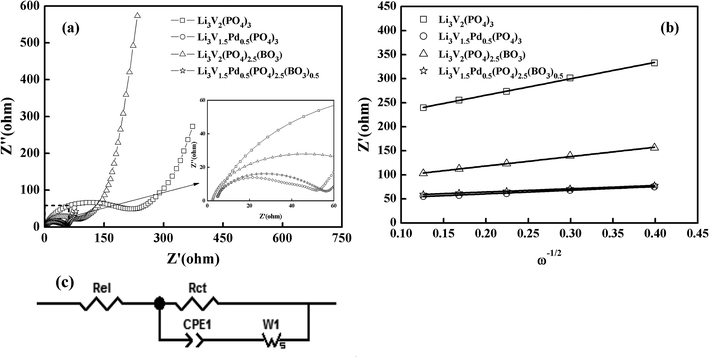 | ||
| Fig. 7 (a) Nyquist plots for the EIS of the synthesized samples; (b) relationship between Zre and ω−1/2 at low frequencies; (c) equivalent circuit of the experimental data. | ||
Fig. 7(b) shows the relationship between Zre and (ω−1/2) in the low-frequency region. The equivalent circuit used to fit the experimental data is shown in Fig. 7(c), and the fitting results of the equivalent circuit and the lithium-ion diffusion coefficient data are listed in Table 2. The charge transfer resistance values for the composites are 220.80, 47.10, 87.40, and 51.59 Ω, and the lithium ion diffusion coefficients of the materials are 3.30 × 10⁻¹², 6.30 × 10⁻¹¹, 9.34 × 10⁻¹², and 7.72 × 10⁻¹¹ cm2 s−1, respectively. Thus, these three modifications are all important in the promotion of the electrochemical properties of electrode composites. However, the charge transfer impedance (Rct) of BO33−-doped materials is slightly higher than that of palladium-doped materials. On the contrary, the lithium-ion diffusion coefficient D is reduced sparingly. The reason for this may be found in the electron-microscopy projection of the materials; it may be due to the effective reduction in the material particle size of borate-doped materials, resulting in the agglomeration of some particles and leading to the results shown. Anion and cation co-doped materials also combine the characteristics of the two decorations, and further enhance the mobility of lithium ions. These results suggest that the anion–cation co-doped Li3V2(PO4)3/C material delivers a smaller Rct and the largest D, and thus exhibits the best electrochemical performance.
| Sample | Re (Ω) | Rct (Ω) | D (cm2 s−1) |
|---|---|---|---|
| a Re: uncompensated resistance; Rct: charge transfer resistance; D: lithium diffusion coefficient. | |||
| Li3V2(PO4)3/C | 3.24 | 220.80 | 3.30 × 10⁻¹² |
| Li3V1.95Pd0.05(PO4)3/C | 2.76 | 47.10 | 6.30 × 10⁻¹¹ |
| Li3V2(PO4)2.95(BO3)0.05/C | 1.38 | 87.40 | 9.34 × 10⁻¹² |
| Li3V1.95Pd0.05(PO4)2.95(BO3)0.05/C | 2.58 | 51.59 | 7.72 × 10⁻¹¹ |
4. Conclusions
In this study, the Pd-doped, BO33−-doped and anion–cation co-doped Li3V2(PO4)3/C materials were synthesized successfully using a sol–gel method. Transmission electron microscopy showed that the morphology of the materials was spherical particles with different particle sizes. Electrochemical tests showed that palladium doping, borate doping, and anion–cation co-doping methods can significantly promote the electrochemical properties of the materials, but the anion–cation co-doping method can ingeniously combine the advantages of the first two ion doping methods, showing a better discharge capacity and rate performance. In the voltage range of 2–4.3 V, the anion–cation co-doped Li3V2(PO4)3/C material delivers high special-discharge capacities of 159.2 mA h g−1 at 0.2C and 128.9 mA h g−1 at 5C. After 150 cycles with different rates, the rate recovered from 5C to 0.2C, and a favorable discharge capacity could still be obtained. The original capacity retention rate was 97.5%, showing an excellent electrochemical performance of the electrode materials. Through a series of studies, it was found that ion doping is an effective means by which to improve the properties of materials. At the same time, the ion radius, number of extranuclear electrons, their chemical properties, and other factors determine the results of the modification. Reasonable doping of different ions can give full play to the advantages of different ions and avoid their disadvantages, so as to obtain a better result.Conflicts of interest
There are no conflicts to declare.Acknowledgements
This study was supported by Natural Science Foundation of Xinjiang Uygur Autonomous Region (2017D01C231).References
- Y. Li, Z. Zhou and X. Gao, et al., A promising sol–gel route based on citric acid to synthesize Li3V2(PO4)3/carbon composite material for lithium ion batteries, Electrochim. Acta, 2007, 52(15), 4922–4926 CrossRef CAS.
- X. Y. Wang, S. Y. Yin and K. L. Zhang, et al., Preparation and characteristic of spherical Li3V2(PO4)3, J. Alloys Compd., 2009, 486(1–2), L5–L7 CrossRef CAS.
- P. Fu, Y. Zhao and Y. Dong, et al., Synthesis of Li3V2(PO4)3 with high performance by optimized solid-state synthesis routine, J. Power Sources, 2006, 162(1), 651–657 CrossRef CAS.
- M. Ren, Z. Zhou and Y. Li, et al., Preparation and electrochemical studies of Fe-doped Li3V2(PO4)3 cathode materials for lithium-ion batteries, J. Power Sources, 2006, 162(2), 1357–1362 CrossRef CAS.
- J. C. Zheng, X. H. Li and Z. X. Wang, et al., Li3V2(PO4)3 cathode material synthesized by chemical reduction and lithiation method, J. Power Sources, 2009, 189(1), 476–479 CrossRef CAS.
- S. Yu, A. Mertens and H. Kungl, et al., Morphology Dependency of Li3V2(PO4)3/C Cathode Material Regarding to Rate Capability and Cycle Life in Lithium-ion Batteries, Electrochim. Acta, 2017, 232, 310–322 CrossRef CAS.
- Y. Zhang, Y. Wang and Z. Su, Novel preparation and electrochemical characteristics of Li3V2(PO4)3/C composite materials, J. Aust. Ceram. Soc., 2017, 53(2), 539–543 CrossRef.
- Y. Zhang, Z. Su and J. Ding, Synthesis and electrochemical properties of Ge-doped Li3V2 (PO4)3/C cathode materials for lithium-ion batteries, J. Alloys Compd., 2017, 702, 427–431 CrossRef CAS.
- L. L. Zhang, Z. Li and X. L. Yang, et al., Binder-free Li3V2 (PO4)3/C membrane electrode supported on 3D nitrogen-doped carbon fibers for high-performance lithium-ion batteries, Nano Energy, 2017, 34, 111–119 CrossRef CAS.
- T. Jiang, W. Pan and J. Wang, et al., Carbon coated Li3V2 (PO4)3 cathode material prepared by a PVA assisted sol–gel method, Electrochim. Acta, 2010, 55(12), 3864–3869 CrossRef CAS.
- J. Shin, J. Yang and C. Sergey, et al., Carbon Nanofibers Heavy Laden with Li3V2 (PO4)3 Particles Featuring Superb Kinetics for High-Power Lithium Ion Battery, Adv. Sci., 2017, 4(9), 1700128 CrossRef PubMed.
- B. Wang, D. Sun and R. Guo, et al., Amorphous MnO2-modified Li3V2(PO4)3/C as high-performance cathode for LIBs: the double effects of surface coating, J. Mater. Sci., 2018, 53(4), 2709–2724 CrossRef CAS.
- X. Wang, X. Zhao and J. Wang, et al., Electrospun Li3V2(PO4)3 Nanobelts: Synthesis and Electrochemical Properties as Cathode Materials of Lithium-Ion Batteries, J. Chin. Chem. Soc., 2017, 64(5), 557–564 CrossRef CAS.
- Y. Hu, Y. Xing and J. Zhao, Design and synthesis of nano-sized Li3V2(PO4)3 particles embedded in boron-doped graphene sheets for lithium-ion batteries, Solid State Ionics, 2017, 304, 46–50 CrossRef CAS.
- J. Yan, H. Fang and X. Jia, et al., Copper incorporated in Li3V2(PO4)3/C cathode materials and its effects on high-rate Li-ion batteries, J. Alloys Compd., 2018, 730, 103–109 CrossRef CAS.
- Y. Q. Qiao, J. P. Tu and Y. J. Mai, et al., Enhanced electrochemical performances of multi-walled carbon nanotubes modified Li3V2(PO4)3/C cathode material for lithium-ion batteries, J. Alloys Compd., 2011, 509(25), 7181–7185 CrossRef CAS.
- J. Wang, X. Zhang and J. Liu, et al., Long-term cyclability and high-rate capability of Li3V2(PO4)3/C cathode material using PVA as carbon source, Electrochim. Acta, 2010, 55(22), 6879–6884 CrossRef CAS.
- S. Zhong, L. Liu and J. Liu, et al., High-rate characteristic of F-substitution Li3V2(PO4)3 cathode materials for Li-ion batteries, Solid State Commun., 2009, 149(39–40), 1679–1683 CAS.
- Y. Hu, Y. Xing and J. Zhao, Design and synthesis of nano-sized Li3V2(PO4)3 particles embedded in boron-doped graphene sheets for lithium-ion batteries, Solid State Ionics, 2017, 304, 46–50 CrossRef CAS.
- L. Jiang, C. Fu and K. Li, et al., K-doped Li3V2(PO4)3: a novel cathode material for high performance lithium-ion batteries, Mater. Lett., 2017, 198, 73–75 CrossRef CAS.
- Q. Kuang, Y. Zhao and Z. Liang, Synthesis and electrochemical properties of Na-doped Li3V2(PO4)3 cathode materials for Li-ion batteries, J. Power Sources, 2011, 196(23), 10169–10175 CrossRef CAS.
- J. S. Park, J. Kim and W. B. Park, et al., Effect of Mn in Li3V2–xMnx(PO4)3 as High Capacity Cathodes for Lithium Batteries, ACS Appl. Mater. Interfaces, 2017, 9(46), 40307–40316 CrossRef CAS PubMed.
- Q. Kuang, Y. Zhao and X. An, et al., Synthesis and electrochemical properties of co-doped Li3V2(PO4)3 cathode materials for lithium-ion batteries, Electrochim. Acta, 2010, 55(5), 1575–1581 CrossRef CAS.
- M. Choi, H. S. Kim and Y. M. Lee, et al., The electrochemical performance of Ni-added Li3V2(PO4)3/graphene composites as cathode material for Li-ion batteries, Mater. Lett., 2015, 145, 83–86 CrossRef CAS.
- X. Liu, Y. Zhao and Q. Kuang, et al., Mixing transition-metal phosphates Li3V2−xFex (PO4)3 (0≤ x≤ 2): the synthesis, structure and electrochemical properties, Electrochim. Acta, 2016, 196, 517–526 CrossRef CAS.
- S. Zhong, L. I. U. Letong and J. Jiang, et al., Preparation and electrochemical properties of Y-doped Li3V2(PO4)3 cathode materials for lithium batteries, J. Rare Earths, 2009, 27(1), 134–137 CrossRef.
- Y. Chen, Y. Zhao and X. An, et al., Preparation and electrochemical performance studies on Cr-doped Li3V2(PO4)3 as cathode materials for lithium-ion batteries, Electrochim. Acta, 2009, 54(24), 5844–5850 CrossRef CAS.
- L. Li, C. Fan and T. Zeng, et al., Electrochemical performances of Li3V2−(4/3)xTix(PO4)3/C as cathode material for Li-ion batteries synthesized by an ultrasound-assisted sol–gel method, J. Alloys Compd., 2015, 650, 136–142 CrossRef CAS.
- Y. Xia, W. Zhang and H. Huang, et al., Synthesis and electrochemical properties of Nb-doped Li3V2(PO4)3/C cathode materials for lithium-ion batteries, Mater. Sci. Eng., B, 2011, 176(8), 633–639 CrossRef CAS.
- A. V. Ivanishchev, A. V. Ushakov and I. A. Ivanishcheva, et al., Structural and electrochemical study of fast Li diffusion in Li3V2(PO4)3-based electrode material, Electrochim. Acta, 2017, 230, 479–491 CrossRef CAS.
- Y. Xia, S. Shi and C. Li, et al., Electrochemical properties of Sn-doped Li3V2(PO4)3 cathode material synthesized via a citric acid assisted sol–gel method, J. Alloys Compd., 2015, 652, 298–306 CrossRef CAS.
- Y. Liao, C. Li and X. Lou, et al., Carbon-coated Li3V2(PO4)3 derived from metal-organic framework as cathode for lithium-ion batteries with high stability, Electrochim. Acta, 2018, 271, 608–616 CrossRef CAS.
- Y. Q. Qiao, X. L. Wang and J. Y. Xiang, et al., Electrochemical performance of Li3V2 (PO4)3/C cathode materials using stearic acid as a carbon source, Electrochim. Acta, 2011, 56(5), 2269–2275 CrossRef CAS.
- Q. Kuang and Y. Zhao, Two-step carbon coating of lithium vanadium phosphate as high-rate cathode for lithium-ion batteries, J. Power Sources, 2012, 216, 33–35 CrossRef CAS.
- X. H. Rui, N. Ding and J. Liu, et al., Analysis of the chemical diffusion coefficient of lithium ions in Li3V2(PO4)3 cathode material, Electrochim. Acta, 2010, 55(7), 2384–2390 CrossRef CAS.
- M. Ren, M. Yang and W. Liu, et al., Co-modification of nitrogen-doped graphene and carbon on Li3V2(PO4)3 particles with excellent long-term and high-rate performance for lithium storage, J. Power Sources, 2016, 326, 313–321 CrossRef CAS.
- M. Ren, Z. Zhou, Y. Li, X. P. Gao and J. Yan, Preparation and electrochemical studies of Fe- Li3V2(PO4)3 cathode materials for lithium-ion batteries, J. Power Sources, 2006, 162, 1357–1362 CrossRef CAS.
- J. S. Huang, L. Yang and K. Y. Liu, One-pot syntheses of Li3V2(PO4)3/C cathode material for lithium ion batteries via ascorbic reduction approach, Mater. Chem. Phys., 2011, 128, 470–474 CrossRef CAS.
- M. Y. Saıdi, J. Barker and H. Huang, et al., Performance characteristics of lithium vanadium phosphate as a cathode material for lithium-ion batteries, J. Power Sources, 2003, 119, 266–272 CrossRef.
- M. Y. Saıdi, J. Barker and H. Huang, et al., Performance characteristics of lithium vanadium phosphate as a cathode material for lithium-ion batteries, J. Power Sources, 2003, 119, 266–272 CrossRef.
- S. C. Yin, H. Grondey and P. Strobel, et al., Charge ordering in lithium vanadium phosphates: electrode materials for lithium-ion batteries, J. Am. Chem. Soc., 2003, 125(2), 326–327 CrossRef CAS PubMed.
- Y. Si, Z. Su, Y. Wang, T. Ma and J. Ding, Improved electrochemical properties of (1-x)LiFePO4·xLi3V2(PO4)3/C composites prepared by a novel sol-gel method, New J. Chem., 2015, 39, 8971–8977 RSC.
- Y. Hu, X. Ma and P. Guo, et al., 3D graphene-encapsulated Li3V2 (PO4)3 microspheres as a high-performance cathode material for energy storage, J. Alloys Compd., 2017, 723, 873–879 CrossRef CAS.
- Z. Li, L. L. Zhang and X. L. Yang, et al., Superior rate performance of Li3V2(PO4)3 co-modified by Fe-doping and rGO-incorporation, RSC Adv., 2016, 6(13), 10334–10340 RSC.
- Q. Liu, L. Ren and C. Cong, et al., Study on Li3V2(PO4)3/C cathode materials prepared using pitch as a new carbon source by different approaches, Electrochim. Acta, 2016, 187, 264–276 CrossRef CAS.
- Y. Xia, W. Zhang, H. Huang, Y. Gan, C. Li and X. Tao, Synthesis and electrochemical properties of Nb-doped Li3V2(PO4)3/C cathode materials for lithium-ion batteries, Mater. Sci. Eng. B, 2011, 176, 633–639 CrossRef CAS.
| This journal is © The Royal Society of Chemistry 2019 |

