 Open Access Article
Characterisation of hexagonal birnessite with a new and rapid synthesis method—comparison with traditional synthesis†
Zhangjie Qin ,
Xinmin Chen,
Nanqi Ouyang,
Shuai Lan,
Guanjie Jiang,
Junxia Zhang and
Qin Zhang
 *
*
Key Laboratory of Poyang Lake Basin Agricultural Resource and Ecology of Jiangxi Province, College of Land Resource and Environment, Jiangxi Agricultural University, Nanchang 330045, China. E-mail: chincheung@live.com; Tel: +86 79183813024
First published on 19th August 2019
Abstract
Birnessite is one of the most important manganese oxides that can control the geochemical behaviors of pollutants or can be applied to form industrial products. Many studies have been conducted on the synthesis of hexagonal birnessite because different synthesis methods can affect the structural, morphological, and physicochemical properties of hexagonal birnessite. However, there are still some defects in these synthesis methods. Therefore, a new synthesis method that is rapid, simple, and low-cost was proposed in this study involving the reduction of KMnO4 by H2O2 in a H2SO4 solution without controlling the pH, temperature and pressure. Using a series of XRD, chemical composition, AOS, SSA, SEM, FTIR, and TGA analyses, Bir-H2O2 was found to have lower crystallinity than Bir-HCl. However, the AOS and SSA of Bir-H2O2 were 3.87 and 103 m2 g−1 higher than those of Bir-HCl, i.e., 3.70 and 22 m2 g−1, respectively. Moreover, both Bir-H2O2 and Bir-HCl had similar particle morphology and thermal stability; in addition, the maximum adsorption content of Pb2+ on Bir-H2O2 (∼3006 mmol kg−1) was ∼30% greater than that on Bir-HCl (∼2285 mmol kg−1) at pH 5.5; this indicated that the adsorption of Pb2+ on Bir-H2O2 was better and belonged to a pseudo-second-order model. All the abovementioned results indicate that Bir-H2O2 synthesized herein using the proposed synthesis method can have large application value.
1. Introduction
Manganese (Mn) is the second most abundant transition metal next to iron on earth and resembles iron in several aspects.1 Manganese oxides (including oxides, hydroxides, and oxyhydroxides) are widely distributed in the natural environment, controlling the biogeochemical cycles of organic and inorganic compounds.2–5 In the recent several decades, Mn oxides as important transition metal oxides have been applied in many fields, such as in ion-exchange, oxidation-reduction, catalysis, and energy conversion and storage, because of their high adsorption capacities;6,7 moreover, since the synthesis of Mn oxide materials is cheap and easy when compared with that of other noble-metal catalysts, significant attention has been paid to improve the performance of Mn oxide materials by changing their morphologies, dimensionality, size and so on.8Based on the crystal structure of Mn oxides, they can be divided into two types: tunnel and layer structures.1,9 The layer structure Mn oxides have higher cation-exchange capacity than the tunnel structure Mn oxides,10–12 especially birnessite; birnessite consists of edge-sharing MnO6 that forms a layer structure with hydrated cations in the interlayer, which compensate the layer charge deficit via the substitution of Mn4+ by either low valent Mn or octahedral layer vacancies.13–16 It is commonly found as an alteration product in Mn-rich ore deposits. Furthermore, it can play a significant role in the oxidation-reduction and cation-exchange reactions in soil and water chemistry. Moreover, because of these capabilities, birnessite has been applied in several fields, e.g., ion exchange, batteries and heterogeneous catalysis.17–21 However, all known natural birnessite samples are fine-grained and relatively poorly crystalline. Therefore, a large number of birnessites are synthesized in the lab or industry. The different performances of birnessites are closely related to the specific surface area (SSA) and average oxidation degree (AOS) of manganese, which can be affected by the synthetic conditions.
Currently, the direct redox reactions of Mn7+ or Mn2+ salts to prepare birnessite under hydrothermal conditions or at room temperature are preferred. Usually, the Mn2+ salts are oxidized by KMnO4 or O2 under alkaline conditions to prepare triclinic Na-birnessite or poorly crystalline δ-MnO2 with the morphology of hexagonal flakes or plate crystals;22–24 however, this method requires control over the selected temperature, gas bubbling conditions, and/or aging time (>4 h) and can easily generate other impurity oxides. Moreover, the reaction of KMnO4 with hydrochloric acid is often used to synthesize hexagonal birnessite,25,26 which needs heating and/or reflux conditions; in addition, using KMnO4 as the starting reagent, sol–gel processes that require long reaction times and high-temperature calcination have been proposed.27 The application of the abovementioned synthesis methods is usually limited due to the requirements of long reaction times, high reaction temperatures, gas bubbling conditions, calcination, and/or complex synthesis procedures.
Consequently, it is necessary and appealing to find a new birnessite synthesis method that is a relatively simple synthesis procedure, cost-efficient, and environmentally friendly; the reduction of KMnO4 by H2O2 to prepare α-MnO2 is an eco-friendly method, which simplifies the synthetic route and effectively improves the AOS and SSA.28–30 The only drawback of this method is long synthesis time. Therefore, in this study, a rapid one-step synthesis method was proposed using the reduction of KMnO4 by H2O2 in a H2SO4 solution based on the abovementioned approach, which could rapidly produce birnessite with higher AOS and SSA than the traditional mild hydrothermal synthesis using KMnO4 with hydrochloric acid. This new synthesis method has high potential for industrial application.
2. Materials and methods
2.1 Synthesis method of birnessite
![[thin space (1/6-em)]](https://www.rsc.org/images/entities/char_2009.gif) :
:![[thin space (1/6-em)]](https://www.rsc.org/images/entities/char_2009.gif) 1.25, 1
1.25, 1![[thin space (1/6-em)]](https://www.rsc.org/images/entities/char_2009.gif) :
:![[thin space (1/6-em)]](https://www.rsc.org/images/entities/char_2009.gif) 1.5, and 1
1.5, and 1![[thin space (1/6-em)]](https://www.rsc.org/images/entities/char_2009.gif) :
:![[thin space (1/6-em)]](https://www.rsc.org/images/entities/char_2009.gif) 1.75 were added to the abovementioned mixture solution at the rate of 5 mL min−1. During the reaction, the temperature, pH, and pressure were not controlled. Then, the product was washed with DDW, dried, powdered and named Bir-H2O2. XRD results of abovementioned three samples showed that the crystallinities of all the samples were similarly low (Fig. S1†). Therefore, we chose the product obtained with the molar ratio of 1
1.75 were added to the abovementioned mixture solution at the rate of 5 mL min−1. During the reaction, the temperature, pH, and pressure were not controlled. Then, the product was washed with DDW, dried, powdered and named Bir-H2O2. XRD results of abovementioned three samples showed that the crystallinities of all the samples were similarly low (Fig. S1†). Therefore, we chose the product obtained with the molar ratio of 1![[thin space (1/6-em)]](https://www.rsc.org/images/entities/char_2009.gif) :
:![[thin space (1/6-em)]](https://www.rsc.org/images/entities/char_2009.gif) 1.5 as a representative sample (named Bir-H2O2) to be compared with Bir-HCl.
1.5 as a representative sample (named Bir-H2O2) to be compared with Bir-HCl.2.2 Sample characterization
The obtained samples were characterized by powder XRD measurements performed via the Bruker D8 Advance diffractometer equipped with the LynxEye detector using Ni-filtered Cu Kα radiation (λ = 0.15418 nm). The diffractometer was operated at the tube voltage of 40 kV and the current of 40 mA with a 12 s counting time per 0.02° 2θ step. The chemical composition of the samples was determined using atomic absorption spectrometry (AAS, PerkinElmer AA900) and flame spectrometry (Sherwood Model 410) after dissolving 0.1000 g of sample in 25 mL of a mixed NH2OH·HCl (0.25 mol L−1) and H2SO4 (1 mol L−1) solution. The Mn AOS was obtained by a titration method.32 A mass of 0.2000 g birnessite was completely reduced to Mn2+ in 5 mL of 0.5000 mol L−1 H2C2O4 and 10 mL of 1 mol L−1 H2SO4. Excess C2O42− was determined by back-titration using a KMnO4 standard solution at 75 °C. The specific surface area (SSA) was examined by nitrogen adsorption at liquid nitrogen temperatures using Micromeritics ASAP 2020. The samples were degassed at 110 °C for 3 h under vacuum prior to the adsorption measurement. Crystallite morphologies of the samples were probed using the FEI Nova NanoSEM 450 field emission-scanning electron microscope (FESEM) after being coated with a gold evaporated film. Thermogravimetric analysis (TGA) was carried out using the NETZSCH TG 209 thermal analysis system under a N2 atmosphere at the heating rate of 10 °C min−1. Fourier transform infrared (FTIR) spectra were acquired using the Bruker VERTEX 70 FTIR spectrometer (64 scans, 4 cm−1 resolution, and wavenumber range 4000–400 cm−1).2.3 Pb2+ adsorption experiment
The Pb2+ adsorption experiments were conducted at a constant supporting electrolyte concentration (NaNO3, Ic = 0.1 mol L−1). An aliquot of 0–10 mL of 15 mmol L−1 Pb(NO3)2 (pH = 5.00 (4.50) ± 0.05) was pipetted into a series of 50 mL polyethylene tubes; then, the NaNO3 solution was added to fill the volume up to 10 mL. An aliquot of 5 mL of 1.67 g L−1 birnessite suspension, which was pre-equilibrated to the pH level of 4.5 (3.5, 5, and 5.5), was added to each tube, followed by shaking at 250 rpm for 24 h at 25 °C. The pH of the reaction system was maintained at 5.00 (4.50) ± 0.05 using a pH-stat technique. At the end of the reaction, the mixtures were centrifuged, and the supernatants were obtained for Pb2+ analyses by atomic absorption spectrometry (AAS, PerkinElmer AA900).333. Results and discussion
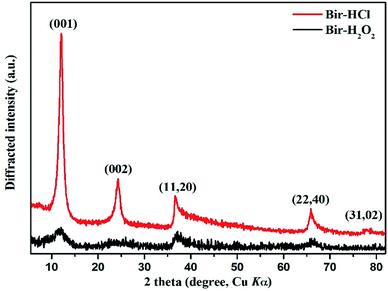
The powder XRD patterns of the two synthesized samples show (Fig. 1) that the diffraction peaks agree well with those of turbostratic birnessite reported by Dirst et al. (1997). The Bir-HCl sample exhibits five obvious characteristic peaks, i.e. (001), (002), (11, 20), (22, 40), and (31, 02), whereas the Bir-H2O2 sample has only the first four broad characteristic peaks at similar peak positions. Moreover, all the peak intensities of the Bir-HCl sample are stronger than those of the Bir-H2O2 sample. This indicates that the particle crystallinity and/or size of Bir-HCl may be greater than that of Bir-H2O2 because of their different synthesis routes and conditions. The d value ratios of the (11, 20) to (22, 40) peaks in the XRD patterns of the two samples are close to 1.73, illustrating their hexagonal symmetry. This symmetry is also confirmed by the symmetrical shape of the (31, 02) band for Bir-HCl.34For the as-synthesized birnessite, the chemical composition, Mn AOS, and SSA are shown in Table 1. The contents of Mn and K are higher in Bir-HCl than those in Bir-H2O2, whereas the content of H2O is lower in Bir-HCl than that in Bir-H2O2. Moreover, Bir-H2O2 has higher SSA, which is consistent with the results of XRD indicating its low crystallinity.35 For this type of Bir-HCl, when the Mn AOS is higher, the SSA is always lower.36 However, Bir-H2O2 has both bigger SSA and higher AOS, which is more favourable for the adsorption and oxidation of heavy metals and organic pollutants.
| Sample | Element (wt%) | Chemical components | Mn AOS | SSA (m2 g−1) | |
|---|---|---|---|---|---|
| Mn | K | ||||
| Bir-H2O2 | 46.49 | 2.44 | K0.07MnO1.97(H2O)0.60 | 3.87 | 103 |
| Bir-HCl | 3.37 | 5.81 | K0.13MnO1.96(H2O)0.50 | 3.70 | 22 |
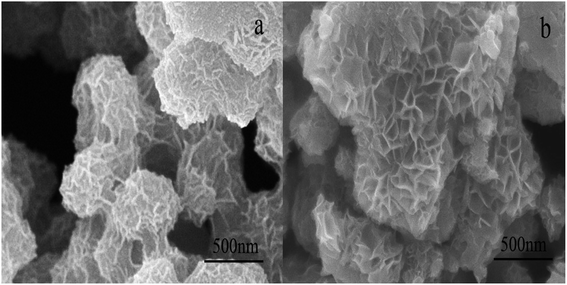
The typical morphologies of birnessite are shown in Fig. 2. It can be observed that three-dimensional hierarchical microspheres composed of two-dimensional disk-shaped pellets are formed using the two synthetic routes. The diameters of the microspheres are ∼500 nm for Bir-H2O2 and ∼700 nm (or even greater) for Bir-HCl, and the diameters of the disk-shaped pellets are ∼100–200 nm for Bir-H2O2 and ∼150–300 nm for Bir-HCl. The particle sizes of both the three-dimensional hierarchical microspheres and the two-dimensional disk-shaped pellets in Bir-H2O2 are smaller than those in the case of Bir-HCl, which are consistent with the results of XRD and SSA.
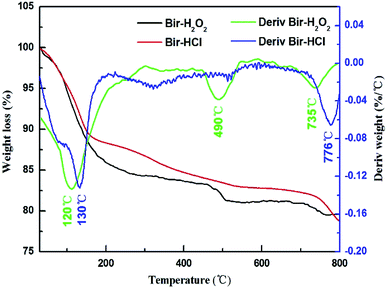
The TGA data of the two samples are shown in Fig. 3. Compared to the case of Bir-HCl, the weight loss of Bir-H2O2 is faster, as shown in the TGA curve. Bir-H2O2 has three obvious weight loss peaks at 120 °C, 490 °C, and 735 °C, and Bir-HCl has only two obvious weight loss peaks at 130 °C and 776 °C in the derivative weight curves, corresponding to three (or two) weight loss stages (physisorbed water, structural water, and lattice oxygen).37 Moreover, the temperatures of the weight loss peaks of Bir-H2O2 are slightly lower than those in the case of Bir-HCl. This indicates that the thermal stability of Bir-H2O2 is less than that of Bir-HCl. This is due to the low crystallinity and small SSA for physisorbed water and interlayer water molecules.
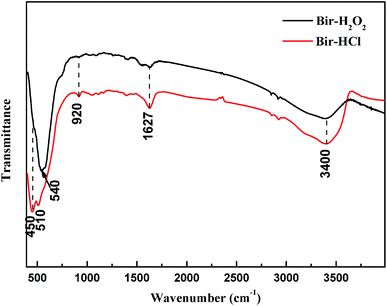
Both the synthesized birnessite samples were characterized by FTIR spectroscopy, as shown in Fig. 4. The dominant adsorption peaks at 1627 and 3400 cm−1 are assigned to the stretching and bending vibration of crystal water and adsorbed water, respectively.38 The adsorption band at 920 cm−1 is attributed to the vibration of Mn–OH located at vacant sites in the MnO6 layer,39 and the bands at ∼450, 510, and 540 cm−1 are owing to the Mn–O lattice vibration of poorly ordered birnessite.40–42 This indicates that there are different disorders, such as lattice defects, in the lattices of Bir-H2O2 and Bir-HCl and structural distributions of low valence manganese.
Isothermal adsorption curves for Pb2+ on Bir-H2O2 and Bir-HCl are plotted in Fig. 5. The curves of Pb2+ adsorption on Bir-H2O2 and Bir-HCl conform to the L-type isotherm,43 and the Pb2+ adsorption capacities increase with the increasing pH. For Bir-H2O2, the maximum Pb2+ adsorption capacity is 1471, 2205, and 3006 mmol kg−1 at pH 3.5, 4.5, and 5.5 obtained using the Langmuir fitting, as shown in Table 2, respectively. All values of R2 in the Langmuir fitting results are 0.99, indicating that the fitting method is appropriate. As the main adsorption sites of Pb2+ on birnessite are vacancy sites and edge sites,20,44 an increase in the pH can improve the content of both kinds of adsorption sites. In addition, for Bir-HCl, the maximum Pb2+ adsorption capacity is 1606, 1858, and 2285 mmol kg−1 at pH 3.5, 4.5, and 5.5, respectively (Table 2). Therefore, the maximum Pb2+ adsorption capacity for Bir-H2O2 is almost greater than that for Bir-HCl when the pH value is greater than 3.5; for example, the maximum Pb2+ adsorption capacity for Bir-H2O2 increases by ∼30% than that for Bir-HCl at pH 5.5. Furthermore, the equilibrium constant k for Bir-H2O2 is greater than that for Bir-HCl. The abovementioned results can be caused by the difference in the SSA.
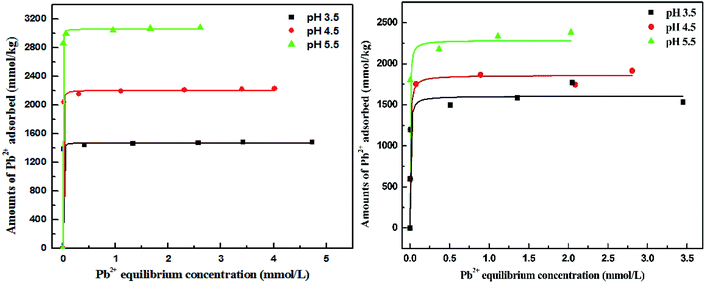 | ||
| Fig. 5 Isothermal curves of Pb2+ uptake by Bir-H2O2 (right) and Bir-HCl (left) at pH 3.5, 4.5, and 5.5. | ||
| Amax (mmol kg−1) | k | R2 | ||
|---|---|---|---|---|
| Bir-H2O2 | pH = 3.5 | 1471 | 239 | 0.99 |
| pH = 4.5 | 2205 | 724 | 0.99 | |
| pH = 5.5 | 3006 | 391 | 0.99 | |
| Bir-HCl | pH = 3.5 | 1606 | 207 | 0.76 |
| pH = 4.5 | 1858 | 181 | 0.95 | |
| pH = 5.5 | 2285 | 288 | 0.91 |
To further investigate whether the adsorption mechanism of Pb2+ on Bir-H2O2 is different from that on Bir-HCl at the maximum equilibrium constant k, the adsorption behaviors of Pb2+ on Bir-H2O2 at different times at pH 4.5 are shown in Fig. 6. The adsorption capacity of Bir-H2O2 towards Pb2+ sharply increases within ∼1 h, and almost no further increase occurs after ∼7 h (Fig. 6a). The Pb2+ adsorption rate is fast in the beginning 1 h owning to out-surface with a large number of adsorption sites, and just a little Pb2+ is needed to slowly enter the interlayer adsorption sites in the long time.44 The pseudo-first-order and pseudo-second-order kinetic models were employed to interpret the adsorption mechanism. The equations of the two different models are expressed as follows:
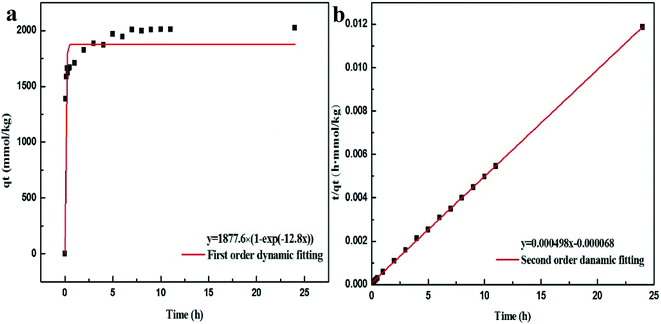 | ||
| Fig. 6 Pb2+ adsorption kinetics on Bir-H2O2: (a) first order dynamic fitting and (b) second order dynamic fitting. | ||
The pseudo-first-order equation is
ln(qe − qt) = ln![[thin space (1/6-em)]](https://www.rsc.org/images/entities/char_2009.gif) qe − k1t or qt = qe(1 − exp(−k1t)) qe − k1t or qt = qe(1 − exp(−k1t)) |
The pseudo-second-order equation is
The fitting results of the pseudo-first-order and pseudo-second-order models are shown in Fig. 6 and Table 3. It is obvious that the fitting curve using the pseudo-second-order equation is agreed better than using the pseudo-first-order equation (Fig. 6). Moreover, the fitting results of R2 and qe in the pseudo-first-order and pseudo-second-order are 0.9059 and 1877.6 mmol kg−1 and 0.9998 and 2032.1 mmol kg−1, respectively, which the latter results show R2 > 0.99 and the value of qe closing to the maximum adsorption (2205 mmol kg−1). This indicates that the adsorption of Pb2+ on birnessite follows the second-order model, which suggests that the rate limiting step can be chemisorption involving the exchange of H+ or Mn2+.11
| k (h−1 or kg (mmol−1·h−1)) | qe (mmol kg−1) | R2 | |
|---|---|---|---|
| Pseudo-first-order | 12.802 | 1877.6 | 0.9059 |
| Pseudo-second-orde | 0.00035 | 2032.1 | 0.9998 |
4. Conclusion
Compared to Bir-HCl obtained using the traditional synthesis method, Bir-H2O2 synthesized herein using a new synthesis method has many advantages in terms of material properties and Pb2+ adsorption. The lower crystallinity of Bir-H2O2 could lead to high SSA. However, the AOS of Bir-H2O2 was greater than that of Bir-HCl. The relationship between the AOS and the SSA in Bir-H2O2 differs from that in the case of Bir-HCl. Therefore, Bir-H2O2 can have better prospects of application in environmental pollution control. Moreover, Bir-H2O2 has a similar particle morphology and thermal stability to Bir-HCl. The maximum equilibrium adsorption capacity of Bir-H2O2 for Pb2+ was 3006 mmol kg−1 at pH 5.5, which was greater by ∼30% than that of Bir-HCl. The pseudo-second-order equation could be better fitted to the Pb2+ adsorption kinetics for Bir-H2O2 at pH 4.5 to explain the adsorption mechanism than the pseudo-first-order equation. All the abovementioned characteristics show that the new synthesis method that is low cost, rapid, and simple has a significant potential for application in the scientific studies, environmental remediation, and formation of industrial products such as hexagonal birnessite.Conflicts of interest
There are no conflicts to declare.Acknowledgements
The research was financially supported by the National Natural Science Foundations of China (Grants 41201225 and 41867004) and Invention Patent Industrialization Technology Demonstration Project of Jiangxi (20143BBM26104).References
- B. M. Tebo, J. R. Bargar, B. G. Clement, G. J. Dick, K. J. Murray, D. Parker, R. Verity and S. M. Webb, Annu. Rev. Earth Planet. Sci., 2004, 32, 287–328 CrossRef CAS.
- R. J. Casale, M. W. LeChevallier and F. W. Pontius, Manganese control and related issues, American Water Works Association, 2002 Search PubMed.
- A. T. Stone, Environ. Sci. Technol., 1987, 21, 979–988 CrossRef CAS PubMed.
- A. T. Stone and J. J. Morgan, Environ. Sci. Technol., 1984, 18, 617–624 CrossRef CAS PubMed.
- A. T. Stone and J. J. Morgan, Environ. Sci. Technol., 1984, 18, 450–456 CrossRef CAS PubMed.
- Z. Chen, Z. Jiao, D. Pan, Z. Li, M. Wu, C.-H. Shek, C. L. Wu and J. K. Lai, Chem. Rev., 2012, 112, 3833–3855 CrossRef CAS.
- D. Portehault, S. Cassaignon, E. Baudrin and J.-P. Jolivet, Chem. Mater., 2007, 19, 5410–5417 CrossRef CAS.
- L. Wang, Y. Ebina, K. Takada and T. Sasaki, Chem. Commun., 2004, 9, 1074–1075 RSC.
- J. E. Post, Proc. Natl. Acad. Sci. U. S. A., 1999, 96, 3447–3454 CrossRef CAS PubMed.
- K. C. Kang, H. J. Jin, S. S. Kim, H. B. Min and S. W. Rhee, J. Ind. Eng. Chem., 2011, 17, 565–569 CrossRef CAS.
- H. Yin, W. Tan, L. Zheng, H. Cui, G. Qiu, F. Liu and X. Feng, Geochim. Cosmochim. Acta, 2012, 93, 47–62 CrossRef CAS.
- H. Li, F. Liu, M. Zhu, X. Feng, J. Zhang and H. Yin, J. Environ. Sci., 2015, 34, 77–85 CrossRef CAS PubMed.
- R. Giovanoli, E. Stähli and W. Feitknecht, Helv. Chim. Acta, 1970, 53, 209–220 CrossRef CAS.
- R. Giovanoli, E. Stähli and W. Feitknecht, Helv. Chim. Acta, 1970, 53, 453–464 CrossRef CAS.
- R. G. Burns, V. M. Burns and A. J. Easton, Philos. Trans. R. Soc., A, 1977, 286, 283–301 CrossRef CAS.
- E. D. Glover, Am. Mineral., 1977, 62, 278–285 CAS.
- J. E. Post and D. R. Veblen, Am. Mineral., 1990, 75, 477–489 CAS.
- S. Bach, J. P. Pereiraramos and N. Baffier, Electrochim. Acta, 1993, 38, 1695–1698 CrossRef CAS.
- Y. F. Shen, S. L. Suib and C. L. O'Young, J. Catal., 1996, 161, 115–122 CrossRef CAS.
- Y. Wang, X. Feng, M. Villalobos, W. Tan and F. Liu, Chem. Geol., 2012, 292–293, 25–34 CrossRef CAS.
- B. A. Manning, S. E. Fendorf, B. Bostick and D. L. Suarez, Environ. Sci. Technol., 2002, 36, 976 CrossRef CAS PubMed.
- J. Luo and S. L. Suib, J. Phys. Chem. B, 1997, 101, 10403–10413 CrossRef CAS.
- J. Luo, Q. Zhang and S. L. Suib, Inorg. Chem., 2000, 39, 741–747 CrossRef CAS PubMed.
- R. Cornell and R. Giovanoli, Clays Clay Miner., 1988, 36, 249–257 CrossRef CAS.
- M. Tsuji, S. Komarneni, Y. Tamaura and M. Abe, Mater. Res. Bull., 1992, 27, 741–751 CrossRef CAS.
- F. Leroux, D. Guyomard and Y. Piffard, Solid State Ionics, 1995, 80, 299–306 CrossRef CAS.
- S. Ching, D. J. Petrovay, M. L. Jorgensen and S. L. Suib, Inorg. Chem., 1997, 36, 883–890 CrossRef CAS.
- J. Villegas, L. J. Garces, S. Gomez, J. P. Durand and S. L. Suib, Chem. Mater., 2005, 17, 1910–1918 CrossRef CAS.
- Y. Yang, L. Xiao, Y. Zhao and F. Wang, Int. J. Electrochem. Sci., 2008, 3, 67–73 CAS.
- J. Chen, X. Chen, Z. Xu, W. J. Xu, J. J. Li, H. P. Jia and J. Chen, ChemistrySelect, 2016, 1, 4052–4056 CrossRef CAS.
- R. McKenzie, Mineral. Mag., 1971, 38, 493–502 CrossRef CAS.
- N. Kijima, H. Yasuda, T. Sato and Y. Yoshimura, J. Solid State Chem., 2001, 159, 94–102 CrossRef CAS.
- W. Zhao, H. Cui, F. Liu, W. Tan and X. Feng, Clays Clay Miner., 2009, 57, 513–520 CrossRef CAS.
- S. Grangeon, B. Lanson, N. Miyata, Y. Tani and A. Manceau, Am. Mineral., 2010, 95, 1608–1616 CrossRef CAS.
- H. Yin, H. Li, Y. Wang, M. Ginder-Vogel, G. Qiu, X. Feng, L. Zheng and F. Liu, Chem. Geol., 2014, 381, 10–20 CrossRef CAS.
- H. Yin, X. Wang, Z. Qin, M. Ginder-Vogel, S. Zhang, S. Jiang, F. Liu, S. Li, J. Zhang and Y. Wang, J. Environ. Sci., 2018, 65, 282–292 CrossRef PubMed.
- S. H. Lee, T. W. Kim, D. H. Park, J. Choy, S. Hwang, N. Jiang, S. Park and Y. Lee, Chem. Mater., 2007, 19, 5010–5017 CrossRef CAS.
- J. G. Kim, J. B. Dixon, C. C. Chusuei and Y. Deng, Soil Sci. Soc. Am. J., 2002, 66, 306–315 CrossRef CAS.
- W. Zhao, F. Liu, X. Feng, W. Tan, G. Qiu and X. Chen, Clay Miner., 2012, 47, 191–204 CrossRef CAS.
- L. Kang, M. Zhang, Z. Liu and K. Ooi, Spectrochim. Acta, Part A, 2007, 67, 864–869 CrossRef PubMed.
- R. M. Potter and G. R. Rossman, Am. Mineral., 1979, 64, 1199–1218 CAS.
- C. M. Julien, M. Massot and C. Poinsignon, Spectrochim. Acta, Part A, 2004, 60, 689–700 CrossRef CAS.
- C. H. Giles, T. H. Macewan, S. N. Nakhwa and D. Smith, J. Chem. Soc., 1960, 32, 3973–3993 RSC.
- M. Villalobos, J. Bargar and G. Sposito, Environ. Sci. Technol., 2005, 39, 569–576 CrossRef CAS PubMed.
Footnote |
| † Electronic supplementary information (ESI) available. See DOI: 10.1039/c9ra03332g |
| This journal is © The Royal Society of Chemistry 2019 |

