 Open Access Article
Hofmann-like metal–organic-framework-derived PtxFe/C/N-GC composites as efficient electrocatalysts for methanol oxidation†
Jia Zhao,
Hui Huang,
Ming Liu,
Jin-Hua Wang,
Kai Liu and
Zhao-Yang Li *
*
School of Materials Science and Engineering, Nankai University, Tianjin 300350, China. E-mail: zhaoyang@nankai.edu.cn
First published on 23rd August 2019
Abstract
PtxFe/C/N-GC electrocatalysts were prepared using a composite of Hofmann-like Pt/Fe-based metal–organic frameworks and two-dimensional oxidized graphene. The PtxFe/C/N-GC-700 composite (annealed at 700 °C) exhibited an enhanced mass activity in the electrocatalytic methanol oxidation reaction, which was ten times higher than that of commercial Pt/C (20%) catalysts.
Introduction
Although direct methanol fuel cells (DMFCs) have received growing attention as clean power sources for portable communication devices, small vehicles, and other applications, the lack of highly active and durable electrode catalyst materials limits their commercial application.1–4 To date, Pt and Pt-based noble metal catalysts have been reported as ideal catalysts for the methanol oxidation reaction (MOR) due to their distinct electronic properties and chemical stabilities.5–7 However, the widespread usage of Pt is restricted by its high cost and scarce reserves,8–13 and hence, significant efforts have been devoted to reducing the Pt loading while maximizing the activity and stability of the catalysts. Alloying with transition metals (e.g., Fe,14 Co,15 Ni,16 and Cu,17 among others) is a primary method for mitigating the Pt loading, and computational investigations have indicated that Pt-transition metal alloys show significantly improved catalytic activities compared to pure Pt.18–21To date, a number of methods have been reported for the preparation of such bimetallic compounds, with the primary method being the co-reduction of transition metal salts and platinum metal salts in a range of organic solvents.22–25 However, the main drawback of this method is that long chain organic solvents cover the active sites, leading to a decrease in the catalytic activity. As such, MOFs, a type of crystalline porous material, have gained increasing attention as suitable precursors for the development of Pt-based electrocatalysts because of their diversity of structure and composition. In this context, it should be noted that Pt-based electrocatalysts are commonly prepared by two main methods. The first method is the impregnation method, where Pt ions are attracted to the surface of MOFs or encapsulated inside the MOFs, followed by high-temperature treatment,26,27 while the second method is an electrochemical route, as reported by Zhang and co-workers.28 However, both of these methods are complicated due to the large amount of Pt required, and hence are not suitable for use in commercial production.
We therefore attempted the preparation of a type of MOF in which Pt is directly coordinated in the initial framework, as this should allow simplification of the synthetic procedure. We previously found that Hofmann-type MOFs have the structure formula [Fe(L)nM′(CN)4] (n = 1 or 2 for the bridging or unidentate ligands, respectively; and M′ = Ni2+, Pd2+, Pt2+) and [Fe(L)n{M′(CN)2}2] (M′ = Ag+ or Au+).29 In such as system, the Pt atoms connect with the Fe atoms through the cyanide groups of the original frameworks, thereby providing a framework consisting of coexisting noble metals and transition metals. The use of Hofmann-type MOFs therefore simplifies the synthesis of electrocatalysts and could be employed in a commercial setting.
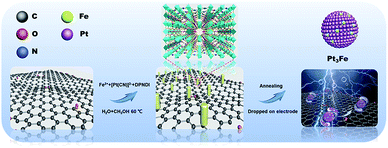
Thus, we herein propose a general strategy for the preparation of Pt-based electrocatalysts derived from Hofmann-type MOFs (Pt/Fe-MOFs), as shown in Scheme 1. To improve the mechanical properties, stability, and conductivity of the catalysts, MOFs are grown on GO (Pt/Fe-MOFs@GO). After annealing, GO is converted into reduced graphene oxide (rGO), in which the N atoms from the CN− and dipyridyl-naphthalenediimide (DPNDI) ligands were successfully doped in graphitized carbon (N-GC). Interestingly, as the annealing temperature increased, temperature-induced phase transition occurred, and PtxFe/C/N-GC-700 (Pt/Fe-MOFs@GO annealed at 700 °C) delivered the best electrocatalytic performance and durability, with a mass activity and electrochemical active surface area of 48.78 mA mg−1 and 2.9 × 10⁻⁴ m2, respectively. It should be noted that these values are 10.3 and 24.2 times higher than those of commercial Pt/C (20%) catalysts because a greater number of active sites in the main phase (Pt3Fe) are exposed on the surface of PtxFe/C/N-GC-700.30,31
Results and discussion
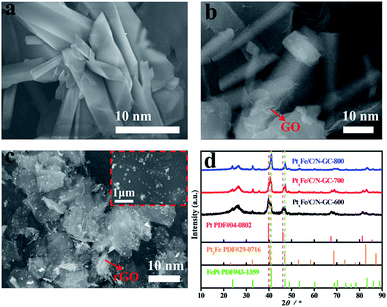
Powder X-ray diffraction (PXRD) and scanning electron microscopy (SEM) were employed to characterize the crystallite morphology and structure of the Pt/Fe-MOFs. The PXRD pattern of the Pt/Fe-MOFs (Fig. S1†) matched well with the simulated result from the single-crystal data, indicating a good phase purity. The SEM image of the Pt/Fe-MOFs (Fig. 1a) reveals their rod-like morphology, and their crystal structure (see Tables S1 and S2†) was assigned to an orthorhombic crystal system with lattice parameters of a = 15.1072 Å, b = 21.1303 Å, and c = 29.3958 Å, in addition to the Ibca space group (no. 73). The asymmetric unit contains two Fe2+ cations (Fe1 and Fe2) in different coordination environments, where one is coordinated with two methanol molecules, and the other is coordinated with two water molecules. In addition, it contains two Pt2+ cations, half of one DPNDI ligand, six CN− anions, and one H2O molecule (Fig. S2†).The SEM image of Pt/Fe-MOFs@GO (Fig. 1b) indicates that the introduction of GO has a significant effect on the MOF morphology. More specifically, the MOFs formed a single nanorod from the original nanoplate structures (Fig. 1a) due to the influence of GO. In addition, the PXRD pattern of Pt/Fe-MOFs@GO (Fig. S3†) revealed pronounced changes in the Pt/Fe-MOFs structure. Of particular importance is the absence of the prominent peak at 2θ = 5.90° in the PXRD pattern, which is likely due to GO affecting the growth direction of the Pt/Fe-MOFs, and resulting in additional constraints. In addition, a characteristic diffraction peak of GO is observed at 2θ = 11.0°, and the original peaks between 2θ = 10.0° and 30.0° disappear due to the relatively high intensity of the GO peaks compared to those of the Pt/Fe-MOFs.32–34
Furthermore, Pt/Fe-MOFs@GO were annealed at different temperatures to prepare a range of Pt-based catalysts (denoted as PtxFe/C/N-GC-600, PtxFe/C/N-GC-700, and PtxFe/C/N-GC-800, where the number indicates the annealing temperature). During the annealing process, GO was converted into rGO, as confirmed by elemental analysis (Table S3†). Fig. 1d shows the PXRD patterns of PtxFe/C/N-GC-600, PtxFe/C/N-GC-700, and PtxFe/C/N-GC-800. The main peak for PtxFe/C/N-GC-600 appears at 39.7° and corresponds to the (111) reflection planes of Pt (PDF#04-0802), while that of PtxFe/C/N-GC-700 at 40.6° is attributed to the (111) reflection planes of Pt3Fe (PDF#29-0716). Similarly, the main peak of PtxFe/C/N-GC-800 appears at 41.1° and corresponds to the (110) reflection planes of FePt (PDF#43-1359). Upon increasing the annealing temperature, the main peaks between 40° and 50° are shifted to higher angles, indicating that a phase transition takes place. More specifically, the primary phase changes to the Pt3Fe phase (700 °C) via the Pt phase (600 °C), and at an annealing temperature of 800 °C, the phase is converted into bimetallic FePt.35,36
Fig. S4† and Fig. 1c show the SEM images of PtxFe/C/N-GC-600, PtxFe/C/N-GC-800, and PtxFe/C/N-GC-700. More specifically, Fig. S4a† indicates that upon annealing at 600 °C, the topological features of the MOFs are partially retained, and the original structure is not completely destroyed. These particles have not yet undergone complete alloying. As shown in Fig. 1c, after annealing at 700 °C, the bimetallic nanoparticles are uniformly distributed on the rGO surface or embedded in the rGO sheets. Moreover, upon increasing the temperature, nanoparticle agglomeration takes place after annealing at 800 °C (Fig. S4b†), thereby leading to a decrease in the catalytic performance.
Transmission electron microscopy (TEM) was then used to further characterize the morphologies of the prepared electrocatalysts. The TEM image of PtxFe/C/N-GC-700 (Fig. 2a) shows that the PtxFe bimetallic nanoparticles are uniformly dispersed on the rGO surface. The high-resolution TEM (HRTEM) image of PtxFe/C/N-GC-700 (Fig. 2b) shows three types of lattice fringes (0.27 nm, 0.22 nm, and 0.23 nm), which match well with FePt (110), Pt3Fe (111), and Pt (111) respectively. Moreover, the scanning transmission electron microscopy (STEM) image of PtxFe/C/N-GC-700 (Fig. 2c) and the corresponding energy-dispersive spectroscopy (EDS) profile confirm the presence of C, N, Pt, and Fe. Elemental mapping (Fig. 2d) clearly reveals the coexistence of these elements on the rGO sheets, further suggesting the homogeneous distribution of PtxFe nanoparticles throughout the 2D N-doped rGO framework. Furthermore, Fig. S5 and S6† show the TEM and corresponding HRTEM images of PtxFe/C/N-GC-600 and PtxFe/C/N-GC-800, respectively. The Pt phase of PtxFe/C/N-GC-600 and the FePt phase of PtxFe/C/N-GC-800 can be clearly observed, consistent with the results of PXRD analysis.
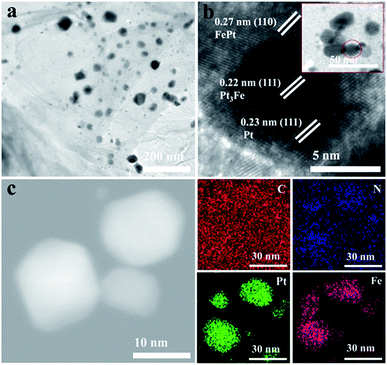 | ||
| Fig. 2 (a) TEM and (b) HRTEM images of PtxFe/C/N-GC-700. (c) STEM and the corresponding (d) EDS elemental mapping images of PtxFe/C/N-GC-700. | ||
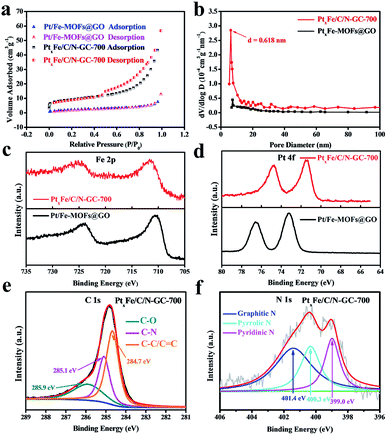
The surface areas of both the Pt/Fe-MOFs@GO and the PtxFe/C/N-GC-700 samples were then determined by Brunauer–Emmett–Teller (BET) measurements (Fig. 3a). The N2 adsorption–desorption isotherm of Pt/Fe-MOFs@GO at 77 K (BET surface area: 6.93 m2 g−1) can be classified as a typical type I isotherm, thereby indicating the presence of nonporous or partially microporous solid materials. Moreover, the isotherm of PtxFe/C/N-GC-700 (BET surface area: 32.68 m2 g−1) shows a typical reversible-type I sorption behavior with an obvious hysteresis loop, confirming the presence of slit-like microporous or mesoporous structures, and corresponding to the classic stacking pattern of graphene.37 The pore size distributions of Pt/Fe-MOFs@GO and PtxFe/C/N-GC-700 were also calculated (Fig. 3b) by the Barrett–Joyner–Halenda method, and similar pore size distributions were obtained, thereby suggesting that the microporous structures are maintained. However, the micropores had a more constant size of 0.618 nm. This higher specific surface area and more focused porous structure are therefore expected to contribute to the improved electrocatalytic activity.
Raman spectra were also recorded for the various samples (Fig. S7†). Two typical peaks are detected in all three spectra, which correspond to the D (1353 cm−1) and G (1593 cm−1) bands. The D-band is assigned to the disorder or structural defects of graphene, while the G band is attributed to the vibration of C sp2 atoms. Thus, the ID/IG (the R value) ratio was used to evaluate the degree of graphitization, and as expected, PtxFe/C/N-GC-600 had the lowest R value (R = 1.01), which suggests a lower degree of graphitization relative to those of PtxFe/C/N-GC-700 (R = 1.10) and PtxFe/C/N-GC-800 (R = 1.11). These results indicate that PtxFe/C/N-GC-700 and PtxFe/C/N-GC-800 exhibit similar degrees of graphitization, thereby suggesting that a comparative number of defects are present on the surface of the graphene sheet. However, due to agglomeration of the nanoparticles annealed at 800 °C, the catalytic performance of PtxFe/C/N-GC-700 is superior to that of PtxFe/C/N-GC-800.
X-ray photoelectron spectroscopy (XPS) was then employed to measure the chemical components and bonding natures of the various elements present on the catalyst surface layers. Fig. S8† shows the survey spectra for the samples before and after annealing at different temperatures. Upon increasing the annealing temperature, the N content decreased, indicating that some N atoms were lost and some were doped into the graphitized carbon (GC), thereby generating defects and efficiently anchoring the PtxFe bimetallic nanoparticles to act as active sites.38–41 High-resolution XPS spectra were then recorded to further examine the chemical changes taking place during annealing. As shown in Fig. 3c, the Fe 2p spectrum of PtxFe/C/N-GC-700 shifted to a slightly higher binding energy, while the Pt 4f spectrum (Fig. 3d) shifted to a slightly lower binding energy when compared to the case of Pt/Fe-MOFs@GO. This phenomenon was due to the higher electronegativity of Pt (2.2) compared to that of Fe (1.83). We note that the Pt present in PtxFe bimetallic compounds should be more metallic with a negative shift in the binding energy relative to that of the individual Pt nanoparticles, while Fe should have higher valency and show a positive shift in the binding energy.42 The XPS results therefore indicate the formation of PtxFe bimetallic compounds. As shown in the C 1 s spectrum of PtxFe/C/N-GC-700 (Fig. 3e), the C–N bonds are preserved even after annealing. In addition, the N 1 s spectrum (Fig. 3f) obtained after heating confirmed the presence of N atoms, again indicating the successful doping of N into the carbon supports. All observations are therefore in accordance with the results obtained from the EDS mapping images. Furthermore, the N 1 s spectrum (Fig. S9†) of Pt/Fe-MOFs@GO confirms the presence of CN triple bonds, consistent with the PXRD and SEM results, and demonstrates successful growth of the MOFs on GO.
Catalyst activity and stability in the MOR
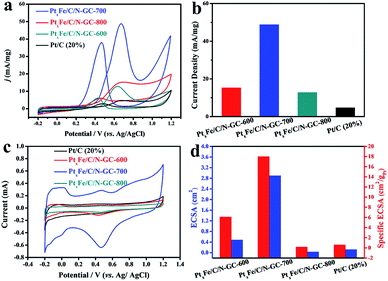
Inspired by the attractive architectural features of the as-synthesized catalysts, we carried out electrochemical measurements for the various samples and commercial Pt/C at room temperature. PtxFe/C/N-GC-700 showed the best mass activity for the MOR, as seen in Fig. 4a and b. More specifically, the mass activity of PtxFe/C/N-GC-700 was determined to be 48.78 mA mg−1 at the CVs forward peak position, which was 3.2, 3.8, and 10.3 times greater than those of PtxFe/C/N-GC-800 (15.24 mA mg−1), PtxFe/C/N-GC-600 (12.82 mA mg−1), and the commercial 20% Pt/C (4.72 mA mg−1), respectively.The cyclic voltammetry (CV) curves (Fig. 4c) for all catalysts displayed pronounced peaks between −0.2 and 1.2 V (vs. Ag/AgCl) in a N2-saturated 0.5 M H2SO4 solution, which were derived from the H2 adsorption/desorption behavior at the active sites. The coulombic charges calculated from the H2 adsorption region revealed that the as-synthesized catalysts had ECSAs (Fig. 4d) of 4.8 × 10⁻⁵ m2 (PtxFe/C/N-GC-600), 2.9 × 10⁻⁴ m2 (PtxFe/C/N-GC-700), 3.2 × 10⁻⁶ m2 (PtxFe/C/N-GC-800), and 1.2 × 10⁻⁵ m2 (20% Pt/C), indicating the exposure of a greater number of catalytically active sites for PtxFe/C/N-GC-700. To further compare the catalytic activities of the prepared catalysts, the currents were normalized with respect to both the ECSA and the Pt loading (Fig. 4d). It should be noted that PtxFe/C/N-GC-700 had the highest ECSA value, thereby indicating its superior performance. ICP-OES data of samples annealed at different temperatures are shown in Table S4.†
We then wished to further investigate the poor MOR performances of PtxFe/C/N-GC-600 and PtxFe/C/N-GC-800 compared with that of PtxFe/C/N-GC-700. It has been reported that N species play a crucial role in the electrocatalytic process,43–47 with graphitic N working as an efficient active sites.48–51 Hence, XPS was used to investigate the elemental compositions of PtxFe/C/N-GC-600, PtxFe/C/N-GC-700 and PtxFe/C/N-GC-800. The high-resolution N 1 s spectra of these three samples (see Fig. 3f, S10, and S11†) indicate the presence of three types of nitrogen species, namely pyridinic-N at 399.0 eV, pyrrolic-N at 400.0 eV, and graphitic-N at 401.0 eV. As shown in Table S5,† PtxFe/C/N-GC-700 contains a higher graphitic-N content than the other two samples, thereby giving it the greatest number of active sites and the highest ECSA. Furthermore, it has been reported that as the carbonization temperature increases, the graphitization of carbon materials will simultaneous enhance,44,52 which can effectively enhance the conductivity and charge transfer ability of the material. Based on this principle, the intrinsic electrocatalytic activity of PtxFe/C/N-GC-800 at each active site is likely to be higher than that of PtxFe/C/N-GC-700. However, due to the lower graphitic-N content of PtxFe/C/N-GC-800 compared to that of PtxFe/C/N-GC-700, and also due to an increase in the heat treatment temperature, the total N-content decreases (Table S3†), and so the mass activity of PtxFe/C/N-GC-700 is higher than that of PtxFe/C/N-GC-800. In addition, compared with PtxFe/C/N-GC-700 and PtxFe/C/N-GC-800, PtxFe/C/N-GC-600 contains the lowest graphitic-N content and the lowest degree of graphitization, and so it exhibits the worst electrocatalytic activity.
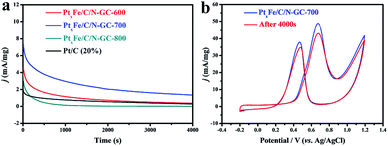
Another important aspect that determines the practical application of electrocatalysts in DMFCs is their durability. Hence, chronoamperometry was employed to evaluate the durability of the PtxFe/C/N-GC catalyst, and the i–t curves were obtained at 0.62 V (vs. Ag/AgCl) over 4000 s (Fig. 5a). As catalysts are poisoned during the oxidation reaction, a decay in the current density is observed. It has been reported that the catalysts shows a rapid current decay during the chronoamperometry measurement process due to the formation of CO-like intermediate species adsorbed on the catalyst active sites.53–56 It should be noted that PtxFe/C/N-GC-700 exhibited the highest retained current density during the electrochemical measurements, which suggests an excellent electrocatalytic stability during the MOR. Furthermore, some studies have reported that N-doped carbon support materials can enhance the durability and electrocatalytic activity by anchoring of the particles and accelerating charge transport during the catalytic process.57–63 However, upon increasing the pyrolysis temperature, the total contents of N and C species may decrease.64,65 From the elemental analysis data (Table S3†) we can verify the above statement, as PtxFe/C/N-GC-800 exhibited the lowest N and C contents, thereby leading to the FePt nanoparticles losing a certain degree of protection. This accounts for the poor performance observed in the chronoamperometry curve of PtxFe/C/N-GC-800. Moreover, the ICP-OES data (Table S6†) of the electrolyte after the chronoamperometry measurement of PtxFe/C/N-GC-800 shows the existence of trace amount of Fe and Pt species, which indicates the partial dissociation of FePt nanoparticles during the testing process. Following the chronoamperometry test, CV measurements were also performed in a solution of 0.1 M H2SO4 + 1 M CH3OH to characterize the reversible current behavior of PtxFe/C/N-GC-700 during the stability test. As shown in Fig. 5b, the forward peak current density was maintained at 88.5%, thereby indicating a good durability for this catalyst. Finally, as shown in Table S7,† the MOR performance of PtxFe/C/N-GC-700 was comparable with other reported Pt-based electrocatalysts tested under similar conditions.
Conclusions
In summary, we herein described a simple method for the preparation of Pt-based bimetallic catalysts using a composite of Hofmann-like metal–organic frameworks (MOFs) and graphene oxide, which can be employed as efficient catalysts for direct methanol fuel cells. Due to its characteristic morphology, high defect density, optimized electronic structure, and temperature-induced phase transition, the prepared PtxFe/C/N-GC-700 catalyst exhibited an enhanced electrocatalytic performance and cycle stability. The design strategy presented herein can be extended to the phase-controlled fabrication of other noble metal-based bimetallic crystals composited with N-doped high-defect graphene nanomaterials.Conflicts of interest
There are no conflicts to declare.Acknowledgements
Z. Y. Li thanks Nankai University for start-up funds for young talented researchers and professor Xian-He Bu for his invaluable assistance. This work was supported by the National Natural Science Foundation of China (NSFC, 21701088) and the Natural Science Foundation of Tianjin City (17JCYBJC41000).Notes and references
- R. Ganesan and J. S. Lee, Angew. Chem., Int. Ed., 2005, 44, 6557 CrossRef CAS PubMed.
- X. Zhao, M. Yin, L. Ma, L. Liang, C. Liu, J. Liao, T. Lu and W. Xing, Energy Environ. Sci., 2011, 4, 2736 RSC.
- C. Koenigsmann and S. S. Wong, Energy Environ. Sci., 2011, 4, 1161 RSC.
- H. Zhang, W. Ren, C. Guan and C. Cheng, J. Mater. Chem. A, 2017, 5, 22004 RSC.
- X. Yan, S. Yu, Y. Tang, D. Sun, L. Xu and C. Xue, Nanoscale, 2018, 10, 2231 RSC.
- S. Fu, C. Zhu, D. Du and Y. Lin, ACS Appl. Mater. Interfaces, 2016, 8, 6110 CrossRef CAS PubMed.
- J.-J. Fan, Y.-J. Fan, R.-X. Wang, S. Xiang, H.-G. Tang and S.-G. Sun, J. Mater. Chem. A, 2017, 5, 19467 RSC.
- M. K. Debe, Nature, 2012, 486, 43 CrossRef CAS PubMed.
- H. Xu, J. Wei, M. Zhang, C. Wang, Y. Shiraishi, J. Guo and Y. Du, J. Mater. Chem. A, 2018, 6, 24418 RSC.
- K. Eid, H. Wang, P. He, K. Wang, T. Ahamad, S. M. Alshehri, Y. Yamauchi and L. Wang, Nanoscale, 2015, 7, 16860 RSC.
- V. R. Stamenkovic, D. Strmcnik, P. P. Lopes and N. M. Markovic, Nat. Mater., 2017, 16, 57 CrossRef CAS PubMed.
- S. Kwon, D. J. Ham, T. Kim, Y. Kwon, S. G. Lee and M. Cho, ACS Appl. Mater. Interfaces, 2018, 10, 39581 CrossRef CAS PubMed.
- C. Li, T. Liu, T. He, B. Ni, Q. Yuan and X. Wang, Nanoscale, 2018, 10, 4670 RSC.
- Q. Lv, Y. Xiao, M. Yin, J. Ge, W. Xing and C. Liu, Electrochim. Acta, 2014, 139, 61 CrossRef CAS.
- B. Y. Xia, H. B. Wu, N. Li, Y. Yan, X. W. Lou and X. Wang, Angew. Chem., Int. Ed., 2015, 54, 3797 CrossRef CAS PubMed.
- S. C. Zignani, V. Baglio, D. Sebastián, T. A. Rocha, E. R. Gonzalez and A. S. Aricò, J. Electroanal. Chem., 2016, 763, 10 CrossRef CAS.
- E. V. Carino, H. Y. Kim, G. Henkelman and R. M. Crooks, J. Am. Chem. Soc., 2012, 134, 4153 CrossRef CAS PubMed.
- N. Du, C. Wang, R. Long and Y. Xiong, Nano Res., 2017, 10, 3228 CrossRef CAS.
- E. J. Coleman, M. H. Chowdhury and A. C. Co, ACS Catal., 2015, 5, 1245 CrossRef CAS.
- B.-W. Zhang, Z.-C. Zhang, H.-G. Liao, Y. Gong, L. Gu, X.-M. Qu, L.-X. You, S. Liu, L. Huang, X.-C. Tian, R. Huang, F.-C. Zhu, T. Liu, Y.-X. Jiang, Z.-Y. Zhou and S.-G. Sun, Nano Energy, 2016, 19, 198 CrossRef CAS.
- X. Huang, Z. Zhao, L. Cao, Y. Chen, E. Zhu, Z. Lin, M. Li, A. Yan, A. Zettl and Y.-M. Wang, Science, 2015, 348, 1230 CrossRef CAS PubMed.
- Y. Yu, W. Yang, X. Sun, W. Zhu, X. Z. Li, D. J. Sellmyer and S. Sun, Nano Lett., 2014, 14, 2778 CrossRef CAS PubMed.
- J. Wu, L. Qi, H. You, A. Gross, J. Li and H. Yang, J. Am. Chem. Soc., 2012, 134, 11880 CrossRef CAS PubMed.
- S. Guo, D. Li, H. Zhu, S. Zhang, N. M. Markovic, V. R. Stamenkovic and S. Sun, Angew. Chem., Int. Ed., 2013, 52, 3465 CrossRef CAS PubMed.
- J. Kim, Y. Lee and S. Sun, J. Am. Chem. Soc., 2010, 132, 4996 CrossRef CAS PubMed.
- M. Zhao, K. Yuan, Y. Wang, G. Li, J. Guo, L. Gu, W. Hu, H. Zhao and Z. Tang, Nature, 2016, 539, 76 CrossRef CAS PubMed.
- H. Liu, L. Chang, C. Bai, L. Chen, R. Luque and Y. Li, Angew. Chem., Int. Ed., 2016, 128, 5103 CrossRef.
- L. Zhang, J. M. T. A. Fischer, Y. Jia, X. Yan, W. Xu, X. Wang, J. Chen, D. Yang, H. Liu, L. Zhuang, M. Hankel, D. J. Searles, K. Huang, S. Feng, C. L. Brown and X. Yao, J. Am. Chem. Soc., 2018, 140, 10757 CrossRef CAS PubMed.
- Z.-P. Ni, J.-L. Liu, M. N. Hoque, W. Liu, J.-Y. Li, Y.-C. Chen and M.-L. Tong, Coord. Chem. Rev., 2017, 335, 28 CrossRef CAS.
- O. Omelianovych, V.-D. Dao, L. L. Larina and H.-S. Choi, Electrochim. Acta, 2016, 211, 842 CrossRef CAS.
- C. Jung, C. Lee, K. Bang, J. Lim, H. Lee, H. J. Ryu, E. Cho and H. M. Lee, ACS Appl. Mater. Interfaces, 2017, 9, 31806 CrossRef CAS PubMed.
- S. He, Z. Li, L. Ma, J. Wang and S. Yang, New J. Chem., 2017, 41, 14209 RSC.
- M. Jahan, Z. Liu and K. P. Loh, Adv. Funct. Mater., 2013, 23, 5363 CrossRef CAS.
- M. Jahan, Q. Bao, J. X. Yang and K. P. Loh, J. Am. Chem. Soc., 2010, 132, 14487 CrossRef CAS PubMed.
- T. Mohri and Y. Chen, J. Alloys Compd., 2004, 383, 23 CrossRef CAS.
- H. Okamoto, J. Phase Equilib., 2004, 25, 395 CrossRef CAS.
- L. Sun, C. Tian, M. Li, X. Meng, L. Wang, R. Wang, J. Yin and H. Fu, J. Mater. Chem. A, 2013, 1, 6462 RSC.
- D. P. He, Y. L. Jiang, H. F. Lv, M. Pan and S. C. Mu, Appl. Catal., B, 2013, 132, 379 CrossRef.
- R. Lv, T. Cui, M. S. Jun, Q. Zhang, A. Cao, D. S. Su, Z. Zhang, S. H. Yoon, J. Miyawaki and I. Mochida, Adv. Funct. Mater., 2015, 21, 999 CrossRef.
- B. Xiong, Y. Zhou, Y. Zhao, J. Wang, X. Chen, R. O'Hayre and Z. Shao, Carbon, 2013, 52, 181 CrossRef CAS.
- S. Zhao, H. Yin, D. Lei, G. Yin, Z. Tang and S. Liu, J. Mater. Chem. A, 2014, 2, 3719 RSC.
- X. X. Wang, S. H. Wang, Y. T. Pan, K. Chen, Y. He, S. Karakalos, H. Zhang, J. S. Spendelow, D. Su and G. Wu, Nano Lett., 2018, 18, 4161 Search PubMed.
- G. Wu, K. L. More, C. M. Johnston and P. Zelenay, Science, 2011, 332, 443–447 CrossRef CAS PubMed.
- Z. Y. Wu, X. X. Xu, B. C. Hu, H. W. Liang, Y. Lin, L. F. Chen and S. H. Yu, Angew. Chem., Int. Ed., 2015, 54, 8179–8183 CrossRef CAS PubMed.
- S. L. Zhang, B. Y. Guan and X. W. D. Lou, Small, 2019, 15, 1805324–1805330 CrossRef PubMed.
- H. Peng, Z. Mo, S. Liao, H. Liang, L. Yang, F. Luo, H. Song, Y. Zhong and B. Zhang, Sci. Rep., 2013, 3, 1765–1772 CrossRef.
- W. Niu, L. Li, X. Liu, N. Wang, J. Liu, W. Zhou, Z. Tang and S. Chen, J. Am. Chem. Soc., 2015, 137, 5555–5562 CrossRef CAS PubMed.
- K. Gao, B. Wang, L. Tao, B. V. Cunning, Z. Zhang, S. Wang, R. S. Ruoff and L. Qu, Adv. Mater., 2019, 31, 1805121–1805132 CrossRef PubMed.
- Y. Chen, Z. Li, Y. Zhu, D. Sun, X. Liu, L. Xu and Y. Tang, Adv. Mater., 2019, 31, 1806312–1806320 CrossRef PubMed.
- Y. Fu, H.-Y. Yu, C. Jiang, T.-H. Zhang, R. Zhan, X. Li, J.-F. Li, J.-H. Tian and R. Yang, Adv. Funct. Mater., 2018, 28, 1705094–1705104 CrossRef.
- Y. Su, Y. Zhu, H. Jiang, J. Shen, X. Yang, W. Zou, J. Chen and C. Li, Nanoscale, 2014, 6, 15080–15089 RSC.
- K. Ai, Y. Liu, C. Ruan, L. Lu and G. M. Lu, Adv. Mater., 2013, 25, 998–1003 CrossRef CAS PubMed.
- Y. Wang, J. Wang, G. Han, C. Du, Y. Sun, L. Du, M. An, G. Yin, Y. Gao and Y. Song, Appl. Surf. Sci., 2019, 473, 943–950 CrossRef CAS.
- Y.-Y. Feng, H.-S. Hu, G.-H. Song, S. Si, R.-J. Liu, D.-N. Peng and D.-S. Kong, J. Alloys Compd., 2019, 798, 706–713 CrossRef.
- M. F. R. Hanifah, J. Jaafar, M. Othman, A. Ismail, M. Rahman, N. Yusof and F. Aziz, J. Alloys Compd., 2019, 793, 232–246 CrossRef CAS.
- K. Deng, Y. Xu, D. Yang, X. Qian, Z. Dai, Z. Wang, X. Li, L. Wang and H. Wang, J. Mater. Chem. A, 2019, 7, 9791–9797 RSC.
- M. Narreddula, R. Balaji, K. Ramya, N. Rajalakshmi and A. Ramachandraiah, Int. J. Hydrogen Energy, 2019, 44, 4582–4591 CrossRef CAS.
- I. S. Pieta, A. Rathi, P. Pieta, R. Nowakowski, M. Hołdynski, M. Pisarek, A. Kaminska, M. B. Gawande and R. Zboril, Appl. Catal., B, 2019, 244, 272–283 CrossRef CAS.
- Y. Sun, Y. Zhou, C. Zhu, W. Tu, H. Wang, H. Huang, Y. Liu, M. Shao, J. Zhong, S.-T. Lee and Z. Kang, Appl. Catal., B, 2019, 244, 795–801 CrossRef CAS.
- H. Qin, X. Miao, D. Song, Y. Li, Y. Shen, J. Tang, Y. Qu, Y. Cao, L. Wang and B. Wang, Ionics, 2019, 25, 3179–3188 CrossRef CAS.
- H. Huang, S. Yang, R. Vajtai, X. Wang and P. M. Ajayan, Adv. Mater., 2014, 26, 5160–5165 CrossRef CAS PubMed.
- G.-f. Long, X.-h. Li, K. Wan, Z.-x. Liang, J.-h. Piao and P. Tsiakaras, Appl. Catal., B, 2017, 203, 541–548 CrossRef CAS.
- Y. Qin, L. Chao, J. Yuan, Y. Liu, F. Chu, Y. Kong, Y. Tao and M. Liu, Chem. Commun., 2016, 52, 382–385 RSC.
- Y. Zhao, R. Nakamura, K. Kamiya, S. Nakanishi and K. Hashimoto, Nat. Commun., 2013, 4, 2390–2397 CrossRef PubMed.
- H. B. Yang, J. Miao, S.-F. Hung, J. Chen, H. B. Tao, X. Wang, L. Zhang, R. Chen, J. Gao and H. M. Chen, Sci. Adv., 2016, 2, 1501122–1501133 CrossRef PubMed.
Footnote |
| † Electronic supplementary information (ESI) available. CCDC 1892853. For ESI and crystallographic data in CIF or other electronic format see DOI: 10.1039/c9ra04652f |
| This journal is © The Royal Society of Chemistry 2019 |

