 Open Access Article
The promoted catalytic hydrogenation performance of bimetallic Ni–Co–B noncrystalline alloy nanotubes†
Min Moab,
Mingjiang Xiea,
Xiaojuan Guoa,
Weiping Ding a and
Xuefeng Guo
 *a
*a
aKey Lab of Mesoscopic Chemistry, School of Chemistry and Chemical Engineering, Nanjing University, Nanjing 210093, China. E-mail: guoxf@nju.edu.cn; Fax: +86 25 83686251; Tel: +86 25 83595077
bDepartment of Educational Science, Hunan First Normal University, Changsha 410205, China
First published on 23rd August 2019
Abstract
A noncrystalline Ni–B alloy in the shape of nanotubes has demonstrated its superior catalytic performance for some hydrogenation reactions. Remarkable synergistic effects have been observed in many reactions when bimetallic catalysts were used; however, bimetallic noncrystalline alloy nanotubes are far less investigated. Here, we report a simple acetone-assisted lamellar liquid crystal approach for synthesizing a series of bimetallic Ni–Co–B nanotubes and investigate their catalytic performances. The dilution effect of acetone on liquid crystals was characterized by small-angle X-ray diffraction (SAXRD) and scanning electron microscopy (SEM). The Ni/Co molar ratio of the catalyst was varied to study the composition, porous structure, electronic interaction, and catalytic efficiency. In the liquid-phase hydrogenation of p-chloronitrobenzene, the as-prepared noncrystalline alloy Ni–Co–B nanotubes exhibited higher catalytic activity and increased stability as compared to Ni–B and Co–B alloy nanotubes due to electronic interactions between the nickel and cobalt. The excellent hydrogenation performance of the Ni–Co–B nanotubes was attributed to their high specific surface area and the characteristic confinement effects, compared with Ni–Co–B nanoparticles.
Introduction
Scientists are increasing their efforts to synthesize catalysts with controlled structure and morphology due to the benefits observed from the properties of natural materials when they are enhanced and the remarkable functions that result from their unique shape and/or morphology.1–3 When used as catalysts, nanotubular (NT) materials present some advantages over nanoparticles (NPs) in terms of increased surface area, low density, easy recovery, self-supporting capacity, and surface permeability.4 In particular, the inner surface of the nanotubes (NTs) is concave, and may exhibit enhanced catalytic properties relative to the exposed convex surfaces of the NPs. Their inner cavity could also function as nanoreactors to improve the reaction efficiency by remarkable confinement effects.5Although almost all of the reported studies have found that the catalytic activity of CNT-supported catalysts is enhanced,4,5 there has recently been an upsurge in the use of non-carbon support catalysts in the development of NT morphology.6–8 Noncrystalline alloys (e.g., Ni–B) are new powerful catalysts due to their unique long-range disordering with short-range ordering structure.9–12 Due to their isotropic structure, it is difficult to prepare noncrystalline alloy catalysts with NT morphology.
We first reported that noncrystalline alloy NTs (e.g., Ni–B, Co–B, Fe–B, and Ni–Cu–B) can be synthesized by a lamellar liquid crystal (LC) route, which exhibited high activity and superior selectivity in hydrogenation reactions.13–15 The lamellar LC is a nematic phase, and can be considered as a solid solution.16 This property is in favour of the formation of noncrystalline alloy NTs because of the rapid and strongly exothermic reduction of metallic ions by borohydride. However, in previous reports, some NPs generally coexisted with noncrystalline alloy NTs, which affected the performance of the NT catalysts.13,15 Although noncrystalline alloy NTs can be obtained via the LC route, it still remains a challenge to obtain high-yield noncrystalline alloy NTs with less NP counterparts.
Hydrogenation of aromatic halonitro compounds (e.g., p-chloronitrobenzene (p-CNB)) to the corresponding haloamine (e.g., p-chloroaniline (p-CAN)) is of great industrial importance, not only because aromatic haloamines are extensively used as chemical intermediates, but also because this procedure prevents environmental pollution and is a satisfactory solution that is practiced industrially on a large scale.17–19 Noncrystalline alloys have been reported to show excellent catalytic performance in the liquid phase hydrogenation of p-CNB to p-CAN for many years.20,21 Adding specific modifiers (e.g., Pd, Co, Cu, Mo, and W) to Ni–B noncrystalline alloy during the preparation is an efficient strategy to improve the catalytic behaviours of noncrystalline alloy catalysts.14,21 These promoter metals efficiently and significantly increased the activity, selectivity, and stability of catalysts.18 The second metal was expected not only to act as an electron donor ligand, thus increasing the electron density on the active metal atoms that favours the reaction kinetics, but also to endow new capabilities due to a synergistic effect between the two metals.20
In the current study, based on the LC route, we further developed an acetone-assisted lamellar LC method to greatly improve the yield and quality of noncrystalline alloy NT catalysts, and have successfully prepared a series of bimetallic Ni–Co–B noncrystalline alloy nanotubes. The dilution effect of acetone on liquid crystal was studied in detail. With a proper ratio of Ni/Co, the bimetallic NTs exhibited higher activity and better selectivity than Ni–B NTs or the corresponding NPs for the catalytic hydrogenation of p-CNB to p-CAN. Remarkably, the obtained bimetallic noncrystalline Ni–Co–B NTs possess a significantly more stable morphology than the Ni–B NTs, indicating the intriguing synergistic effect between the two metals.
Experimental
All chemicals were of analytical grade and were used as received without further purification. In a typical synthesis, the Ni–Co–B NTs were prepared as follows: NiCl2·6H2O (x mol) and CoCl2·6H2O (y mol) (x + y = 0.005 mol) were dissolved in H2O (9 mL) with (1S)-(+)-10-camphorsulfonic acid (CSA, 0.005 mol, 1.16 g) and Tween 60 (0.005 mol, 6.15 g) at 333 K. The mixture was then cooled to approximately 298 K. Acetone (5, 10, 15 mL) was added to the above mixture, which was then agitated for 15 min. A mixed solution of 4 M NaBH4 and 0.1 M NaOH was continuously pumped into the above homogeneous mixture, and the resultant mixture was maintained for 48 h under an N2 atmosphere. The obtained solid was collected and washed with distilled ethanol and water, and then dried in flowing nitrogen. The as-prepared noncrystalline alloy NTs were denoted as Ni–B NTs (without Co source), Ni–Co–B NTs-1 (with 1![[thin space (1/6-em)]](https://www.rsc.org/images/entities/char_2009.gif) :
:![[thin space (1/6-em)]](https://www.rsc.org/images/entities/char_2009.gif) 0.1
0.1![[thin space (1/6-em)]](https://www.rsc.org/images/entities/char_2009.gif) :
:![[thin space (1/6-em)]](https://www.rsc.org/images/entities/char_2009.gif) 4 of Ni
4 of Ni![[thin space (1/6-em)]](https://www.rsc.org/images/entities/char_2009.gif) :
:![[thin space (1/6-em)]](https://www.rsc.org/images/entities/char_2009.gif) Co
Co![[thin space (1/6-em)]](https://www.rsc.org/images/entities/char_2009.gif) :
:![[thin space (1/6-em)]](https://www.rsc.org/images/entities/char_2009.gif) B ratio in the starting solution), Ni–Co–B NTs-2 (1
B ratio in the starting solution), Ni–Co–B NTs-2 (1![[thin space (1/6-em)]](https://www.rsc.org/images/entities/char_2009.gif) :
:![[thin space (1/6-em)]](https://www.rsc.org/images/entities/char_2009.gif) 0.3
0.3![[thin space (1/6-em)]](https://www.rsc.org/images/entities/char_2009.gif) :
:![[thin space (1/6-em)]](https://www.rsc.org/images/entities/char_2009.gif) 4 of Ni
4 of Ni![[thin space (1/6-em)]](https://www.rsc.org/images/entities/char_2009.gif) :
:![[thin space (1/6-em)]](https://www.rsc.org/images/entities/char_2009.gif) Co
Co![[thin space (1/6-em)]](https://www.rsc.org/images/entities/char_2009.gif) :
:![[thin space (1/6-em)]](https://www.rsc.org/images/entities/char_2009.gif) B), Ni–Co–B NTs-3 (1
B), Ni–Co–B NTs-3 (1![[thin space (1/6-em)]](https://www.rsc.org/images/entities/char_2009.gif) :
:![[thin space (1/6-em)]](https://www.rsc.org/images/entities/char_2009.gif) 0.5
0.5![[thin space (1/6-em)]](https://www.rsc.org/images/entities/char_2009.gif) :
:![[thin space (1/6-em)]](https://www.rsc.org/images/entities/char_2009.gif) 4 of Ni
4 of Ni![[thin space (1/6-em)]](https://www.rsc.org/images/entities/char_2009.gif) :
:![[thin space (1/6-em)]](https://www.rsc.org/images/entities/char_2009.gif) Co
Co![[thin space (1/6-em)]](https://www.rsc.org/images/entities/char_2009.gif) :
:![[thin space (1/6-em)]](https://www.rsc.org/images/entities/char_2009.gif) B), Ni–Co–B NTs-4 (1
B), Ni–Co–B NTs-4 (1![[thin space (1/6-em)]](https://www.rsc.org/images/entities/char_2009.gif) :
:![[thin space (1/6-em)]](https://www.rsc.org/images/entities/char_2009.gif) 1
1![[thin space (1/6-em)]](https://www.rsc.org/images/entities/char_2009.gif) :
:![[thin space (1/6-em)]](https://www.rsc.org/images/entities/char_2009.gif) 4 of Ni
4 of Ni![[thin space (1/6-em)]](https://www.rsc.org/images/entities/char_2009.gif) :
:![[thin space (1/6-em)]](https://www.rsc.org/images/entities/char_2009.gif) Co
Co![[thin space (1/6-em)]](https://www.rsc.org/images/entities/char_2009.gif) :
:![[thin space (1/6-em)]](https://www.rsc.org/images/entities/char_2009.gif) B), Ni–Co–B NTs-5 (1
B), Ni–Co–B NTs-5 (1![[thin space (1/6-em)]](https://www.rsc.org/images/entities/char_2009.gif) :
:![[thin space (1/6-em)]](https://www.rsc.org/images/entities/char_2009.gif) 2
2![[thin space (1/6-em)]](https://www.rsc.org/images/entities/char_2009.gif) :
:![[thin space (1/6-em)]](https://www.rsc.org/images/entities/char_2009.gif) 4 of Ni
4 of Ni![[thin space (1/6-em)]](https://www.rsc.org/images/entities/char_2009.gif) :
:![[thin space (1/6-em)]](https://www.rsc.org/images/entities/char_2009.gif) Co
Co![[thin space (1/6-em)]](https://www.rsc.org/images/entities/char_2009.gif) :
:![[thin space (1/6-em)]](https://www.rsc.org/images/entities/char_2009.gif) B), and Co–B NTs (without Ni source). The corresponding synthetic parameters are presented in Table 1. The Ni–Co–B nanoparticles (named as Ni–Co–B NPs with 1
B), and Co–B NTs (without Ni source). The corresponding synthetic parameters are presented in Table 1. The Ni–Co–B nanoparticles (named as Ni–Co–B NPs with 1![[thin space (1/6-em)]](https://www.rsc.org/images/entities/char_2009.gif) :
:![[thin space (1/6-em)]](https://www.rsc.org/images/entities/char_2009.gif) 0.1
0.1![[thin space (1/6-em)]](https://www.rsc.org/images/entities/char_2009.gif) :
:![[thin space (1/6-em)]](https://www.rsc.org/images/entities/char_2009.gif) 4 of Ni
4 of Ni![[thin space (1/6-em)]](https://www.rsc.org/images/entities/char_2009.gif) :
:![[thin space (1/6-em)]](https://www.rsc.org/images/entities/char_2009.gif) Co
Co![[thin space (1/6-em)]](https://www.rsc.org/images/entities/char_2009.gif) :
:![[thin space (1/6-em)]](https://www.rsc.org/images/entities/char_2009.gif) B) were prepared with only CSA (without Tween 60) in 45 mL aqueous solution.
B) were prepared with only CSA (without Tween 60) in 45 mL aqueous solution.
| Sample name | Catalystsa | Composition (ICP results) | SBET (m2 g−1) | Pore size (nm) | Pore volume (cm3 g−1) | H2 uptake (μmol g−1) | Kb (min−1) | |
|---|---|---|---|---|---|---|---|---|
| 353 K (×10−2) | 373 K (×10−2) | |||||||
a The catalysts are denoted as NiCoB (x![[thin space (1/6-em)]](https://www.rsc.org/images/entities/char_2009.gif) : :![[thin space (1/6-em)]](https://www.rsc.org/images/entities/char_2009.gif) y y![[thin space (1/6-em)]](https://www.rsc.org/images/entities/char_2009.gif) : :![[thin space (1/6-em)]](https://www.rsc.org/images/entities/char_2009.gif) z), where x z), where x![[thin space (1/6-em)]](https://www.rsc.org/images/entities/char_2009.gif) : :![[thin space (1/6-em)]](https://www.rsc.org/images/entities/char_2009.gif) y y![[thin space (1/6-em)]](https://www.rsc.org/images/entities/char_2009.gif) : :![[thin space (1/6-em)]](https://www.rsc.org/images/entities/char_2009.gif) z is the atomic ratio of Ni z is the atomic ratio of Ni![[thin space (1/6-em)]](https://www.rsc.org/images/entities/char_2009.gif) : :![[thin space (1/6-em)]](https://www.rsc.org/images/entities/char_2009.gif) Co Co![[thin space (1/6-em)]](https://www.rsc.org/images/entities/char_2009.gif) : :![[thin space (1/6-em)]](https://www.rsc.org/images/entities/char_2009.gif) B in the starting solution.b K is the reaction rate constant calculated using first order reaction kinetics. B in the starting solution.b K is the reaction rate constant calculated using first order reaction kinetics. |
||||||||
| Ni–B NTs | NiB (1![[thin space (1/6-em)]](https://www.rsc.org/images/entities/char_2009.gif) : :![[thin space (1/6-em)]](https://www.rsc.org/images/entities/char_2009.gif) 4) 4) |
Ni72.2B27.8 | 115.6 | 71.2 | 0.73 | 80.1 | 1.30 | 11.6 |
| Ni–Co–B NTs-1 | NiCoB (1![[thin space (1/6-em)]](https://www.rsc.org/images/entities/char_2009.gif) : :![[thin space (1/6-em)]](https://www.rsc.org/images/entities/char_2009.gif) 0.1 0.1![[thin space (1/6-em)]](https://www.rsc.org/images/entities/char_2009.gif) : :![[thin space (1/6-em)]](https://www.rsc.org/images/entities/char_2009.gif) 4) 4) |
Ni66.2Co4.2B29.6 | 114.8 | 62.1 | 0.73 | 83.9 | 2.19 | 23.0 |
| Ni–Co–B NTs-2 | NiCoB (1![[thin space (1/6-em)]](https://www.rsc.org/images/entities/char_2009.gif) : :![[thin space (1/6-em)]](https://www.rsc.org/images/entities/char_2009.gif) 0.3 0.3![[thin space (1/6-em)]](https://www.rsc.org/images/entities/char_2009.gif) : :![[thin space (1/6-em)]](https://www.rsc.org/images/entities/char_2009.gif) 4) 4) |
Ni52.0Co8.7B39.3 | 113.7 | 63.2 | 0.73 | 83.0 | 2.12 | 20.4 |
| Ni–Co–B NTs-3 | NiCoB (1![[thin space (1/6-em)]](https://www.rsc.org/images/entities/char_2009.gif) : :![[thin space (1/6-em)]](https://www.rsc.org/images/entities/char_2009.gif) 0.5 0.5![[thin space (1/6-em)]](https://www.rsc.org/images/entities/char_2009.gif) : :![[thin space (1/6-em)]](https://www.rsc.org/images/entities/char_2009.gif) 4) 4) |
Ni45.8Co13.2B41.0 | 113.4 | 64.7 | 0.73 | 82.5 | 1.87 | 15.0 |
| Ni–Co–B NTs-4 | NiCoB (1![[thin space (1/6-em)]](https://www.rsc.org/images/entities/char_2009.gif) : :![[thin space (1/6-em)]](https://www.rsc.org/images/entities/char_2009.gif) 1 1![[thin space (1/6-em)]](https://www.rsc.org/images/entities/char_2009.gif) : :![[thin space (1/6-em)]](https://www.rsc.org/images/entities/char_2009.gif) 4) 4) |
Ni30.4Co27.1B42.5 | 110.2 | 65.1 | 0.73 | 81.7 | 1.39 | 9.35 |
| Ni–Co–B NTs-5 | NiCoB (1![[thin space (1/6-em)]](https://www.rsc.org/images/entities/char_2009.gif) : :![[thin space (1/6-em)]](https://www.rsc.org/images/entities/char_2009.gif) 2 2![[thin space (1/6-em)]](https://www.rsc.org/images/entities/char_2009.gif) : :![[thin space (1/6-em)]](https://www.rsc.org/images/entities/char_2009.gif) 4) 4) |
Ni19.5Co34.4B46.1 | 109.8 | 67.0 | 0.72 | 80.6 | 0.62 | 2.06 |
| Co–B NTs | CoB (1![[thin space (1/6-em)]](https://www.rsc.org/images/entities/char_2009.gif) : :![[thin space (1/6-em)]](https://www.rsc.org/images/entities/char_2009.gif) 4) 4) |
Co66.9B33.1 | 107.4 | 67.3 | 0.72 | 78.4 | 0.12 | 0.30 |
| Ni–Co–B NPs | NiCoB (1![[thin space (1/6-em)]](https://www.rsc.org/images/entities/char_2009.gif) : :![[thin space (1/6-em)]](https://www.rsc.org/images/entities/char_2009.gif) 0.1 0.1![[thin space (1/6-em)]](https://www.rsc.org/images/entities/char_2009.gif) : :![[thin space (1/6-em)]](https://www.rsc.org/images/entities/char_2009.gif) 4) 4) |
Ni65.4Co4.4B30.2 | 33.6 | — | — | 24.7 | 1.23 | 3.76 |
Powder X-ray diffraction (XRD) measurements were performed with a Philips X'Pert Pro MPD X-ray diffractometer with graphite-monochromated high-intensity CuKα radiation at 40 kV and 30 mA. Transmission electron microscopy (TEM) and selected-area electron diffraction (SAED) images were recorded with a JEM-100S electron microscope (JEOL) at an acceleration voltage of 80 kV. Scanning electron microscopy (SEM) images were taken with a S4800 electron microscope operating at 1.0 kV, and a gold thin film was coated on the sample before the characterization. The inductively coupled plasma (ICP) spectrometry was performed with a J-A1100 spectrometer. The nitrogen sorption isotherms were measured at liquid nitrogen temperature using an ASAP 2020 apparatus. H2 temperature programmed desorption (H2-TPD) measurements were obtained by using a Micromeritics AutoChem TP-5080 apparatus with a thermal conductivity detector. The samples were pre-treated at 473 K for 30 min in a He stream at a flow rate of 30 mL min−1 and were cooled to 373 K, followed by exposure to a H2/Ar stream for 30 min, and then, the sample was purged with a pure He stream for a certain period of time until a constant baseline was attained. H2-TPD was carried out in the range of 303–973 K at a heating rate of 10 K min−1. X-ray photoelectron spectroscopy (XPS) was performed with a Thermo ESCALAB 250 using Al Kα radiation (hν = 1486.6 eV) after etching the surface by Ar+ ions for 200 s. The spectrometer was operated at 20 eV pass energy. All the binding energy (BE) values were calibrated using C1s = 285.0 eV as a reference.
Hydrogenation of p-CNB was used to measure the catalytic performance. The 100 mL reactor was charged with 2 mmol Ni catalyst and 2.50 g of p-CNB in 60 mL of absolute ethanol solution. When the designated temperature (353 K or 373 K) was reached, hydrogen was fed to maintain the predetermined pressure (1.2 MPa) (time zero) throughout the reaction. During the experiment, samples were periodically withdrawn and analyzed with a GC-2014 Shimadzu gas chromatograph.
Results and discussion
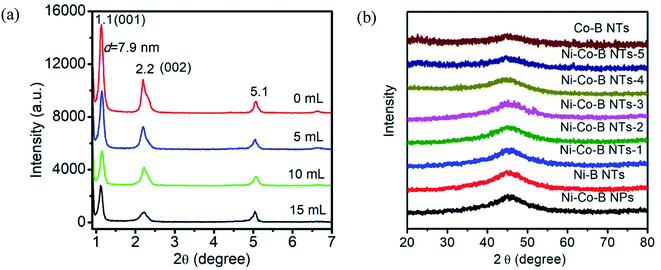
LC materials can self-organize into various nanostructured phases, such as layered, columnar, micellar, and bi-continuous cubic structures.16 Therefore, it is very important that the precursor possesses a lamellar structure, i.e., the precursor in this case is the LC template and metal sources used in the current synthesis of ternary noncrystalline alloy NTs. The precursor of the LC composite with the metal source was coated on a glass substrate, and XRD at 298 K (Fig. 1a) indicated that there were strong diffraction peaks in the small angle region of XRD, which can be indexed as the (001) and (002) reflections for the lamellar phase with a repeat distance of d = 7.9 nm. The peak at 2θ = 5.1° is due to the precipitate of camphorsulfonic acid (CSA). The lamellar LC system can be considered as a solid solution and is favourable for preparing noncrystalline alloy NTs with large surface areas. However, the drawback of the method we previously reported is that the LC is too viscose to be easily agitated.In the current synthesis, acetone was introduced to improve the fluid property of the LC precursor without altering its lamellar structure, which divides the LC system into domains, and correspondent XRD and SEM results are shown in Fig. 1a and 2a–d respectively. When the LC precursor was diluted with 5, 10, and 15 mL of acetone, the LC still retained the lamellar structure. Fig. 2 shows that the dilution with 10 mL acetone (Fig. 2c) resulted in LC domains of suitable sizes that can sufficiently react with borohydride and generate NTs. The essential physical and chemical properties of all the samples obtained in the current investigation are summarized in Table 1.
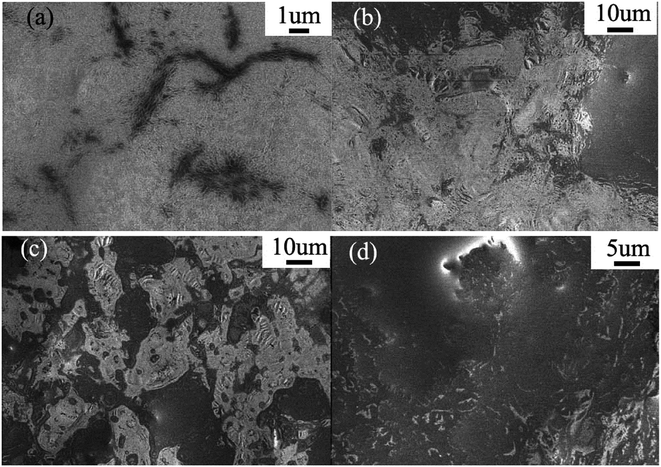 | ||
| Fig. 2 SEM images of the LCs coated on a silicon substrate diluted by (a) 0 mL, (b) 5 mL, (c) 10 mL, and (d) 15 mL of acetone. | ||
The XRD patterns of Ni–Co–B NTs with varied Co content are presented in Fig. 1b. A single broad peak at approximately 2θ = 45° in each pattern indicates that the as-prepared samples are in noncrystalline phase, and no distinct peak corresponding to any crystalline phases of nickel, cobalt, or boron is detected. It has been demonstrated that the Ni–B alloy NTs with a noncrystalline structure are beneficial for hydrogenation reactions because the noncrystalline alloy possesses a large number of coordinative unsaturated surface sites. By the addition of a second metal (Co), the ternary alloy maintains enhanced stability of its noncrystalline structure, which is important for catalytic applications.22 It appears that the Ni–Co–B NTs are all noncrystalline structures with a full range of Ni/Co ratios.
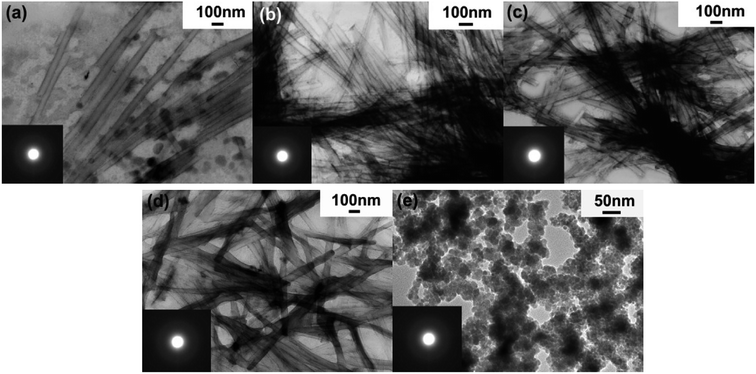
Fig. 3 shows the TEM images of Ni–Co–B NTs-1, in comparison with Ni–B NTs, Co–B NTs, and Ni–Co–B NPs. The Ni–Co–B NTs-1 prepared by the LC precursor without acetone dilution usually have poor uniformity and morphology, while NPs are always present (Fig. 3a). Noncrystalline NTs are the major product, with an estimated percentage of more than 60% according to microscopic observation of the samples. The presence of the NPs is presumably due to the weak interactions between the metal ions and surfactants in the soft-template method used. Fig. 3b shows the Ni–Co–B NTs-1 prepared by diluting the LC precursor with acetone. The NTs exhibit good uniformity with a length up to several millimeters, due to the adequate multiple interactions among the LC precursor diluted with acetone and the easy contact of BH4− with Ni2+ and Co2+. The release of hydrogen loosens and peels the nanosheets away from the lamellar template more easily and uniformly. The quality and yield of the NTs can be promoted under these conditions, and the amount of NPs decreases, as confirmed by TEM observations that indicate that more than 95% of the product is noncrystalline NTs. Fig. 3c shows the TEM image of Ni–B NTs, which are 60–65 nm in diameter and several microns in length, as we previously reported.13–15 Fig. 3d shows the TEM image of Co–B NTs, which are 70–75 nm in diameter and several microns in length. Fig. 3e shows a TEM image of Ni–Co–B NPs. The continuous broad halo rings (insets of Fig. 3a–e) from the SAED further support the noncrystalline nature of the NTs and NPs.
The N2 sorption isotherms and pore size distributions of the Ni–Co–B NTs-1 and Ni–Co–B NP samples are presented in Fig. S1.† All of the noncrystalline alloys show type IV adsorption–desorption isotherms. The presence of hysteresis loops indicates that the samples are mesoporous. The pore size distribution curves display a narrow pore-diameter range for the NTs.23
The composition and porous characteristics of the noncrystalline alloy catalysts are summarized in Table 1. In this study, the amount of the second metal (Co2+) in the starting mixture influenced the composition, pore size, and pore volume of the obtained NTs. The content of B in all Ni–Co–B noncrystalline alloy samples was apparently higher than that of the Ni–B NTs with the same Ni/B ratios in the starting materials. With the increase in the Co content in the tri-component noncrystalline alloy NTs, the pore size increases, while the surface area becomes smaller. It should be noted that all the NTs showed a much higher surface area, e.g., the Ni–Co–B NTs-1 sample has a surface area of 114.8 m2 g−1, which is larger than the surface area of the Ni–Co–B NPs with similar composition (only 33.6 m2 g−1, Table 1).
Electron states of the samples measured by XPS
Several samples, Ni–B NTs, Ni–Co–B NTs-1, and Ni–Co–B NPs, were selected for XPS investigation, and their XPS spectra are shown in Fig. 4. All the samples were etched with Ar+ for 200 seconds before the collection of the spectra of electron binding energy. As illustrated in Fig. 4a–b, two peaks at 856.2 and 852.7 eV are respectively assigned to the Ni 2p3/2 level for oxidized and elemental nickel in Ni–B NTs.20 In the B1s region, two XPS peaks with binding energies (BEs) of 188.2 and 192.4 eV are observed and assigned to elemental and oxidized boron, respectively, on the surface of the sample.22 Two XPS peaks in Fig. 4c are observed for the Co 2p3/2 level with the BEs near 777.9 and 781.2 eV, which are attributed to elemental and oxidized cobalt, respectively.24 Upon doping Co into the Ni–B NTs, the BE values of elemental Ni shifted to lower ones for Ni–Co–B NTs-1. The negative shifts are evidence that electronic enrichment occurred around Ni in the alloy NTs. The surface composition of the samples was calculated by analysis of the relative XPS peak areas. It was determined that doping Co in Ni–B NTs increased the electron density around Ni in a concentration-dependent manner according to the level of dopant.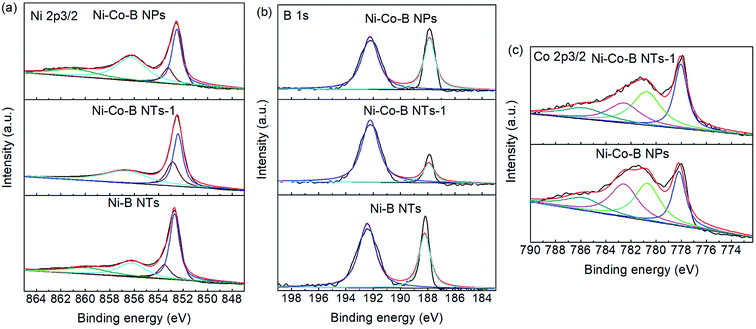 | ||
| Fig. 4 XPS spectra of Ni–Co–B NTs-1, Ni–Co–B NPs, and Ni–B NTs, etched by Ar+ for 200 s before measurement: (a) Ni 2p3/2, (b) B1s, and (c) Co 2p3/2. | ||
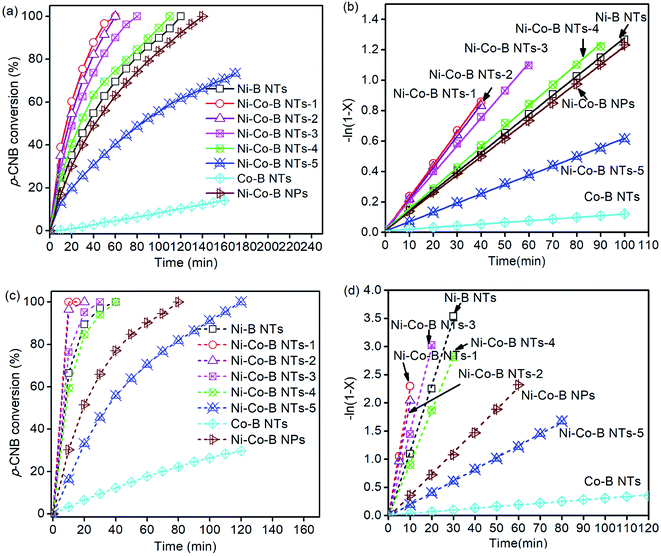
The ability of the as-prepared catalysts to hydrogenate p-CNB was tested, with the selectivity for p-CAN upon the doping of Co being taken into account, and their activities are always very high. Fig. 5a and c show the time-conversion curves of p-CNB hydrogenation on the catalysts doped with Co. The hydrogenation activity of Ni–B noncrystalline alloy NTs is much higher than that of Co–B NTs. The latter is almost low for the reaction, implying that Ni could be viewed as the main active sites for the reaction, and that Co acted as a promoter.25 The hydrogenation reaction of p-CNB can be treated as a quasi first order reaction with respect to p-CNB, by maintaining the hydrogen pressure as constant during the reaction. The plots of the reaction progress with reaction time on the different catalysts at 353 and 373 K are shown in Fig. 5b and d, respectively. The values of reaction rate constant K, i.e., the slope of the plot, and the selectivity are listed in Tables 1 and 2, respectively. The sample Ni–Co–B NTs-1, with a small amount of Co doped, has the highest reaction rate but relatively lower selectivity for p-CAN. Thereafter, the activity of the catalysts decreases with the increase in the amount of Co doped. At 353 K, the activity of Ni–Co–B NTs-1, Ni–Co–B NTs-2, Ni–Co–B NTs-3, and Ni–Co–B NTs-4 is higher than that of Ni–B NTs. With more Co doping, the sample Ni–Co–B NTs-5 is less active than Ni–B NTs.
| Sample name | Selectivity (%) 353 K | Selectivity (%) 373 K | ||||
|---|---|---|---|---|---|---|
| p-CAN | AN | NB | p-CAN | AN | NB | |
| Ni–B NTs | 96 | 3 | 1 | 88 | 9 | 3 |
| Ni–Co–B NTs-1 | 96 | 3 | 1 | 90 | 7 | 3 |
| Ni–Co–B NTs-2 | 96 | 3 | 1 | 91 | 6 | 3 |
| Ni–Co–B NTs-3 | 98 | 2 | 0 | 91 | 6 | 3 |
| Ni–Co–B NTs-4 | 99 | 1 | 0 | 92 | 6 | 2 |
| Ni–Co–B NTs-5 | 99 | 1 | 0 | 93 | 5 | 2 |
| Co–B NTs | 99 | 1 | 0 | 96 | 3 | 1 |
| Ni–Co–B NPs | 70 | 18 | 12 | 55 | 27 | 18 |
The temperature has great impact on the performance of the catalysts in hydrogenation reaction. With the temperature increased, the selectivity of p-CAN decreases. At 373 K, the activity of Ni–Co–B NTs-1, Ni–Co–B NTs-2, and Ni–Co–B NTs-3 is higher than that of Ni–B NTs. However, the samples Ni–Co–B NTs-4 and Ni–Co–B NTs-5 are less active than Ni–B NTs. The sample Ni–Co–B NPs-6 with cobalt content similar to that of Ni–Co–B NTs-1 is lowest in activity for the reaction at 353 K and 373 K. The introduction of Co to Ni–B NTs results in both positive and negative effects on the hydrogenation activities. The positive effect relates to the synergistic interaction between Ni and Co in the noncrystalline alloy Ni–Co–B NTs. The effects of Co may be attributed to its dispersion of Ni metal, resulting in the formation of additional surface Ni centers. The Ni 2p3/2 binding energy shifted to lower values upon Co doping, implying that there was an enriched electron density around Ni, and this is in agreement with the increase in the hydrogenation activities of Ni–Co–B NTs-1.23 With a larger amount of Co doping, however, the catalysts become less active than the original Ni–B NTs due to the decrease in the surface concentration of Ni active sites.
The hydrogenation activity of Ni–Co–B NTs-1 is much higher than that of Ni–Co–B NPs, as shown in Fig. 5. The composition of Ni–Co–B NPs is similar to that of Ni–Co–B NTs-1, but the surface area of Ni–Co–B NPs (33.6 m2 g−1) is less than that of Ni–Co–B NTs-1 (114.8 m2 g−1, Table 1). The nanotubular morphology provides a much higher specific surface area of the catalysts than other shapes, such as NPs. The enhancement in catalytic activity by the NTs is not merely attributed to the larger surface area. In addition to the larger surface area of the NTs, the nanotubular structure of the catalyst would also be beneficial for the catalytic performances. The inner space of the NTs has a structure-defined effect on the molecules inside the tubes, which may contribute to the improved catalytic activity.4,14,26
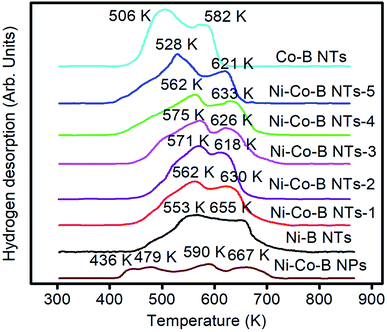
Fig. 6 shows the H2-TPD curves of all catalyst samples. The Ni–Co–B NPs exhibit multiple TPD peaks, indicating the multi-active sites possessed by the catalysts. The TPD peaks appear at approximately 436, 479, 590, and 667 K. The two peaks at 436 and 479 are due to weak adsorption of hydrogen and would be less active than the strongly adsorbed hydrogen atoms that are associated with the TPD peaks at approximately 590 and 667 K.27,28 However, only two main TPD peaks are observed for the nanotubular samples, such as Ni–Co–B NTs, Ni–B NTs, and Co–B NTs, suggesting that the NTs obtained with this preparation method contain relatively uniform active sites. Two TPD peaks over Co–B NTs are observed at temperatures lower than those from Ni–B NTs, indicating that the Ni–B NTs adsorb hydrogen more strongly than the Co–B NTs. From Ni–Co–B NTs-1 to Ni–Co–B NTs-4 catalysts, the principal TPD peak moves gradually to higher temperatures with the increase in the Co concentration, showing stronger interaction between the catalysts and hydrogen upon the formation of tri-component noncrystalline alloy NTs. The Ni–Co–B NTs-5 sample shows abnormal properties for hydrogen desorption, which appears at lower temperatures than that of Ni–B NTs. The H2 uptakes of all catalysts obtained from the H2-TPD data are also listed in Table 1. The NT samples have higher H2 uptakes than those of the corresponding NP samples, which is attributed to the difference in surface area and the NT structures among these samples.4,14,15
Fig. 7 shows the reuse results of Ni–Co–B NTs-1 and Ni–B NT catalysts. Ni–B NTs display a loss of activity of 15% and 55% at the third and the fourth times of reuse, respectively (Fig. 7a). Ni–Co–B NTs-1 exhibits a more robust reuse performance, which may be attributed to the more stable noncrystalline structure caused by the small amount of Co doping. The doping of Co into Ni–B NTs increases their adsorption for hydrogen and further diminishes the poisoning effect from the adsorption of p-CNB.24,28 Fig. 7b and c show the TEM images and the corresponding SAED data for the Ni–Co–B NTs-1 and Ni–B NTs after four cycles of a catalytic test. The tubular morphologies of the NTs remain basically unchanged. The decreases in the activity of the NTs during reuses may be due to the partial collapse of the NTs or oxidation during operation. For Ni–Co–B NTs-1, Brunauer–Emmett–Teller (BET) analysis reveals that the surface area decreased from 114.8 cm3 g−1 to 96.5 cm3 g−1 after four consecutive runs, although the NTs reserved their noncrystalline structure, according to microscopic observation and SAED.
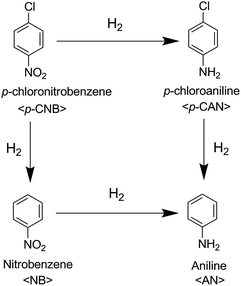
The possible reaction pathways for p-CNB hydrogenation are shown in Scheme 1. Hydrogenation of p-CNB follows two paths in the reaction. One is the hydrogenation of p-CNB to the corresponding p-chloroaniline (p-CAN), and the other is the formation of nitrobenzene (NB) due to the dehalogenation reaction. Both p-CAN and NB can be hydrogenated further to produce aniline (AN). Because the –NO2 group is more electronegative than –Cl, –NO2 will occupy the electron-rich Ni active site at the start of the reaction. Therefore, the –NO2 group adsorbed on the catalyst surface is hydrogenated to form p-CAN. When –Cl pre-occupies the catalyst surface, hydrogenation followed by dehalogenation occurs, leading to the formation of NB. The greater the electron density around the Ni active site, the higher the hydrogenation activity of the nitro group.23
In this study, the Ni–Co–B NTs-1 catalyst has the highest electron density, and therefore, it has the highest activity for hydrogenation of the nitro group and dehalogenation reaction. The Co-dopant could weaken the extent of electron donation from the Ni atoms to the aromatic ring in p-CAN, which would further suppress the hydrodechlorination of p-CAN.
Conclusions
An acetone-assisted lamellar LC method has been developed to improve the yield and quality of noncrystalline alloy NT catalysts. A series of nanotubular Ni–Co–B noncrystalline alloy catalysts with various amounts of Co have been prepared by the acetone-assisted lamellar LC method. The quality, morphology, and yield of the NTs are improved by diluting the precursory LCs with acetone, which maintains the ordered lamellar structure of the LCs and also favours the reaction between metal ions and the NaBH4 species. All the tri-component Ni–Co–B NT samples possess noncrystalline structures.The nanotubular structure, the greater surface area, and H2 adsorption of NTs, as well as the promotion of doped-Co, contribute to the increased catalytic activity and selectivity as compared to the corresponding NPs. In addition, the inner cavities of the nanotubular structures are efficient nanoreactors, in which the confinement effect contributes to the high catalytic activity. The introduction of a moderate amount of doped-Co not only tunes the electronic properties of Ni and increases the catalytic activity for p-CNB hydrogenation, but also strengthens the nanotubular stability and modifies the reuse performance of the catalysts. This work highlights the importance of intriguing synergistic effects in multi-component noncrystalline alloy NT catalysts.
Conflicts of interest
The authors declare that there are no conflicts of interest.Acknowledgements
This work was financially supported by the National Key Technology R&D Program of China (2017YFB0310704), the National Natural Science Foundation of China (21773112 and 21303083), the Natural Science Foundation of Jiangsu Province (BK20130563), the Research Foundation of the Education Bureau of Hunan Province (16B054), the 52-class General Financial Grant from the China Postdoctoral Science Foundation (2012M521041), and the Science Research Foundation of Hunan First Normal University (XYS14N02).Notes and references
- S. Zhang, M. Yu, L. Xu, S. Zhao, J. Che and X. Zhu, RSC Adv., 2017, 7, 33526 RSC.
- Z. Yang, Z. Zhang, Y. Jiang, M. Chi, G. Nie, X. Lu and C. Wang, RSC Adv., 2016, 6, 33636 RSC.
- F. Yang, S. Y. Fu, W. Chu, C. Li and D. G. Tong, RSC Adv., 2014, 4, 45838 RSC.
- X. L. Pan, Z. L. Fan, W. Chen, Y. J. Ding, H. Y. Luo and X. H. Bao, Nat. Mater., 2007, 6, 507 CrossRef CAS PubMed.
- Z. Zhuang, S. A. Giles, J. Zheng, G. R. Jenness, S. Caratzoulas, D. G. Vlachos and Y. Yan, Nat. Commun., 2016, 7, 10141 CrossRef CAS PubMed.
- F. X. Ma, H. B. Wu, B. Y. Xia, C. Y. Xu and X. W. Lou, Angew. Chem., Int. Ed., 2015, 54, 15395 CrossRef CAS PubMed.
- U. Alam, M. Fleisch, I. Kretschmer, D. Bahnemann and M. Muneer, Appl. Catal., B, 2017, 218, 758 CrossRef CAS.
- S. J. Choi, S. Chattopadhyay, J. J. Kim, S. J. Kim, H. L. Tuller, G. C. Rutledge and I. D. Kim, Nanoscale, 2016, 8, 9159 RSC.
- N. Patel, R. Fernandes and A. Miotello, J. Catal., 2010, 271, 315 CrossRef CAS.
- F. Li, R. Ma, B. Cao, J. Liang, Q. Ren and H. Song, Appl. Catal., A, 2016, 514, 248 CrossRef CAS.
- B. C. H. Guo, Z. Wan, X. Xu, H. Zhang, D. Zhao, X.-D. Chen and N. Zhang, Energy Fuels, 2018, 32, 5527 CrossRef.
- W. Feng, Y. Ma, L. Niu, H. Zhang and G. Bai, Catal. Commun., 2018, 109, 20 CrossRef CAS.
- Y. Zhu, F. Liu, W. Ding, X. Guo and Y. Chen, Angew. Chem., Int. Ed., 2006, 45, 7211 CrossRef CAS PubMed.
- M. Mo, M. Zhou, M. Xie, L. Han, X. Guo and W. Ding, Catal. Commun., 2015, 64, 66 CrossRef CAS.
- M. Mo, L. Han, J. Lv, Y. Zhu, L. Peng, X. Guo and W. Ding, Chem. Commun., 2010, 46, 2268 RSC.
- T. Kijima, T. Yoshimura, M. Uota, T. Ikeda, D. Fujikawa, S. Mouri and S. Uoyama, Angew. Chem., Int. Ed., 2004, 43, 228 CrossRef CAS PubMed.
- K. H. P. Reddy, Y. W. Suh, N. Anand and B. D. Raju, Catal. Commun., 2017, 95, 21 CrossRef CAS.
- X. Li, Y. Wang, L. Li, W. Huang, Z. Xiao, P. Wu, W. Zhao, W. Guo, P. Jiang and M. Liang, J. Mater. Chem. A, 2017, 5, 11294 RSC.
- H. Chen, D. He, Q. He, P. Jiang, G. Zhou and W. Fu, RSC Adv., 2017, 7, 29143 RSC.
- W. Wei, Y. Zhao, S. C. Peng, H. Y. Zhang, Y. P. Bian, H. X. Li and H. Li, J. Mater. Chem. A, 2014, 2, 19253 RSC.
- B. Zhao, C. J. Chou and Y. W. Chen, Ind. Eng. Chem. Res., 2010, 49, 1669 CrossRef CAS.
- J. H. Shen and Y. W. Chen, J. Mol. Catal. A: Chem., 2007, 273, 265 CrossRef CAS.
- Y. Zhu, X. K. Guo, Y. Q. Shen, M. Mo, X. F. Guo, W. P. Ding and Y. Chen, Nanotechnology, 2007, 18, 195601 CrossRef.
- H. Li, Y. Wu, J. Zhang, W. Dai and M. Qiao, Appl. Catal., A, 2004, 1–2, 199 CrossRef.
- W. L. Dai, M. H. Qiao and J. F. Deng, Appl. Surf. Sci., 1997, 120, 119 CrossRef CAS.
- F. Yang, X. Wang, D. Zhang, K. Qi, J. Yang, Z. Xu, M. Li, X. Zhao, X. Bai and Y. Li, J. Am. Chem. Soc., 2015, 137, 8688 CrossRef CAS PubMed.
- Y. J. Hou, Y. Q. Wang, L. Wang, Z. T. Mi, W. Wu and E. Z. Min, J. Rare Earths, 2004, 22, 628 Search PubMed.
- H. Li, Q. Zhao, Y. Wan, W. Dai and M. Qiao, J. Catal., 2006, 244, 251 CrossRef CAS.
Footnote |
| † Electronic supplementary information (ESI) available. See DOI: 10.1039/c9ra05540a |
| This journal is © The Royal Society of Chemistry 2019 |

