 Open Access Article
Competitive adsorption phenomenon in shale gas displacement processes
Jihong Shi a,
Liang Gong
 *a,
Shuyu Sunb,
Zhaoqin Huangc,
Bin Dinga and
Jun Yaoc
aCollege of New Energy, China University of Petroleum (East China), Qingdao 266580, China. E-mail: lgong@upc.edu.cn
bComputational Transport Phenomena Laboratory, Division of Physical Science and Engineering, King Abdullah University of Science and Technology, Thuwal 23955-6900, Saudi Arabia
cSchool of Petroleum Engineering, China University of Petroleum (East China), Qingdao 266580, China
First published on 13th August 2019
Abstract
Displacement of methane (CH4) by injection gas is regarded as an effective way to exploit shale gas and sequestrate carbon dioxide (CO2) simultaneously. To remarkably enhance the rupture and extension of fractures, an original and comprehensive simplification for the real shale composition model is established to study the shale gas displacement by gas injection. In the present model, besides the consideration in the existence of organic matter in shale, the choice of silica as inorganic minerals is firstly taken into account considering its brittleness characteristic to meet the demand of fracture stretch. Based on the model, the displacement methane process and competitive adsorption behaviors were studied by using the grand canonical Monte Carlo (GCMC) and molecular dynamics (MD) respectively. As the results, the strong interaction between carbon dioxide and shale results in the higher efficiency of displacing methane. We also find that the optimum operating conditions for CO2 and N2 displacing methane are at the pore width of 30 Å, the result being slightly different from the previous studies indicating that the displacement efficiency of small pores is higher. Moreover, the displacement efficiency by using different gases can all reach higher than 50% when the injection pressure is greater than 30 MPa. It is expected that this work can reveal the mechanisms of competitive adsorption between shale gas and gases, and provide a guidance for displacement exploitation of shale gas by gas injection and sequestration of carbon dioxide.
1. Introduction
Nowadays, high demand for energy resources and serious environmental pollution issues have led to an urgent need to discover alternative energy sources to ensure continued safe production and normal life. Among these alternative sources of energy, shale gas has gained tremendous attention as an unconventional gas resource, because of the advantages of being environmentally friendly and large volume.1–3 The main component in shale gas is CH4,4,5 which mainly exists in three forms, adsorbed state, free state and dissolved state.6,7 The volume percentage of adsorbed methane in reservoirs accounts for 70–85%.8,9 In addition, the porosity and permeability of the shale reservoirs are also ultra-low, which makes free transmission of shale gas even more difficult and brings technical challenges to the shale gas recovery. Hence, development of technologies to boost the production of shale gas is of significance. Hydro fracturing, as a widely applied method, has been used to enhance matrix permeability of unconventional reservoirs and enable the economic production of shale gas from shale reservoirs.10–12 Nevertheless, this method wastes large amount of water and causes severe environmental problems.13–15 Recently, the new method of gas injection has aroused extensive interests due to its advantages of easy accessibility, special physicochemical properties and low cost.16,17 The surface tension of supercritical carbon dioxide is almost zero and the supercritical carbon dioxide has low viscosity, which make supercritical carbon dioxide spread into shale pores easily. Carbon dioxide is considered as a good fracturing fluid to achieve efficient exploitation of shale gas. Moreover, because nitrogen is also a low viscosity gas with inert and compressible properties, nitrogen foam flooding is used in brittle and shallow shale. Hence, shale gas is not easy to desorb from shale, which significantly limits its efficient exploitation. Therefore, investigating the competitive adsorption of gases (CH4, CO2 and N2) in shale pores and the displacement of CH4 by injection gases (CO2 and N2) are highly necessary to enhance shale gas recovery.The related numeric research progress is classified according to the models adopted in the study, mainly including shale organic models and inorganic models. For shale organic models, there are three main types: kerogen, single-walled carbon nanotubes and graphite slit. Pathak et al.18 used MD method to simulate and run the kerogen–methane–carbon dioxide system model, and understood the adsorption–desorption phenomena under supercritical carbon dioxide. Huang et al.19 studied the adsorption characteristics of methane and carbon dioxide in kerogen with different maturity by GCMC method. It was found that the adsorption capacity of gas increased with the increase of kerogen maturity. Wu et al.16 used MD method to simulate the process of methane displacement in carbon nanotubes, and concluded that carbon dioxide can directly displace adsorbed methane. Yuan et al.20 used MD method to simulate the process of injecting carbon dioxide into graphene slit to displace methane, and found that carbon dioxide is more easily attached to graphene surface.
In addition to organic matters, the shale models include inorganic minerals and clay minerals. In some existing studies, there are useful inorganic minerals and clay minerals to replace the shale model. As the most abundant inorganic mineral in shale, quartz is the most suitable inorganic mineral for research. Jiao et al.21 studied the influence of wettability of quartz surface on methane adsorption characteristics. The results show that the adsorption characteristics of methane are greatly influenced by inorganic minerals such as quartz. This is the result of clay minerals accounting for a large proportion for the unique shale reservoirs. Sun et al.22 used molecular simulation method to study and compare the adsorption state of methane in different inorganic minerals such as montmorillonite. The results show that the adsorption of methane in these three clay minerals belongs to physical adsorption, and the adsorption capacity increases with the increase of pressure and decreases with the increase of temperature.
According to the previous studies, most of the shale models are nanosized and simplified.
The predecessors mainly used inorganic mineral model, clay mineral model, graphite slit model, carbon nanotube model and kerogen model and improved model, all of which considered only one aspect of organic or inorganic. For the shale matrix, it is indispensable to simplify the complicated structure of the shale matrix to deal with the complex situation because real shale reservoirs are composed of organic matters and inorganic minerals. It was argued that the clay-rich shale as the crystal structure of montmorillonite with changing basal spacing and number of ions could represent the shale. However, this model ignores the organic matters, so it is necessary to construct an all-atom shale model including inorganic minerals and organic matters to investigate the displacement methane by gas injection. Compared with a slit shale model consisting of montmorillonite and methylnaphthalene constructed by Zhang et al.,34 we use two silica sheets to represent for inorganic minerals in shale. For displacement by gas injection, the brittleness of silica can make the fracture extension more smoothly, which can be more consistent with the real condition. Previous studies mainly focused on the displacement processes of pure methane and mixed methane; however, the adsorption occurrences of gases in the slit pores have not been discussed in-depth. Therefore, it is important to clarify the adsorption states of gas in shale comprehensively. In addition, based on the knowledge of the adsorption mechanisms of gases, the displacement of methane by carbon dioxide and nitrogen is also studied.
The purpose of this work is to propose a modified and generalized shale model including inorganic silica and organic matters to investigate the displacement of methane by injection gases. The main contributions are summarized as follows:
(1) According to the actual composition of shale, which consists of inorganic minerals and organic matters, two silica sheets were used to represent the inorganic minerals. The quartz plays a significant role because its brittleness is favorable to fracture propagations. The methylnaphthalene molecules adsorbed in the pores stand for organic matters.
(2) The displacement of methane by gas injection was investigated in different pore sizes. Compared with the displacement of methane by nitrogen, injecting carbon dioxide is considered as a more effective method to development shale gases. The displacement mechanisms about different injection gases were analyzed accordingly.
(3) The adsorption occurrences of gases in shale were investigated at different pore sizes. The adsorption states of gases over the entire scale including micropores, mesopores and macrospores were fully discussed and thoroughly evaluated.
2. Simulation details
In order to simulate the displacement processes of shale gas by injection gases more accurately, the real original shale model was constructed, including the organic matters and inorganic minerals. Then, the GCMC method was used to investigate the displacement of methane by injection gases. Once the adsorption configuration was accomplished, the adsorption occurrences of gases in different pore sizes were studied using the MD method.2.1. Shale models
Many researches revealed that shales are typically composed of variable amount of organic matters (kerogen, bitumen) and inorganic minerals, such as quartz, dolomite, calcite, and clay.23 First, two silica sheets were used to represent inorganic minerals. The reason for choosing silica is that quartz's brittleness is favorable to fracture propagation,23,24 and this characteristic of silica is close to the actual situation of shale. The initial silica lattice was derived from the structure database of Material Studio software.25 A repeated unit with the thickness 3.0 nm was cleaved along the (110) crystallographic orientation. The polycyclic aromatic hydrocarbon is a major organic component of shale matrix, especially for shale gas reservoirs. Therefore, methylnaphthalene molecules are used to stand for the organic matters in the shale matrix here.A simulation box was constructed to (32.43 × 39.30 × c Å3), which contains two inorganic layers and two organic layers (see Fig. 1). The silica sheets were used to represent the inorganic layers. First, two perfect silica sheets were stacked each other in such a way as shown in Fig. 1. Then, a set of methylnaphthalene molecules were absorbed into the interlayer space, where the pore size of the model was adjustable through the basal spacing. The methylnaphthalene molecules absorbed into the interlayer space were fixed as the organic matters are in the shale matrix.26
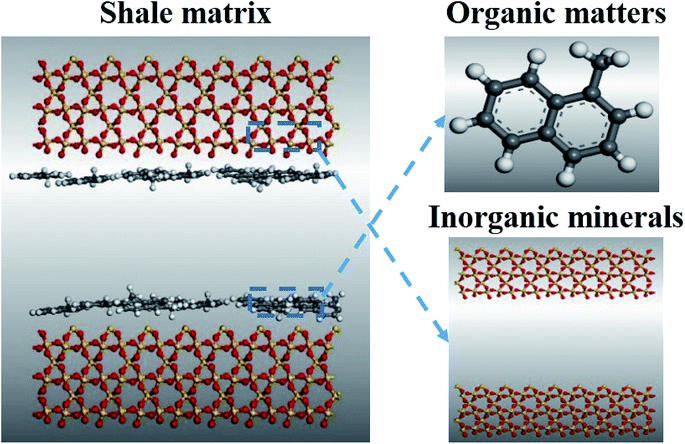 | ||
| Fig. 1 Model of shale matrix. Color scheme: yellow, silicon; red, oxygen; white, hydrogen; black, carbon. | ||
2.2. Methods
The accuracy of molecular dynamics simulations depends on the correct selections of both mathematical equations and interaction parameters for the potential energy. In this work, the interatomic interactions are described by the force field of condensed-phase optimized molecular potential for atomistic simulation studies (COMPASS),27 which is a general all-atom force field. It is a parameterized, tested and validated by first ab initio force field, which enables an accurate and simultaneous prediction of various gas-phase properties and condensed-phase properties of most of common organic and inorganic materials. The non-bond interactions, which include a LJ-9-6 function for the van der Waals (vdW) term and a coulombic function for an electrostatic interaction, are used for interactions between pairs of atoms that are separated by two or more intervening atoms or those that belong to different molecules. The total potential of the simulated system involves the Lennard-Jones (L-J) and Coulomb terms:
 | (1) |
The GCMC method was taken to simulate the displacement processes of CH4 by CO2 and N2. The simulations of adsorption of gases molecules were performed in the grand canonical (μVT) ensemble. For simulations of gas molecules in shale pores, in each MC cycle, a trial random displacement was applied to all gas molecules and a gas molecule was randomly removed from or inserted into the simulation box. The temperature and the pressure of CH4 were 313 K and 15 MPa respectively, corresponding to the situation of the shale gas at the geological depth of 1 km. Next, carbon dioxide and nitrogen were injected into the pores. The injection pressure rose from 0 to 100 MPa. The equalized structure was obtained at the end of the simulations. In order to adjust the atomic coordinates to reach a stable initial configuration, the equalized structure was minimized using the conjugate gradient algorithm. Then, the MD method was employed to study the density profiles of the three kinds of gases. The model was relaxed for 2 ns in an NVT ensemble (constant number of atoms, isovolumetric, and isotherm conditions) with a time step of 1 fs. The temperature was controlled by a Nose–Hoover thermostat. Once the temperature, total energy, and pressure of this model became time-independent, the equilibrium achieved. In the last stage, a simulation of 2 ns in an NVE ensemble (constant number of atoms, isovolumetric, and constant energy conditions) was conducted with a time step of 1 fs, and the data was recorded for analysis. During the whole simulations, all the atoms of the shale matrix model were fixed as rigid materials. All the GCMC simulations and MD simulations were conducted by SORPTION code and FORCITE TOOLS respectively in the Material Studio (MS) software developed by Accelrys Inc.28,29
2.3. Modeling validation
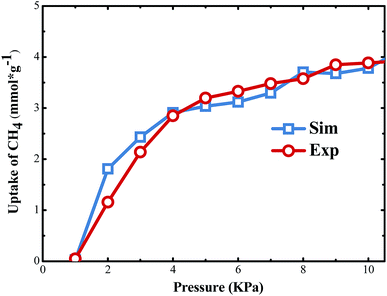
The shale model composed of silica sheets and methylnaphthalene molecules was proposed. However, the authenticity and accuracy of the model still need to be verified. To validate the proposed shale model, the model data was compared with the experimental data. The experimental data comes from a study on quantitative characterization of adsorption capacity of shale.30 During the experiment, the shale models they used also included the organic matters and inorganic minerals. The experiment temperature was 363.15 K. The total organic content (TOC) was 5.08%. Correspondingly, the simulation temperature is also 363.15 K. Then ten methylnaphthalenes adsorbed in the silt pore of 10 Å. Next, the adsorption isotherms of CH4 were investigated. The simulation results and experimental results are presented in Fig. 2. It can be easily observed that the adsorption isotherm trends from the two methods are similar. Therefore, the original model is reasonable and accurate. This model can be used in the following research as shale environment to investigate the adsorption and displacement of CH4 by injection gases in shale.3. Results and discussion
In order to develop shale gas efficiently, organic matters were combined with inorganic minerals to build the shale model. To solve the problems of shale gas adsorption and displacement, the adsorption and displacement of methane by injection gases were carried out by using MD and GCMC methods respectively. First, the displacement processes of methane by carbon dioxide and nitrogen were compared at the pore width of 25 Å. Then, the occurrences of adsorption gases in different pore sizes from 10 to 60 Å were discussed. With the understanding of the adsorption states of gases in the pores, the displacements of methane by carbon dioxide and nitrogen were studied quantitatively in different pore sizes.3.1. Comparison of displacements of methane by carbon dioxide and nitrogen
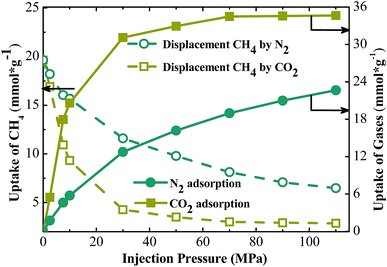
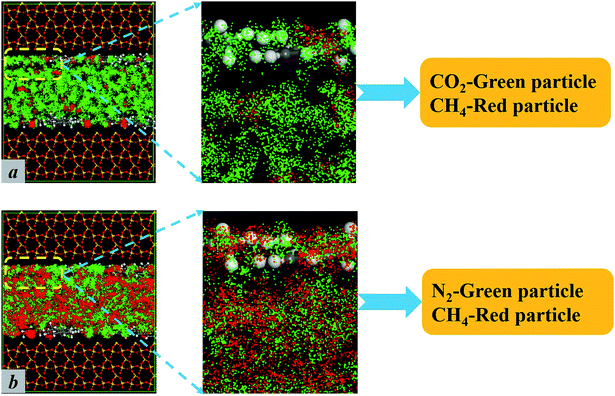
Both N2 and CO2 can be used to displace gases. However, the studies in this paper found that the displacement mechanisms of these gases are different, as shown in Fig. 3. The pore width is set at 25 Å in the work. Fig. 3 shows the loading amount of CH4 at different injection pressure. In the case of displacing CH4 by carbon dioxide, the loading amount of methane decreases significantly as the partial pressure of CO2 increases, compared with the case of displacing CH4 by N2. Both kinds of gas displacements display sharp declines in the loading amount of CH4. Correspondingly, the sequestration amount of CO2 also increases rapidly in both cases as shown in Fig. 3. The screenshots of different displacement processes are shown in Fig. 4. More CO2 displaces the methane concentrating in the adsorbed layer, and N2 can only displace less. When CO2 is added into the pores, the entire space is filled with CO2 molecules. CO2 molecules begin to occupy adsorption sites of CH4 and replace the adsorbed CH4 molecules directly. Afterwards, the displaced CH4 molecules return to the free phase. The order of the adsorption capacities of these three gases is CO2 > CH4 > N2. When N2 is injected, N2 molecules cannot occupy adsorption sites of CH4 and can only adsorb on the vacancies because the adsorption capacity of N2 is weaker than that of CH4. N2 molecules are able to displace CH4 because they can reduce the partial pressure of CH4. Once the partial pressure of CH4 decreases, CH4 molecules are displaced and desorbed. When CO2 or N2 is injected, the loading amount of methane experiences a downward trend.3.2. Occurrence behaviors of gases in different pores
As discussed in the previous section, the efficiency of displacement of methane by carbon dioxide is higher than by nitrogen. The snapshots from the previous section qualitatively present the adsorption states of carbon dioxide and nitrogen molecules in the pores, and these results qualitatively clarify the mechanisms of the two injection methods. This section quantifies the competitive adsorption amount of methane, carbon dioxide and nitrogen in different pores, and draws the density profiles of these gases in the pores. Thus, a series of shale models of different pore sizes from 10 Å to 60 Å were built. All of these shale models experienced the GCMC process to achieve the adsorption equilibrium states of adsorption at injection pressure of 90 MPa. Then, the density profiles of gases in pores were analyzed after MD simulations. The density profiles of gases in different pores are plotted in Fig. 5.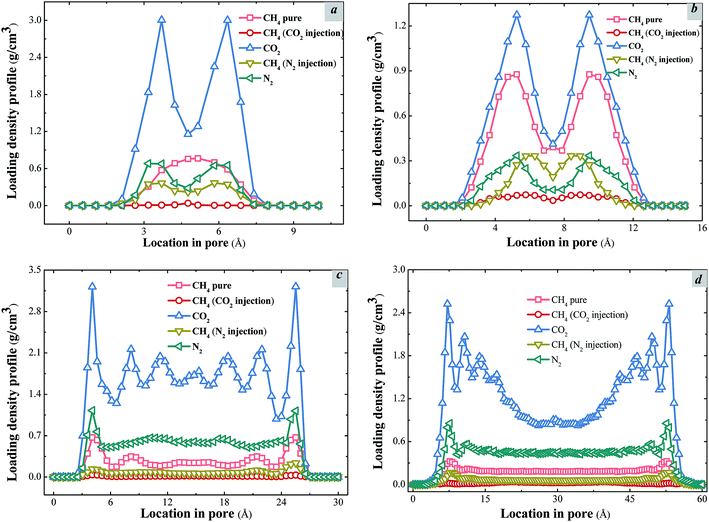 | ||
| Fig. 5 Loading density profiles and adsorption states of methane in different pores. (a) H = 10 Å; (b) H = 15 Å; (c) H = 30 Å; (d) H = 60 Å. | ||
The adsorption occurrences of gases (CH4, CO2 and N2) in different pore sizes are different obviously. When the large amount of gases accumulates in a specific area, there is an adsorption layer. In Fig. 5, different adsorption peaks represent adsorption layers. For the adsorption occurrences of methane in different pores, the transition from single peak to two peaks and then to four peaks was observed. As shown in Fig. 5a, when the pore width is 10 Å, carbon dioxide molecules near the walls form two high peak adsorption layers due to the strong force between carbon dioxide and the walls. Since there is still some space in the central area of the pore, a small amount of displaced methane still distributes in this area, but no apparent adsorption peak of methane appears. Similarly, nitrogen molecules also form two adsorption layers near the walls, but the density is far below that of carbon dioxide, which leads to two adsorption peaks of methane next to the walls and the reduction of methane in the pore center to some extent. When the pore size increases to 15 Å, as shown in Fig. 5b, the single adsorption layer of methane becomes two adsorption layers with the highest peaks. It can be seen that carbon dioxide molecules can still displace more methane than nitrogen, and the peak values of two adsorption layers significantly decrease. In addition to a part of the molecules adsorbed next to the walls, some molecules dispersing in the entire space of the pore causes the methane molecules to form an adsorption valley at the pore center.
In Fig. 5c, when the pore size becomes 30 Å, four lower peaks of methane adsorption layers, including two primary and two secondary adsorption layers appear. Carbon dioxide molecules form a pair of primary peaks and two pairs of low adsorption peaks since with the increase of the pore width, more space is available for the adsorption of carbon dioxide molecules. Apart from the strong adsorption force near walls, two low adsorption layers followed are formed next to the primary adsorption layers. The great increase of the CO2 adsorption capacity results in the rapid decrease of the methane adsorption capacity. Fig. 5d displays the results for the pore size of 60 Å. It can be seen that the methane molecules maintain at the similar density in large space. The density of the bulk phase keeps at 0.2 g cm−3 at the pore width of 60 Å. Carbon dioxide molecules drive a large amount of methane molecules and form four pairs of adsorption layers. At the same time, the number of methane molecules near the walls decrease significantly and only a small amount of methane molecules remains in the central pore area. In contrast, nitrogen can only drive a certain amount of methane molecules from the walls, the low methane adsorption layers near the walls can still observed. Moreover, two symmetrical menisci structures will form near the pore mouths.31 Furthermore, with the development of competitive adsorption, the menisci withdraw toward the pore interior, which is consistent with the sharp decrease of the methane density profile in the central of pores. Hence, this may explain the formation of two low adsorption peaks near the wall and a steep drop in density profile in the central of the pore due to this structure, thus forming an adsorption valley. As the pore width increases from 10 Å to 60 Å, the occurrence states of different gases changed remarkably. It is proved numerically the attractive potentials between carbon dioxide and shale matrix atoms are stronger than that of methane and nitrogen. Simultaneously, through the study of the density profile of different gases, the occurrence states of different gases in shale during the injection process can be clarifying, which provides some theoretical support for the injection gases method.
From the above discussion, it was found that the adsorption occurrences of gases change greatly in different pore sizes. These adsorption peaks occur in different positions from the top wall to the bottom wall of the pores. In order to show the states of molecular occurrences more intuitively, the snapshots of the adsorption models of two different pore sizes are given. We choose two typical pores to study the specific adsorption states of gases. The pore sizes are set as 15 Å and 60 Å, representing mesopores and macrospores respectively.32,33 The adsorption occurrence of gases in the pore of 15 Å is different from the adsorption state of gases in the pore of 60 Å. Fig. 6a and b show the adsorption occurrences of carbon dioxide and methane in different pores. When the pore becomes a macrospore, no more peaks appear in the center of the pore because the density of methane in the central area does not change for large pores. Fig. 6c and d show the adsorption occurrences of nitrogen and methane in different pores. For large pore sizes, the density profiles of methane and nitrogen are very stable in the internal pore space.
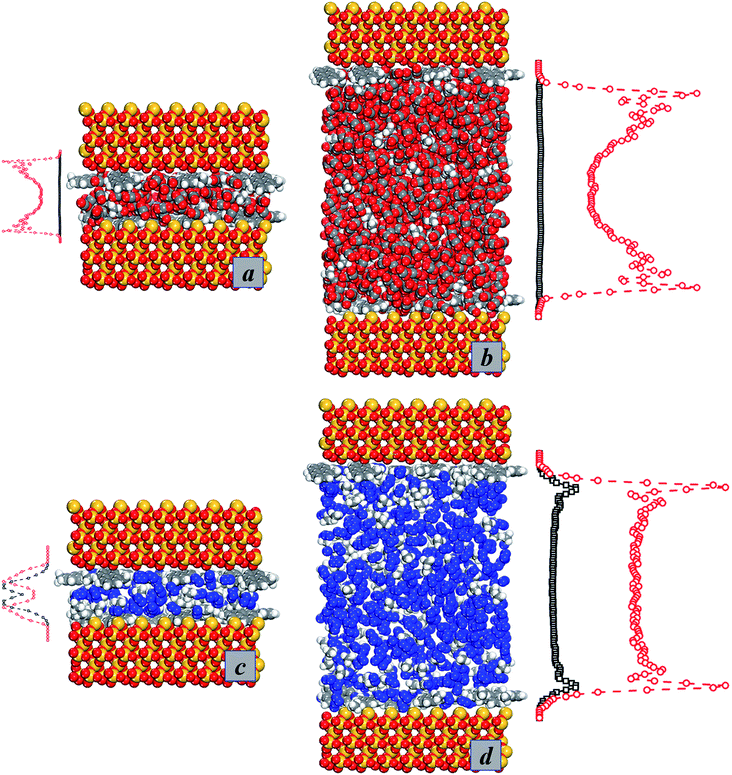 | ||
| Fig. 6 Adsorption occurrences of gases in different pores. (a) 15 Å – CO2; (b) 60 Å – CO2; (c) 15 Å – N2; (d) 60 Å – N2. | ||
It can be seen that the most probable interaction energy of methane in the slit of shale is lower than that of nitrogen and methane molecules adsorb on the slit wall of shale at a lower adsorption site, while nitrogen molecules adsorb on the slit model without the stability like methane molecules (Fig. 7a). The adsorption capacity of methane in the slit is greater than that in nitrogen. In addition, the interaction between methane and nitrogen changes the interaction energy curves between them and the shale slit model, and the distribution of interaction energy curves of methane and nitrogen gradually move to the right with the pore enlargement. The adsorption potential of methane molecule moves to the higher adsorption energy gradually with the increase of nitrogen, resulting in the adsorption capacity of methane in shale decreased. This indicates that the adsorption of nitrogen molecules in the pores causes the change of adsorption sites of methane molecules and reduces the adsorption space of methane molecules.
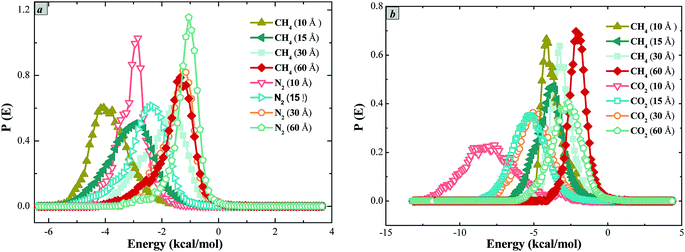 | ||
| Fig. 7 Distribution of different gases interaction energy under different pore widths. (a) Methane and nitrogen; (b) methane and carbon dioxide. | ||
From the distributions of the interaction energy of carbon dioxide and methane (Fig. 7b), it can be seen that the most probable interaction energy of methane is around −4.5 to −2.5 kJ mol−1, and the most probable interaction energy of carbon dioxide is around −8.3 to −5.1 kJ mol−1. This means that the adsorption of methane molecules on the wall of slit is at the adsorption site of higher energy, while carbon dioxide is at the lower energy adsorption site. This indicates that the adsorption of methane in the slit is not stable as carbon dioxide, and the adsorption capacity of methane is weaker than that of carbon dioxide. In addition, the curve of methane interaction energy shifts to the right with the increase of pore size. The adsorption potential of methane molecules moves to the higher energy gradually with the increase of carbon dioxide, resulting in the decrease of methane adsorption capacity in shale, which indicates that the adsorption of carbon dioxide protector molecules occurs in the pores, causing the change of adsorption sites of methane molecules.
3.3. Methane displacement by carbon dioxide and nitrogen in different pores
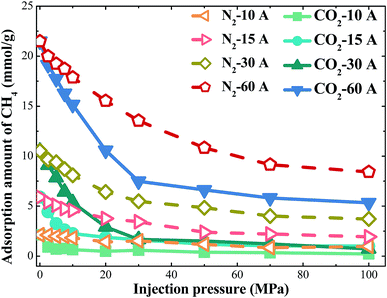
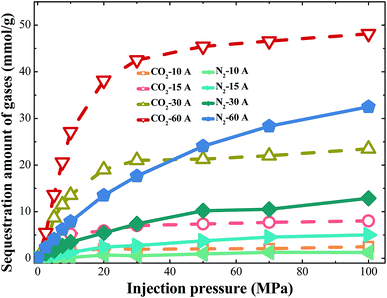
Injection gases can maintain overall coalbed pressure and perhaps reduce the overall volume of water lifted to the surface. Meanwhile, injection gases can also sweep desorbed CH4 through the reservoir. Because of these advantages, injection gases have been regarded as a highly efficient way to exploit the shale gases. CO2 and N2 are usually considered ideal gases to displace methane.The loading amount of CH4 at different injection pressure of gases were studied in different pores from 10–60 Å. The results can be seen from Fig. 8. Obviously, the downward trends in loading amount of CH4 are significant at different pores. When CO2 injection pressure increases, the loading amount of CH4 in the shale model decreases. For injection pressure of 0–30 MPa, the loading amount of CH4 decreases quickly. When CO2 is injected, the molecules can adsorb on the walls to replace the adsorbed methane directly. At high CO2 injection pressure, there are no more adsorption sites for CO2 molecules to adsorb. The curve becomes smooth at high CO2 injection pressure, and the loading amount of CH4 becomes stable. With the increase of pore width, the loading amount of CH4 at different CO2 injection pressure increases obviously. Compared with the nitrogen flooding, the carbon dioxide flooding reduces the amount of methane adsorption rapidly, which reflects the high efficiency of the carbon dioxide flooding method. Similarly, the sequestration amount of carbon dioxide rises significantly. For a pore with the same width, the burial stock of carbon dioxide is much larger than that of nitrogen, as shown in Fig. 9. Furthermore, the percentages of displacement methane by gases were studied at CO2 injection pressure of 100 MPa. For the different displacement methods, the efficiency of methane displacement is higher under two different pore sizes of 15 Å and 30 Å. When the aperture is lower than 15 Å or higher than 30 Å, the displacement efficiency of both two methods decreases (Fig. 10). However, the displacement efficiency in previous studies34 saw a downward trend as the increase of the pore width, which means the maximum displacement efficiency would be achieved in pores less than 10 Å. I argue that when the pore size is very small, its narrow space is not conducive to gas injection and adsorption, so displacement gas cannot be very well to fill the whole pore space and displacement efficiency is not definitely the best. With the increase of pore width (30 Å), there is a sufficient space to facilitate the adsorption of displacement gases, this condition may would achieve the best displacement efficiency. In addition, the real shale contains multiscale pores with the pore size ranging from nanometer to micrometers. When the pore size is larger than 60 Å or more, it is crucial to conduct more accurate simulation to study the displacement of methane by gases in our future work. In this way, we may need to combined multiscale simulations method (including MD, LBM and analytical model) to investigate the transport characteristic and mechanism of shale gas in displacement process.35,36
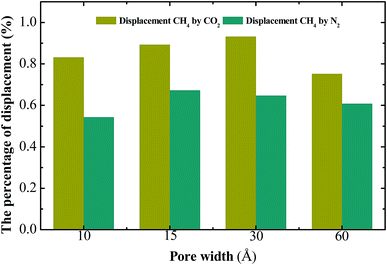 | ||
| Fig. 10 Percentage of displacement of methane by injection gases in different pores (Tm = 313 K, Pm = 15 MPa, PI = 90 MPa). | ||
4. Conclusions
Based on actual shale conditions, a new shale model using organic–inorganic composites was developed. The GCMC simulation was used to study the displacement of shale gas by carbon dioxide and nitrogen. The occurrence behaviors of gases in different pores were also investigated using the MD method. The following conclusions were drawn:(1) With the increase of pore width, the adsorption occurrence transfers from single adsorption layer to four adsorption layers. For wide pores, the density of the central bulk phase approaches to the same value of 0.2 g cm−3. The order of interactions between gases and shale molecules is carbon dioxide > methane > nitrogen, which means the effect of carbon dioxide flooding is better.
(2) At different pore sizes, the small apertures of 15 Å and 30 Å correspond to higher displacement efficiency, but the larger apertures can accommodate more carbon dioxide molecules. The optimum operating conditions for CO2 and N2 displacing shale gas are all at the pore width of 30 Å.
(3) Displacement of methane by carbon dioxide and nitrogen was investigated. The results indicate that when the injection pressure is greater than 30 MPa, both displacement methods can perform well and result in the displacement efficiency above 50%.
It is expected the results and findings of this paper are important for displacement exploitation of shale gas by injection gases and sequestration of carbon dioxide.
Conflicts of interest
There are no conflicts to declare.Acknowledgements
The work was supported in part by the National Natural Science Foundation of China (51676208), the Fundamental Research Funds for the Central Universities (18CX07012A, 18CX05029A, 19CX05002A) and the grants BAS/1/1351-01, URF/1/2993-01, and REP/1/2879-01 from King Abdullah University of Science and Technology (KAUST).References
- V. Arora and Y. Cai, US natural gas exports and their global impacts, Appl. Energy, 2014, 120, 95–103 CrossRef.
- H. Yu, J. C. Fan and J. Chen, et al., Pressure-dependent transport characteristic of methane gas in slit nanopores, Int. J. Heat Mass Transfer, 2018, 123, 657–667 CrossRef CAS.
- Y. X. Li, H. K. Nie and P. Y. Long, Development characteristics of organic-rich shale and strategic selection of shale gas exploration area in China, Nat. Gas Ind., 2009, 29(12), 115–118 Search PubMed.
- K. A. Bowker, Barnett shale gas production, Fort Worth Basin: Issues and discussion, AAPG Bull., 2007, 91(4), 523–533 CrossRef.
- D. R. Caulton, P. B. Shepson and R. L. Santoro, et al., Toward a better understanding and quantification of methane emissions from shale gas development, Proc. Natl. Acad. Sci., 2014, 111(17), 6237–6242 CrossRef CAS PubMed.
- R. W. Howarth, R. Santoro and A. Ingraffea, Methane and the greenhouse-gas footprint of natural gas from shale formations, Clim. Change, 2011, 106(4), 679 CrossRef CAS.
- L. Ji, T. Zhang and K. L. Milliken, et al., Experimental investigation of main controls to methane adsorption in clay-rich rocks, Appl. Geochem., 2012, 27(12), 2533–2545 CrossRef CAS.
- H. E. Johnson and S. Granick, Exchange kinetics between the adsorbed state and free solution: poly (methyl methacrylate) in carbon tetrachloride, Macromolecules, 1990, 23(13), 3367–3374 CrossRef CAS.
- J. B. Curtis, Fractured shale-gas systems, AAPG Bull., 2002, 86(11), 1921–1938 CAS.
- C. Clark, A. Burnham, C. Harto, et al., Hydraulic fracturing and shale gas production: technology, impacts, and policy, Argonne National Laboratory, 2012, pp. 1–16 Search PubMed.
- C. R. Clarkson, B. Haghshenas and A. Ghanizadeh, et al., Nanopores to megafractures: current challenges and methods for shale gas reservoir and hydraulic fracture characterization, J. Nat. Gas Sci. Eng., 2016, 31, 612–657 CrossRef.
- H. Chen and K. E. Carter, Water usage for natural gas production through hydraulic fracturing in the United States from 2008 to 2014, J. Environ. Manage., 2016, 170, 152–159 CrossRef PubMed.
- R. E. Jackson, A. W. Gorody and B. Mayer, et al., Groundwater protection and unconventional gas extraction: the critical need for field-based hydrogeological research, Groundwater, 2013, 51(4), 488–510 CrossRef CAS PubMed.
- J. A. Connor, L. J. Molofsky, S. D. Richardson, et al., Environmental Issues and Answers Related to Shale Gas Development//SPE Latin American and Caribbean Health, Safety, Environment and Sustainability Conference, Society of Petroleum Engineers, 2015 Search PubMed.
- C. R. Clarkson, N. Solano and R. M. Bustin, et al., Pore structure characterization of North American shale gas reservoirs using USANS/SANS, gas adsorption, and mercury intrusion, Fuel, 2013, 103, 606–616 CrossRef CAS.
- H. A. Wu, J. Chen and H. Liu, Molecular dynamics simulations about adsorption and displacement of methane in carbon nanochannels, J. Phys. Chem. C, 2015, 119(24), 13652–13657 CrossRef CAS.
- H. Yu, J. Yuan and W. Guo, et al.A preliminary laboratory experiment on coalbed methane displacement with carbon dioxide injection, Int. J. Coal Geol., 2008, 73(2), 156–166 CrossRef CAS.
- M. Pathak, G. Pawar, H. Huang, et al., Carbon dioxide sequestration and hydrocarbons recovery in the gas rich shales: an insight from the molecular dynamics simulations//Carbon Management Technology Conference 2015: Sustainable and Economical CCUS Options, CMTC 2015, AIChE, 2015 Search PubMed.
- L. Huang, Z. Ning, Q. Wang, R. Qi and Y. Zeng, Molecular simulation of adsorption behaviors of methane, carbon dioxide and their mixtures on kerogen: effect of kerogen maturity and moisture content, Fuel, 2018, 211, 159–172 CrossRef CAS.
- Q. Yuan, X. Zhu and K. Lin, et al., Molecular dynamics simulations of the enhanced recovery of confined methane with carbon dioxide, Phys. Chem. Chem. Phys., 2015, 17(47), 31887 RSC.
- H. Y. Jiao, M. Z. Dong and Z. W. Liu, et al., Molecular dynamics simulation of methane adsorption with presence of water on different wettability quartz surface, J. China Univ. Pet., Ed. Nat. Sci., 2014, 38(5), 178–183 Search PubMed.
- R. Y. Sun, Y. F. Zhang and K. K. Fan, et al., Molecular simulations of adsorption characteristics of clay minerals in shale, CIESC J., 2015, 66(6), 2118–2122 CAS.
- S. Wang, F. Javadpour and Q. Feng, Molecular dynamics simulations of oil transport through inorganic nanopores in shale, Fuel, 2016, 171, 74–86 CrossRef CAS.
- S. Wang, Q. Feng, F. Javadpour, T. Xia and Z. Li, Oil adsorption in shale nanopores and its effect on recoverable oil-in-place, Int. J. Coal Geol., 2015, 147, 9–24 CrossRef.
- X. Li, Q. Xue and T. Wu, et al., Oil detachment from silica surface modified by carboxy groups in aqueous cetyltriethylammonium bromide solution, Appl. Surf. Sci., 2015, 353, 1103–1111 CrossRef CAS.
- J. Rouquerol, D. Avnir and C. W. Fairbridge, et al., Recommendations for the characterization of porous solids (Technical report), Pure Appl. Chem., 1994, 66(8), 1739–1758 CAS.
- H. Sun, COMPASS: an ab initio force-field optimized for condensed-phase applications overview with details on alkane and benzene compounds, J. Phys. Chem. B, 1998, 102(38), 7338–7364 CrossRef CAS.
- Y. G. Lee, H. R. Moon, Y. E. Cheon and M. P. Suh, A comparison of the H2 sorption capacities of isostructural metal–organic frameworks with and without accessible metal sites:[{Zn2 (abtc)(dmf)2}3] and [{Cu2 (abtc)(dmf)2}3] versus [{Cu2 (abtc)}3], Angew. Chem., Int. Ed., 2008, 47(40), 7741–7745 CrossRef CAS PubMed.
- A. Y. Musa, A. A. H. Kadhum, A. B. Mohamad, A. A. B. Rahoma and H. Mesmari, Electrochemical and quantum chemical calculations on 4, 4-dimethyloxazolidine-2-thione as inhibitor for mild steel corrosion in hydrochloric acid, J. Mol. Struct., 2010, 969(1–3), 233–237 CrossRef CAS.
- J. Wang and P. Somasundaran, Adsorption and conformation of carboxymethyl cellulose at solid–liquid interfaces using spectroscopic, AFM and allied techniques, J. Colloid Interface Sci., 2005, 291(1), 75–83 CrossRef CAS PubMed.
- J. Chen, F. C. Wang and H. Liu, et al., Molecular mechanism of adsorption/desorption hysteresis: dynamics of shale gas in nanopores, Sci. China: Phys., Mech. Astron., 2017, 60(1), 014611 Search PubMed.
- F. Zeng, W. B. Huang and M. Liu, et al., A study on quantitative characterization of adsorption capacity of shale., Adv. Mater. Res., 2014, 868, 20–25 CAS.
- K. Jessen, G. Q. Tang and A. R. Kovscek, Laboratory and simulation investigation of enhanced coalbed methane recovery by gas injection, Transp. Porous Media, 2008, 73(2), 141–159 CrossRef CAS.
- H. Zhang and D. Cao, Molecular simulation of displacement of shale gas by carbon dioxide at different geological depths, Chem. Eng. Sci., 2016, 156, 121–127 CrossRef CAS.
- H. Yu, J. Chen and Y. B. Zhu, et al., Multiscale transport mechanism of shale gas in micro/nano-pores, Int. J. Heat Mass Transfer, 2017, 111, 1172–1180 CrossRef.
- H. Yu, Y. B. Zhu and X. Jin, et al., Multiscale simulations of shale gas transport in micro/nano-porous shale matrix considering pore structure influence, J. Nat. Gas Sci. Eng., 2019, 64, 28–40 CrossRef.
| This journal is © The Royal Society of Chemistry 2019 |

