 Open Access Article
Distinct plasmon resonance enhanced microwave absorption of strawberry-like Co/C/Fe/C core–shell hierarchical flowers via engineering the diameter and interparticle spacing of Fe/C nanoparticles†
Zidong He,
Minmin Liu,
Lin Liu,
Guoxiu Tong *,
Wenhua Wu and
Xiaojuan Wang*
College of Chemistry and Life Sciences, Key Laboratory of the Ministry of Education for Advanced Catalysis Materials, Zhejiang Normal University, Jinhua 321004, People's Republic of China. E-mail: tonggx@zjnu.cn; wangxj@zjnu.cn; Fax: +86-579-82282269; Tel: +86-579-82282269
First published on 22nd July 2019
Abstract
Strawberry-like Co/C/Fe/C core–shell hierarchical flowers (CSHFs) consisting of separated Fe/C nanoparticles (NPs) anchoring on a Co HF surface were prepared by decomposing Fe(CO)5 in the presence of Co HFs. Changing the decomposition temperature (Td) and Fe(CO)5 volume (δ) could also facilely modulate the phase structure, surface morphology and composition of the products. The low Td and small δ helped form Co/C/Fe/C CSHFs with a strawberry-like plasmon surface. The diameter and interparticle spacing-dependent electromagnetic properties were investigated at 2–18 GHz. The interparticle-spacing-to-diameter ratio determines the plasmon resonance and coupling. The permittivity and permeability enhanced by strong plasmon resonance were exhibited by Co/C/Fe/C CSHFs formed at δ = 3–4 mL with the interparticle-spacing-to-diameter ratio of 1.36–0.76. The collective oscillation of the conduction band electrons and near field on the Co/C and Fe/C surfaces generated a surface plasmon resonance and coupling, which were responsible for significantly enhanced permittivity and permeability with negative values. In view of the synergistic effect of the enhanced permittivity and permeability, dual dielectric relaxations, dual magnetic resonances, high attenuation and good impedance matching, Co/C/Fe/C CSHFs with particle size of 110 ± 20–380 ± 100 nm and interparticle spacing of 150 ± 50 nm were excellent absorbers that feature strong absorption, broad bandwidth and light weight. An optimal reflection loss (RL) of −45.06 was found at 17.92 GHz for an absorber thickness of 1.6 mm, and the frequency range (RL ≤ −20 dB, 99% absorption) was over 2–18 GHz. Our findings demonstrated that optimally designed plasmonic heterostructures must be fabricated to improve microwave absorption performances for future applications.
1. Introduction
The widespread use of electrical and electronic devices has motivated researchers to exploit new microwave absorption materials (MAMs) to address the ever-increasing electromagnetic (EM) radiation pollution. Given their advantages, such as abundant reserves, low cost, high saturation magnetization (Ms) and high permeability, soft magnetic metals (e.g., Fe, Co, Ni and their alloys) are candidates for microwave devices.1–5 However, their high density hinders their applications as lightweight and broadband absorbers. To reduce the weight of MAMs, the following strategies have been applied: (1) designing and preparing porous/hollow materials for microwave absorption;6–10 (2) selecting low-density materials (e.g., graphene,11,12 expanded graphite (EG),13–15 CNTs16,17 and carbon-based composites18) as absorbers; (3) decreasing the filling mass/volume fraction of absorbers in a matrix by enhancing permittivity (εr = ε′ − jε′′) and permeability (μr = μ′ − jμ′′).19 According to the equation ,18,19 high levels of permeability and permittivity are critical in achieving thin and light MAMs. As such, considerable efforts have been directed toward improving permittivity and permeability. Permittivity can be significantly improved by constructing hybrids or composites for multi-interfaces, which forms an electric network,20 enhances shape anisotropy14,15 or generates plasmon resonance.19 Snoek's law,
  ,14,15 where γ is the gyromagnetic ratio, indicates that the static permeability (μs) and resonance frequency (fr) of magnetic absorbents cannot increase simultaneously due to low Ms. Several measures, including enhancing Ms,18 restricting eddy current effects,21 adjusting the anisotropic field14,22 or introducing an additional geometric field,23 can be adopted to enhance permeability. However, extensive adjustments of permeability remain challenging on account of Snoek's limit.
In recent years, plasmonic metal nanostructures have become a hot topic in various fields due to their unique optical, photothermal, photoelectromagnetic and photoacoustic properties, which are ideal for potential applications in electronic and photonic devices.24,25 When conduction band electrons inside metals collectively oscillate, the plasmon resonance generates strong optical absorption, scattering and EM plasmon field, which strongly depends on the size, shape, distribution, electronic charge and dielectric environment of the metal particles. Although excellent progress has been achieved in the study of metals (e.g., Au, Ag, Cu and Al) and their plasmon resonance optical responses in the ultraviolet, visible and near-infrared regions,26,27 few studies have explored the plasmon-resonance-enhanced microwave EM and absorbing performances in microwave frequency ranges of magnetic metals (such as Co, Ni and Fe).
Our recent studies have found that Fe3O4 nanorings (NRs)15 and EG/Fe3O4 NR composites16 exhibit distinctly enhanced permittivity and permeability at 2–18 GHz due to plasmon resonance. The enhancement effect strongly depends on NR size, distribution and content. These findings have motivated our subsequent studies on magnetic metals (e.g., Co, Ni and Fe), which are expected to be designed as new plasmon-resonance microwave absorbers to overcome the limitation of Snoek's law for the following reasons. (1) Their high conductivity favors the formation of free charge density waves on the metal surface. These waves can interact with the incident EM wave to generate surface plasmon resonance (SPR). (2) Strong electrical and magnetic coupling can be generated between pairs of Fe/C NPs and between Fe/C NPs and Co HFs, leading to an enhanced EM field. (3) The combination of Co and C is ideal for the enhanced impedance matching of the absorber and for a broader bandwidth. (4) According to the equation μ′′ = Ms/3μ0HAα,19 combining Co with Fe can realize a high Ms and can enhance permeability.17 To date, Co-based composites, such as CNTs/Co@C,3 Co@C,28 Co/CoO nanofibers,29 FeCo/graphene,30 FeCo/C composites,2 FeCo/C nanofibers,31 FeCo microspheres,32 Co3Fe7/C microspheres,33 FeCo nanoparticle/nano porous carbon,34 FeCo nanochains35 and Co7Fe3 and Co7Fe3@SiO2 nanospheres,1 have been synthesized via electrospinning, facial wet-chemical route, solvothermal method, arc-discharge technique and liquid-phase reduction. However, few studies have investigated the synthesis and EM performance of Co/C/Fe/C core–shell hierarchical flowers (CSHFs) with a strawberry-like surface. Moreover, the potential of Co/C/Fe/C CSHFs with strawberry-like surface as surface plasmons (SPs) to enhance permeability and permittivity at 2–18 GHz remains unclear.
Inspired by our previous study, we synthesized a composite of Fe/C nanoparticles (NPs) with tunable sizes and gaps anchored on the Co HF surface through a facile hydrothermal–chemical vapor decomposition (CVD) route. Benefitting from the synergy of plasmon resonance and coupling, our original findings demonstrated that the ε′, ε′′, μ′ and μ′′ values of the strawberry-like Co/C/Fe/C CSHFs were higher by 0.2–5.2, 24![[thin space (1/6-em)]](https://www.rsc.org/images/entities/char_2009.gif) 489.9–1100.0, 0.63–1.2 and 0.26–31.35 times, respectively, than those of pure Co HFs. The effects of the diameter and interparticle spacing of Fe/C NPs on permittivity and permeability were examined. In addition, the enhancement mechanism of microwave absorption was illustrated.
489.9–1100.0, 0.63–1.2 and 0.26–31.35 times, respectively, than those of pure Co HFs. The effects of the diameter and interparticle spacing of Fe/C NPs on permittivity and permeability were examined. In addition, the enhancement mechanism of microwave absorption was illustrated.
2. Experimental section
2.1 Synthesis
All chemical reagents used were of analytical grade and were used as received without any further purification.The synthesis of Co/C/Fe/C CSHFs involved two steps. In the first step, Co hierarchical flowers (HFs) were synthesized via a facile hydrothermal method in the presence of CoCl2·6H2O, NaOH, water and hydrazine hydrate (N2H4·H2O).36 The second step was a CVD route for Co/C/Fe/C CSHFs. Briefly, 3.0 mL of Fe(CO)5 and 0.5 g of Co HFs loaded with a 1.2 cm × 9.0 cm × 1.0 cm ceramic vessel, respectively, were placed into a horizontal pipe furnace. Under Ar, the furnace temperature was elevated from room temperature to 250 °C in 30 min and then was maintained for 2 h. Finally, the system was cooled slowly to room temperature under Ar and a black solid product was deposited at the bottom of the vessel, indicating the formation of Co/C/Fe/C CSHFs. The morphological and structural modulations of the products were easily achieved by changing Fe(CO)5 volume (δ = 1 mL, 2 mL, 3 mL, 4 mL and 6 mL) and decomposition temperature (Td = 250, 300, 400 and 500 °C).
2.2 Characterization
The surface morphology and microstructure of the samples were examined on a Hitachi S-4800 field-emission scanning electron microscope (FE-SEM, 5 kV), JEM-2100F high resolution-transmission electron microscope (HR-TEM, 200 kV) and the corresponding selected-area electron diffraction (SAED), respectively. The element components of the samples were determined by a Horiba EX-250 energy dispersive X-ray spectrometer (EDX). The phase structure of the samples was analyzed from 10° to 90° on a D/MAX-IIIA X-ray diffraction (XRD) using Cu Kα radiation (λ = 0.15406 nm, 10° min−1). Raman spectra were recorded on a Renishaw RM10000 Raman spectrometer to analyze the crystallization of carbon. Surface analysis of samples was performed using an ESCALAB 250Xi X-ray photoelectron spectrometer.2.3 Performance measurement
A Model 7404 vibrating sample magnetometer (VSM, LakeShore, USA) was used to measure the static magnetic performances of the samples at room temperature.For the fabrication of cylindrical toroidal samples used for EM parameter test, Co/C/Fe/C CSHFs were uniformly dispersed in paraffin (mass fraction of 25–40%) and then the mixtures were pressed into the cylindrical toroidal samples with inner diameter of 3.04 mm, outer diameter of 7.0 mm and a thickness of ca. 3.5 mm. From the coaxial line method, an Agilent N5230A vector network analyzer was applied to test the relative complex permeability (εr = ε′ − jε′′) and permittivity (μr = μ′ − jμ′′) of the sample-wax composites at 2–18 GHz.
3. Results and discussion
3.1 Synthesis and characterization of the typical samples
Co/C/Fe/C CSHFs were synthesized by CVD of Fe(CO)5 in the presence of Co HFs at 250–500 °C for 2 h under Ar. Scheme 1 presents the synthesis procedure of the Co/C/Fe/C CSHFs, which involves two major steps. The first step is the hydrothermal synthesis of Co HFs at 140 °C for 2 h. The detailed formation mechanism of this process has been described in our previous work.36 The SEM images show that the Co HFs have a smooth surface and consist of several leaf-like flakes that are 100 nm thick (Fig. S1†). These flakes expand from the same centre and assemble into a flower-like architecture about 6 μm in diameter (Fig. S1†). The second step is the CVD for forming Co/C/Fe/C CSHFs, and the involved chemical reactions are as follows:
 | (1) |
 | (2) |
First, Ar carrier gas with gaseous Fe(CO)5 is flowed into the reaction zone, and gaseous Fe(CO)5 is adsorbed on the CO HF surface. Then, the pyrolysis of Fe(CO)5 produces numerous Fe nanocrystals and CO on the Co HF surface (reaction (1)). Finally, under the catalytic roles of Fe and Co (reaction (2)), CO further decomposes and produces C films on the Fe and Co surfaces as CO2 is produced, leading to the formation of Co/C/Fe/C CSHFs.
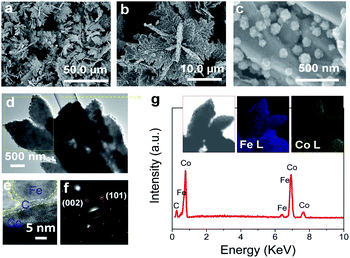
The typical products generated at Td = 250 °C via CVD still keep the hierarchically flower-like configuration (Fig. 1a and b) but rough surface. Surface SEM observation shows that numerous separated nanoparticles (NPs) with the size of 110 ± 20 nm are uniformly anchored on Co HF surface; these NPs are parted from one another; the interparticle spacing is 150 ± 90 nm. This structure looks like the surface of strawberry and thus is defined as strawberry-like heterostructure here (Fig. 1c). TEM analysis in Fig. 1d further reveals that numerous NPs are evenly distributed over Co HF surface with a narrow distribution in average size of 110 ± 20 nm. In the high-magnified TEM image of Fig. 1e and 3–5 nm C shell coats on the surfaces of Fe NP and Co HF uniformly. The clear and strong spots in the SAED pattern (Fig. 1f) confirm the single crystal nature of Co and the weak diffraction rings as narrow marked come from the polycrystalline Fe NPs. The above results indicate the formation of Co/C/Fe/C CSHFs. EDX analysis (Fig. 1g) determines the presence of C, Co and Fe elements; the atomic ratio of Co and Fe elements is about 51.69; and Fe and Co elements are distributed over the hierarchical flower (insets in Fig. 1g). These data suggest that the resultant products after CVD are mainly composed of Co/C/Fe/C CSHFs.
3.2 Modulation over the diameter and interparticle spacing of Fe/C NPs
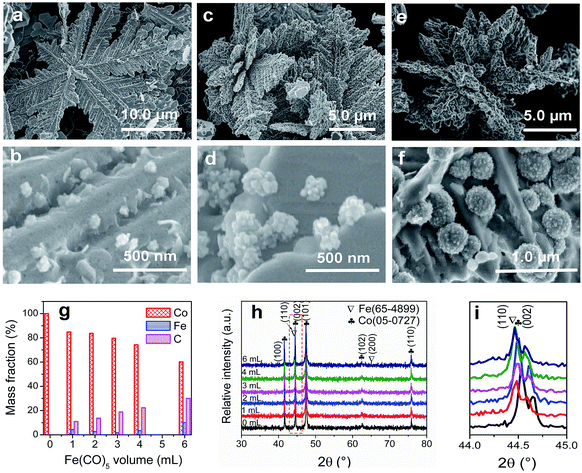
To adjust the diameter and interparticle spacing of Fe/C NPs in Co/C/Fe/C CSHFs, we systematically investigated δ and Td. Low-power SEM images in Fig. S2† reveal that the samples obtained at various δ still keep the hierarchically flower-like shape (Fig. S2†); in the high-power SEM images (Fig. 2a–f), a lot of Fe/C NPs are homogenously embedded on the shells of Co/C/Fe/C CSHFs to form a strawberry-like surface. The diameter and interparticle spacing of Fe/C NPs in Co/C/Fe/C CSHFs can be adjusted via varying δ from 2 mL to 6 mL (Fig. 2a–f). Fe/C NPs are aggregates of numerous small nanocrystallites. At δ = 2 (Fig. 2a and b), 3 (Fig. 1c), 4 (Fig. 2c and d) and 6 mL (Fig. 2e and f), the Fe/C NPs display average diameters of 90 ± 10, 110 ± 20, 195 ± 40 and 380 ± 100 nm, respectively and the interparticle spacing between Fe/C NPs is approximately 240 ± 130, 150 ± 90, 148 ± 30, and 145 ± 50 nm, respectively. The reason for such changes is that the high concentration of Fe(CO)5 formed at large δ induces the high nucleation and growth rates of Fe, giving rise to an increased diameter. In addition to the diameter and interparticle spacing of Fe/C NPs, controlling δ can adjust the components of the Co/C/Fe/C CSHFs. EDX analysis reveals that when Td is kept constant (250 °C) and δ is varied from 0 mL to 6 mL, the Co content decreases from 100% to 60.07%, the C content increases from 0% to 30% and the Fe content increases from 0% to 9.93% (Fig. 2g and S3†).The XRD was further used to confirm the phase structure of the samples, as shown in Fig. 2h and i. The samples obtained at Td = 250 °C with various δ exhibit the similar diffraction peaks. Hereinto, five peaks denoted by ♣ at 41.68°, 44.76°, 47.57°, 62.73° and 75.94° can well match with the (100), (002), (101), (102) and (110) crystal planes of the hexagonal close-packed (HCP) Co metal (space group P63/mmc1(194); a = 2.503 Å, c = 4.060 Å; JCPDS no. 05-0727). The two peaks denoted by ∇ at 44.76° and 65.0° are related to the (110) and (200) crystal planes of the body-centred cubic (BCC) Fe [Im![[3 with combining macron]](https://www.rsc.org/images/entities/char_0033_0304.gif) m (229), JCPDS 65-4899]. As shown in Fig. 2i, the peak corresponding to the (110) facet of cubic Fe gradually increases with δ varying from 4 mL to 6 mL due to the increased Fe content. C leaves no trace in all samples. In general, the utilized X-ray diffractometer can only detect phases that are ≥1.5%. According to EDX data (Fig. 2g), these phenomena are due to the amorphous C with low crystallinity rather than low content. The preceding EDX and subsequent XPS analyses confirm the existence of Fe0. However, no significant diffraction peaks associated with Fe0 are detected at δ = 1–3 mL due to the low Fe content, the amorphous structure and the very close peak position of the Co peak at 44.76° to the Fe peak at 44.66° (Fig. 2i). As such, the Co peaks at 44.76° broaden and shift to a low degree (Fig. 2i). The EDX, XRD and subsequent XPS (Fig. 3) data suggest that all samples formed at 250 °C with various δ are composed of HCP Co, BCC Fe and amorphous C.
m (229), JCPDS 65-4899]. As shown in Fig. 2i, the peak corresponding to the (110) facet of cubic Fe gradually increases with δ varying from 4 mL to 6 mL due to the increased Fe content. C leaves no trace in all samples. In general, the utilized X-ray diffractometer can only detect phases that are ≥1.5%. According to EDX data (Fig. 2g), these phenomena are due to the amorphous C with low crystallinity rather than low content. The preceding EDX and subsequent XPS analyses confirm the existence of Fe0. However, no significant diffraction peaks associated with Fe0 are detected at δ = 1–3 mL due to the low Fe content, the amorphous structure and the very close peak position of the Co peak at 44.76° to the Fe peak at 44.66° (Fig. 2i). As such, the Co peaks at 44.76° broaden and shift to a low degree (Fig. 2i). The EDX, XRD and subsequent XPS (Fig. 3) data suggest that all samples formed at 250 °C with various δ are composed of HCP Co, BCC Fe and amorphous C.
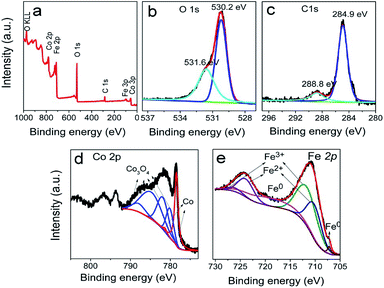 | ||
| Fig. 3 XPS spectra of the typical samples obtained at 250 °C: (a) survey spectra, deconvolution of (b) O 1s, (c) C 1s, (d) Co 2p, and (e) Fe 2p. | ||
XPS provides information on the surface state and elemental composition of the most external surface (below 10 nm thickness) of the typical samples, as shown in Fig. 3. The binding energies of all elements are calibrated with the binding energy of C 1s (284.8 eV). In the full spectra (Fig. 3a), four elements (Fe, Co, O, and C) are detected in all samples. The peaks centred at 59.4, 102.0, 713.0 and 781.3 eV corresponded to Co 3p, Fe 3p, Fe 2p and Co 2p.37 The other peaks at 284.0 and 531.5 eV are attributed to C 1s and O 1s, respectively. With regard to O, the measured O 1s spectra exhibit two fitting curves (Fig. 3b). The peak at 529 eV can be assigned to lattice oxygen ions O2−, which confirms the presence of Co- and Fe-based oxides on the surface of the samples with 4–10 nm thickness. The other peak at 531 eV originated from the contribution of surface oxygen, including the absorbed oxygen species as hydroxyl, carbonate groups, etc.38 In Fig. 3c, the C 1s signal in all samples shows an asymmetric tailing partially due to the intrinsic asymmetry of the graphite peak and oxygen surface complexes.39 The measured peaks are fitted with two curves, which correspond to the following functional groups: C–C (284.8 eV) and C![[double bond, length as m-dash]](https://www.rsc.org/images/entities/char_e001.gif) O carboxyl group (288.8 eV). The 80–90% peak area of the C 1s peak originate from the contribution of C–C (284.8 eV), which corresponds to graphite. The C layer in the products formed at 250 °C mainly contain the functional groups of C–C (284.8 eV) and C
O carboxyl group (288.8 eV). The 80–90% peak area of the C 1s peak originate from the contribution of C–C (284.8 eV), which corresponds to graphite. The C layer in the products formed at 250 °C mainly contain the functional groups of C–C (284.8 eV) and C![[double bond, length as m-dash]](https://www.rsc.org/images/entities/char_e001.gif) O carboxyl group (289 eV). In Fig. 3d, the Co 2p spectra are resolved into 6–7 peaks. The peaks at 781.0 and 778.5 eV are designated to Co0,40 and those at 780.1, 782.3, 785.3 and 788.2 eV are ascribed to Co3O4.40 As shown in Fig. 3e, the Fe 2p spectra can be fitted into six curves. Among them, the two peaks at 719.0 and 707.1 eV are attributed to Fe0,37,41 the two peaks at 711.6–713.0 and 726.0 eV are ascribed to Fe3+,42 and the two peaks at 710.5 and 724.0 eV are characteristic peaks of Fe2+.43 Both the Fe2+ and Fe3+ species confirm the existence of oxides on the surface.
O carboxyl group (289 eV). In Fig. 3d, the Co 2p spectra are resolved into 6–7 peaks. The peaks at 781.0 and 778.5 eV are designated to Co0,40 and those at 780.1, 782.3, 785.3 and 788.2 eV are ascribed to Co3O4.40 As shown in Fig. 3e, the Fe 2p spectra can be fitted into six curves. Among them, the two peaks at 719.0 and 707.1 eV are attributed to Fe0,37,41 the two peaks at 711.6–713.0 and 726.0 eV are ascribed to Fe3+,42 and the two peaks at 710.5 and 724.0 eV are characteristic peaks of Fe2+.43 Both the Fe2+ and Fe3+ species confirm the existence of oxides on the surface.
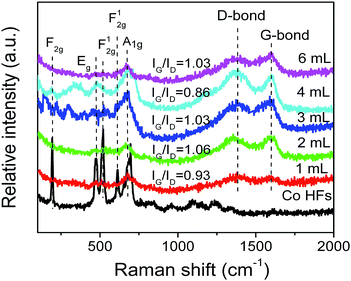
Raman spectroscopy is a noninvasive technique, which is used to characterize the surface structural and electronic properties of Co HFs and Co/C/Fe/C CSHFs. As shown in Fig. 4, several strong characteristic scattering peaks are found for Co HFs at around 200–750 cm−1. These peaks correspond to the five Raman-active modes (F2g, Eg, F12g, and A1g) of Co3O4,44,45 indicating the present of Co3O4 on Co HF surface. Meanwhile, the strong peaks confirm that the localized surface plasmon (LSPR) generates in the interface of Co and Co3O4 at around 200–750 cm−1. In this nonradiative process, plasmon resonance energy from the metal nanostructures contained in the localized plasmonic oscillations is transferred to the semiconductor, which enables scattering and absorption of light.46 These scattering peaks are still observed in Co/C/Fe/C CSHFs with low intensity, indicating very small amounts of Co3O4 layer on Co HF surface. Based on the forementioned XPS data, the peak shift and the appearance of new peaks may be associated with some iron oxides (Fig. 3d). The Raman spectra of C shell in Co/C/Fe/C CSHFs show two peaks, the stretching G mode (1598 cm−1) and the D mode (1338 cm−1), which come from first-order Raman scattering and are usually assigned to zone center phonons of E2g symmetry and K-point phonons of A1g symmetry, respectively.17,41 The D band reflects the structural defects and disorders within carbon, whereas the G band results from the planar vibrations of the highly oriented sp2 hexagonal graphite carbon. Therefore, the intensity of D band and G band is determined by the contents of disordered carbon and ordered graphitic carbon, respectively. The D and G peaks are significantly increased at δ = 3–4 mL. The enhanced Raman spectroscopy is generally related to the peculiar dispersion of the π electrons in graphite carbon, not only of their vibrations.47 The collective oscillations of π electrons generate the plasmon resonances and plasmon absorption.48,49 In general, the intensity ratio of G to D peaks (IG/ID) is used to express the graphitization degree of carbon. The larger IG/ID value represents the higher graphitization degree of carbon. In Fig. 4, a similar intensity of the order-induced G band (1598 cm−1) is observed relative to that of the D band (1338 cm−1) for the Co/C/Fe/C CSHFs with peak intensity ratios (IG/ID) in the range 0.86 < IG/ID < 1.06. This indicates that the C shell in Co/C/Fe/C CSHFs have the low graphitization degree, matching very well with the TEM and XRD data (Fig. 1e and 2h). Our data demonstrate that Co3O4 layer and C shell can induce the LSPR in Co/C/Fe/C CSHFs at 200–750 cm−1 and 1338–1598 cm−1, respectively.
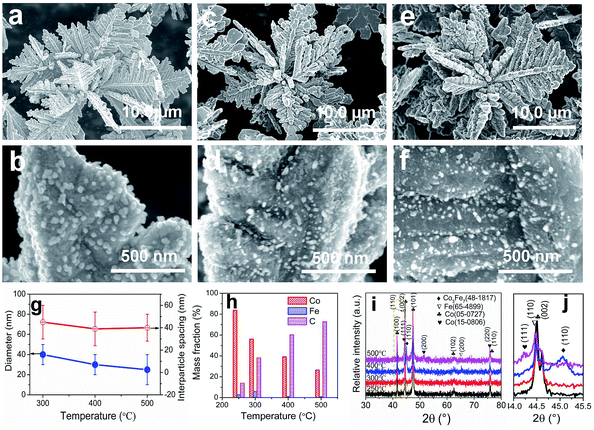
The Td affects Co/C/Fe/C CSHFs in the following three aspects: the first aspect is to adjust the diameter and interparticle spacing of Fe/C NPs in Co/C/Fe/C CSHFs. The samples consist of hierarchical flowers with a strawberry-like surface (Fig. S4†), which varies with Td (Fig. 5a–f). The average diameter of the Fe/C NPs decrease from 40 ± 10 nm at 300 °C (Fig. 5a and b), to 30 ± 10 nm at 400 °C (Fig. 5c and d) and to 25 ± 5 nm at 500 °C (Fig. 5e and f). The interparticle spacing reduces from 45 ± 15 nm at 300 °C (Fig. 5a and b) to 40 ± 15 nm at 400 °C (Fig. 5c and d) and to 38 ± 12 nm at 500 °C (Fig. 5e and f). Fig. 5g shows the diameter and interparticle spacing as functions of Td. When the Fe(CO)5 volume is maintained (2 mL) and Td is increased from 300 °C to 500 °C, the diameter and interparticle spacing of Fe/C NPs growing on the Co HF surface decrease. The reason for this change is that Td directly determines not only the decomposition speeds of Fe(CO)5 and CO but also the nucleation and growth rates of Fe and C. At a high Td (i.e., 500 °C), the high decomposition rates for Fe(CO)5 and CO accelerate the nucleation and growth of Fe and C, respectively. Under the catalytic effects of Fe nanocrystals, amorphous C rapidly forms and grows on the Fe NP surface. The C shell on the Fe NP surface hinders the enlargement of Fe NPs, causing small Fe/C NPs to grow on the Co surface. By contrast, at a low Td, the low decomposition speed of CO is unconducive to the formation of the C shell. Therefore, the diameter of Fe NPs can increase without hindering the C shells.
The second aspect is to tune the component of the products. EDX analysis (Fig. S5†) reveals the coexistence of Co, Fe and C along with a small quantity of O. O may have originated from the oxide layer on the Co and Fe surfaces. The mass fractions of Co, Fe and C as functions of Td are shown in Fig. 5h. As Td is increased from 250 °C to 500 °C, the Co mass fraction decreases from 83.68% to 26.38% and the C mass fraction increases from 13.68% to 72.73%. The Fe mass fraction presents an inverted V change tendency and reaches the maximal value of 5.93% at Td = 300 °C (Fig. 5h). The increase in the Fe mass fraction at 250–300 °C is due to the decomposition of Fe(CO)5, which is promoted by the elevated Td. The decrease at 300–500 °C is due to the inhibition of the rapidly formed C shell.
The third aspect is to influence the phase structure of the products, as revealed by X-ray diffraction (Fig. 5i). The samples obtained at Td = 250–300 °C show the similar diffraction peaks. From the stand cards (JCPDS no. 05-0727, JCPDS 65-4899), we may reasonably conclude that the products formed at 250–300 °C are composites of HCP Co, BCC Fe and amorphous C. In Fig. 5i, the peaks marked by ♥ and ♦ are assigned to the face-centred cubic (FCC) Co [Fm![[3 with combining macron]](https://www.rsc.org/images/entities/char_0033_0304.gif) m (225), JCPDS 15-0806] and cubic Co3Fe7 [Pm
m (225), JCPDS 15-0806] and cubic Co3Fe7 [Pm![[3 with combining macron]](https://www.rsc.org/images/entities/char_0033_0304.gif) m (221), JCPDS 48-1817], respectively. As shown in Fig. 5j, a diffused peak at the (110) crystal plane from FCC Co emerges at 400 °C, indicating that HCP Co begins to transform to FCC Co at 400 °C. A similar phase transformation from HCP Co to FCC Co also occurs at 700 °C (ref. 50) and 427 °C.51 As a result of alloying cubic Fe with cubic Co3Fe7 into FCC Co at 500 °C, the diffused peak at the (110) crystal plane disappears at 400 °C, and a diffused peak at the (111) crystal plane appears at 500 °C. The products obtained at 400 °C are composed of HCP Co, FCC Co and BCC Fe, whereas the products obtained at 500 °C are mixtures of HCP Co and Co3Fe7 alloys.
m (221), JCPDS 48-1817], respectively. As shown in Fig. 5j, a diffused peak at the (110) crystal plane from FCC Co emerges at 400 °C, indicating that HCP Co begins to transform to FCC Co at 400 °C. A similar phase transformation from HCP Co to FCC Co also occurs at 700 °C (ref. 50) and 427 °C.51 As a result of alloying cubic Fe with cubic Co3Fe7 into FCC Co at 500 °C, the diffused peak at the (110) crystal plane disappears at 400 °C, and a diffused peak at the (111) crystal plane appears at 500 °C. The products obtained at 400 °C are composed of HCP Co, FCC Co and BCC Fe, whereas the products obtained at 500 °C are mixtures of HCP Co and Co3Fe7 alloys.
Additional experiments were also conducted, which revealed that the products formed at high Td and large δ were Co/C/Fe/C CSHFs with a compact Fe/C NP film (Fig. 6). Our data demonstrate that changing Td and δ can facilely modulate the phase structure, surface morphology and composition of the products. A low Td and small δ aid in the formation of Co/C/Fe/C CSHFs with a strawberry-like surface.
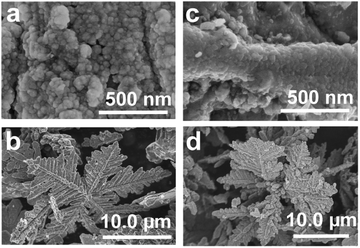 | ||
| Fig. 6 SEM images of the samples obtained under δ = 4 mL and various Td of (a and b) 300 °C and (c and d) 400 °C. | ||
3.3 Static magnetic properties
The effects of δ on the static properties were studied, as shown in Fig. 7. All samples obtained at various δ display a ferromagnetic behaviour with typical S-type magnetic hysteresis loops (Fig. 7a). Ms varies over the range of 149.09–144.85 emu g−1 (Fig. 7b) and reaches the maximal value of 149.09 emu g−1 at δ = 1 mL, which is lower than the theoretical Ms values of bulk Co (157.3 emu g−1) and bulk Fe (217.5 emu g−1).52 The Co/C/Fe/C CSHFs reported here consist of diamagnetic C, ferromagnetic Co and ferromagnetic Fe. Thus the Ms variation can be attributed to the large crystal size, high crystallinity, high Fe content and low C content of the CSHFs. Fig. 7b presents that the coercivity (Hc) of the Co/C/Fe/C CSHFs initially increases and subsequently decreases as δ increases from 1 mL to 6 mL. Hc reaches the maximum of 255.6 Oe at δ = 4 mL. This value is considerably greater than those of bulk Co (10 Oe)53 and Co HFs (213.82 Oe). The enhanced Hc at δ = 0–4 mL is generally related to the surface pinning role of antiferromagnetic phases (e.g., C or Co3O4) on the surface of ferromagnetic phases (Co or Fe).54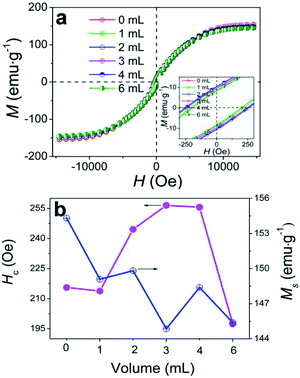 | ||
| Fig. 7 (a) Magnetic hysteresis loops of the samples obtained under various δ. (b) Hc and Ms as functions of δ. | ||
3.4 EM properties
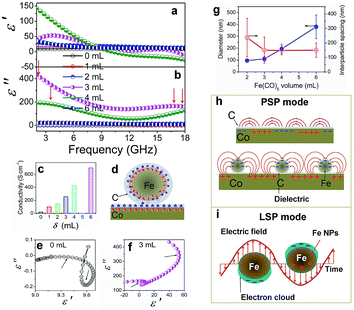
The complex permeability and permittivity are two key factors that influence the microwave absorption properties and are investigated at 2–18 GHz, as shown in Fig. 8. Fig. 8a and b depict the plots of the complex permittivity of the Co/C/Fe/C CSHFs. The Co/C/Fe/C CSHFs formed at δ = 3 mL exhibit the negative ε′ at 17.2–18 GHz; the ones formed at δ = 4 mL take on the negative ε′ at 10.4–18 GHz. The negative permittivity is generally generated because the original electric field is lower than the sum of the induced electrical fields and the polarization-electrical field.5,55 In the present study, the plasmon resonance on the Co/C and Fe/C plasmon surfaces generates the highly induced electrical fields,56,57 giving rise to the negative permittivity. ε′ and ε′′ initially increase and subsequently decrease with increasing δ. ε′ and ε′′ varied in the ranges of −27.3–143.5 and −0.19–433.8, respectively, and reach their maximum at δ = 3–4 mL (ε′: −27.3 to 143.5; ε′′: 39.8 to 433.8). These values are −3–15 times and −50![[thin space (1/6-em)]](https://www.rsc.org/images/entities/char_2009.gif) 091–7666 times those of the Co HFs (ε′: 9.0–9.7; ε′′: −0.19–0.05) and are much higher than those of Co3Fe7/C core–shell microspheres (ε′: 12–25; ε′′: 8–17),33 FeCo@C core–shell NPs (ε′: 2–12.5; ε′′: 1–4)58 and FeCo microspheres (ε′: 4.4–4.8; ε′′ ≈ 0.5).32 The high ε′ and ε′′ values correspond to the high storage and loss capacities, respectively, of the electric energy for Co/C/Fe/C CSHFs.
091–7666 times those of the Co HFs (ε′: 9.0–9.7; ε′′: −0.19–0.05) and are much higher than those of Co3Fe7/C core–shell microspheres (ε′: 12–25; ε′′: 8–17),33 FeCo@C core–shell NPs (ε′: 2–12.5; ε′′: 1–4)58 and FeCo microspheres (ε′: 4.4–4.8; ε′′ ≈ 0.5).32 The high ε′ and ε′′ values correspond to the high storage and loss capacities, respectively, of the electric energy for Co/C/Fe/C CSHFs.
The enhanced permittivity reported here can be due to the synergistic effect of strong dielectric polarization, dual relaxations and plasmon resonance caused by the high conductivity, unique heterostructure and strawberry-like surface of the Co/C/Fe/C CSHFs. First, the higher conductivity of the Co/C/Fe/C CSHFs than that of the Co HFs (Fig. 8c) and the lower work functions of Fe (4.5 eV) than that of Co (5.0 eV)59 promote the generation and transfer of free electrons inside Co and Fe. The structural defects in the outer C shell, which have been confirmed by TEM and Raman analysis, can act as polarization centers under the EM wave irradiation.60 Under an alternating EM field, the local movement of bound charges and the variation of dipole moments enable space charge and electron polarizations, leading to increased permittivity. Seen from Raman data in Fig. 4 and EDX data in Fig. 2g, the Co/C/Fe/C CSHFs obtained at δ = 4 mL have low IG/ID and high C content, therefore more polarization centers caused by the defects in disordered C generate the high electron polarizations and permittivity.
Second, according to the Maxwell–Wagner–Sillars effect,61 more free electrons accumulate at the interfaces of Co/C and Fe/C to form numerous dipoles, causing strong interfacial polarization under the fluctuating EM field (Fig. 8b). In the unique heterostructure of the Co/C/Fe/C CSHFs, the additional interfaces between metals (Co, Fe) and C and between Co/C and Fe/C are responsible for the higher interfacial polarization and permittivity of the Co/C/Fe/C CSHFs than the Co HFs. The Cole–Cole curves (described by the curve of ε′ versus ε′′) verify the dual relaxation mechanism of the Co/C/Fe/C CSHFs (Fig. 8e and f). According to Debye theory62–64 ε′ and ε′′ satisfy the formula:  , where ε∞ and εs are the optical and static permittivity, respectively. As shown in Fig. 8f, the Co/C/Fe/C CSHFs exhibit two Cole–Cole semicircles with different radii, corresponding to the dual relaxation processes. The dual relaxation are mainly derived from the interfacial polarization between metals (Co, Fe) and C and between Co/C and Fe/C. The larger diameter of the Cole–Cole semicircles in Fig. 8f than those in Fig. 8e indicate the stronger dielectric relaxations of the Co/C/Fe/C CSHFs than the Co HFs. The irregular semicircles indicate the coexistence of electron polarization, dipolar polarization65 and Debye relaxation.
Third, we may reasonably deduce from Raman data (Fig. 4) that SPs can form in the metal–dielectric heterostructure,66 which plays a key role in the permittivity enhancement. For the Co/C/Fe/C CSHFs with a strawberry-like surface and interface, the metal–dielectric interfaces of Co/C and Fe/C function as two kinds of SPs, i.e., PSP (Fig. 8h) and LSP (Fig. 8i). Plasmonic enhancement in EM parameters is achieved by two possible mechanisms: (i) under an alternating EM field, the free electrons inside Co and Fe oscillate collectively to form a plasmon resonance, which considerably enhance polarization and permittivity; (ii) the near-field coupling of EM fields. Nanostructures function as antennas that concentrate incident EM wave on the metal surface and generate intense near-fields, which can be orders of magnitude higher than incident EM wave. At the metal–dielectric interfaces of the planar Co/C and Fe/C, the collective oscillation of free electrons creates a strong, oscillating near field via PSP mode (Fig. 8h). In a plasmonic Fe/C NP, the excited electrons confined within the volume of the Fe NP produce highly energetic local EM fields via LSPR mode (Fig. 8i). The spatial confinement effect of these plasmonic heterostructures induces highly intense near fields, thereby enhancing the local electric fields and permittivity. The near field on one NP can interact with that on a neighboring particle in close proximity. This phenomenon is defined as plasmon coupling, which depends on interparticle interactions. The plasmon resonant peak shifts significantly to a low frequency with increasing particle size67 and increasing interparticle spacing.68 The shift declines exponentially with increasing interparticle spacing. The plasmon coupling becomes stronger when the interparticle spacing varies from around 10 nm to shorter. In this study, the diameter increases and the interparticle spacing decreases with δ varying from 1 mL to 6 mL (Fig. 8g) and the interparticle-spacing-to-diameter ratio determines plasmon resonance and coupling. Strong scattering and absorption are generated when the incident EM wave is in the region of the resonance wavelength of Fe/C NPs. A strong plasmon resonant peak occurs at δ = 3–4 mL with the interparticle-spacing-to-diameter ratio of 1.36–0.76. The resonant peak disappears at δ = 2 mL as the interparticle spacing becomes 2.49 times of the diameter, giving rise to a weak plasmon coupling. Similarly, Zhang et al.69 have found that the shift drops to zero when the interparticle spacing exceeds approximately 2.5 times of the diameter. No resonant absorption peak is observed at δ = 6 mL with an interparticle-spacing-to-diameter ratio of 0.40. The probable reason is that the large diameter corresponds to the small specific surface and large radius of the curvature, which decreases charge density and adversely affects the formation of plasmon resonance. Additionally, the disordered C shells in the Co/C/Fe/C CSHFs exhibit the higher electrical resistivity than those of Co and Fe due to the disordered microstructure and defects.70 The disordered C shell plays an insulation protection role on the Co and Fe surface similarly to SiO2, Al2O3 and TiO2. In this case, the permittivity decreases with shell thickness. These also explain why the ε′ and ε′′ of the Co/C/Fe/C CSHFs sharply reduce at δ = 6 mL. Based on the above analysis, the distinct increase in ε′ and ε′′ at δ = 3–4 mL should be ascribed to the synergistic effect of dielectric polarization, multiple relaxations and plasmon resonance; the decrease at δ = 6 mL mainly is owing to the insulation protection role of the disordered C shell and the weakened plasmon resonance.
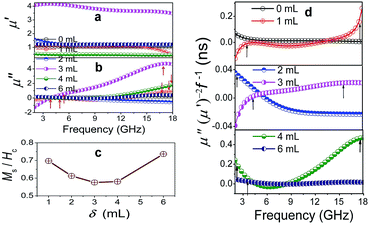
Also, the plasmon resonance contributes greatly to permeability and magnetic loss. The negative values of μ′′ are found for Co/C/Fe/C CSHFs (Fig. 9b), indicating that magnetic energy is radiated out of the Co/C/Fe/C CSHFs. The radiated energy is probably due to the local movement of bound charges and the variation of dipole moments on the Co/C and Fe/C surfaces, which produces an AC electric field. According to the Maxwell equations, the AC electric field can induce a magnetic field.71 In this study, the plasmon resonance generates the significantly enhanced electric field, which induces a magnetic field under an alternating EM field. The negative permeability will generate when the induced magnetic field is higher than the original magnetic field.72 The Co/C/Fe/C CSHFs with a strawberry-like surface exhibit the enhanced permeability. μ′ and μ′′ exhibit an inverted U change trend and reach the maximum values (μ′: 3.47–4.06; μ′′: −1.3–4.6) at δ = 3 mL. The maximum μ′ and μ′′ values are 3.4–3.9 times and −7.9–39.3 times that of Co HFs (μ′: 1.01–1.08; μ′′: 0.09–0.17) (Fig. 9a and b), respectively. These values are significantly higher than those of the Co3Fe7/C core–shell microspheres (μ′′: −0.1–0.05),33 FeCo/C core–shell NPs (μ′′: 0.2–1.5)58 and FeCo microspheres (μ′′: 0.05–0.19).32 The high μ′ and μ′′ values correspond to the high storage and loss capacities, respectively, of the magnetic energy.
Permeability enhancement is generally related to a high Ms,18 low eddy current effects21 or a large anisotropic field.22 High Ms/Hc values also contribute to permeability enhancement.19 However, the Ms/Hc values reported here present a U-type change trend with increasing δ (Fig. 9c) and are minimal at δ = 3–4 mL. Thus, we have a conclusion that plasmon resonance and coupling play a more crucial role in permeability enhancement than a high Ms and a low Hc. For Co/C/Fe/C CSHFs with a strawberry-like surface, the excited electrons confined within the volume of the Fe NP and at the interfaces of Co and C produce the strong near field via LSPR and PSP modes, respectively (Fig. 8h and i). The strong near field can improve the EM wave absorption24 (Fig. 8h and i). The strong near field extends into the Co/Fe and C layers, where the magnetic portion produces an enhanced permeability. Meanwhile, the collective oscillation of confined electrons produces the strong plasmon resonance under LSPR mode (Fig. 8i). Co/C/Fe/C CSHFs with strawberry-like surface exhibit larger μ′′ values than CSHFs with compact particle film, meaning that the LSP mode is conducive to the increase in the μ′′ values.73 Similar phenomena are also reported for ZnO/Ag/ZnO thin films.74
The Co/C/Fe/C CSHFs exhibit a dual-resonance behavior in the μ′′ curves (Fig. 9b). The weak peak below 4.43 GHz is generally associated with the natural resonance. The weakened in natural resonance may be caused by strong and wide plasmon resonance. The natural resonance frequency (fr) of the Co/C/Fe/C CSHFs shifts to a smaller frequency than that of Fe nanowires (5.6 GHz)75 probably due to the small shape anisotropy and size effect. The wide and strong peaks at 11–18 GHz are related to the “exchange mode” resonance caused by the surface effect, small size effect and spin wave excitations.18 In this study, the “exchange mode” resonance is due to the plasmon resonances, i.e., the collective oscillation of conductive electrons inside Co and Fe under the action of EM waves. The peak intensity varies in the following order: I3mL > I4mL > I1mL > I6mL > I0mL > I2mL. The variations in the intensity and position of the resonance peaks presented here are probably due to the synergistic effect of the interparticle spacing and particle size of Fe/C NPs.
The influence of plasmon resonances on the magnetic loss can also be confirmed by eddy current loss. Eddy current loss is calculated using the formula μ′′(μ′)−2f−1 = 2πμ0σd2/3, where μ0 is the vacuum permeability, σ is the conductivity, and d is the sample thickness. In Fig. 9d, the eddy current loss shows a weak peak for all samples below 6 GHz, strong and broad peaks at 9–18 GHz for Co/C/Fe/C CSHFs at δ = 1–4 mL, and nearly constant at 6–18 GHz for pure Co HFs and Co/C/Fe/C CSHFs at δ = 6 mL. According to the skin effect criterion,18 the magnetic loss at 2–6 GHz originate from the natural resonance for all the samples, whereas the magnetic loss at 6–18 GHz originate from the eddy current loss for pure Co HFs and Co/C/Fe/C CSHFs at δ = 6 mL and from the plasmon resonance for Co/C/Fe/C CSHFs at δ = 1–4 mL.
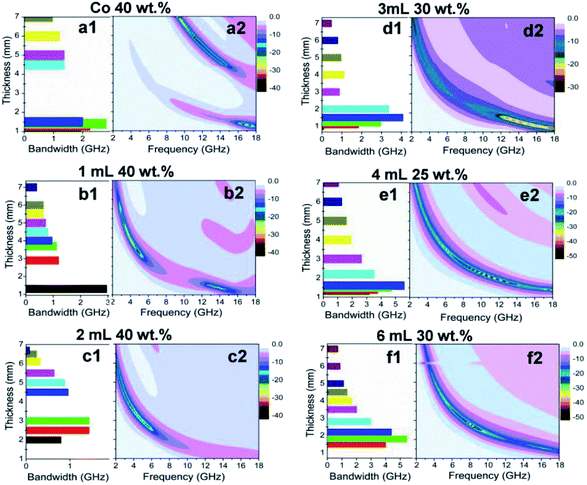
The microwave absorption performances of the samples were obtained by optimizing the mass fraction and the sample thickness. The data are listed in Fig. 10, S6† and Table 1. As shown, four clear differences can be observed between the absorption performances of Co/C/Fe/C CSHFs and pure Co HFs. The first is the difference in the cancellation models. The λ/4 cancellation model is used for the Co/C/Fe/C CSHFs, whereas the 3λ/4 cancellation model is utilized for the Co HFs. The absorbing band of the Co/C/Fe/C CSHFs shifts toward a lower frequency compared with that of the Co HFs, indicating the better low-frequency absorbing ability of the former. The second is the broad effective bandwidth (RL ≤ −10 dB). The Co/C/Fe/C CSHFs formed at δ = 3–6 mL exhibit a significantly broader bandwidth of 4.08–5.6 GHz than that of pure Co HFs (2.8 GHz). The third is the strong absorption. The Co/C/Fe/C CSHFs formed at δ = 4–6 mL exhibit a stronger absorption (−45.06 to −41.09 dB) than pure Co HFs (−39.06 dB). The fourth is the light weight. The Co/C/Fe/C CSHFs formed with a strawberry-like surface at δ = 3–6 mL have a lower filling mass fraction (25–30 wt%) than the Co HFs (40 wt%). The density is 1.12–1.27 g cm−3 for the Co/C/Fe/C-paraffin composites and 1.36 g cm−3 for the Co-paraffin composites, meaning lighter weight of the former. Comparative analysis indicates that the Co/C/Fe/C CSHFs formed at δ = 4–6 mL exhibit a strong absorption and a broad bandwidth at a low filling mass fraction (Fig. 10). Thus, they are eminently suitable for MAMs with strong absorption, broad bandwidth and light weight (Table 1). These data indicate that when the size of Fe/C NPs with an interparticle spacing of 150 ± 50 nm varies in the range of 110 ± 20–380 ± 100 nm, the Co/C/Fe/C CSHFs exhibit a significant plasmon resonance, which enhances the EM and gives rise to excellent microwave properties (Table 1). The optimal EM wave absorption performance is exhibited by the Co/C/Fe/C CSHFs formed at δ = 4 mL with a diameter of 195 ± 40 nm and an interparticle spacing of 148 ± 30 nm. A minimum reflective loss (RL) of −45.06 dB is found at 17.92 GHz, which corresponds to an absorber thickness of 1.6 mm. The RL (below −20 dB) is obtained over 2.0–18.0 GHz at the absorber thickness range of 1.35–9.0 mm (Table 1). Table 1 shows that the Co/C/Fe/C CSHFs formed at δ = 4 mL have a significantly enhanced microwave absorption, a lower filling ratio, a stronger absorption and a broader bandwidth.
| Fe(CO)5 volume (mL) | Filling mass fraction (%) | Optimal RL value (dB) | f (GHz), (optimal RL) | dw (mm), (RL < −20 dB) | Frequency range (GHz), (RL< −20 dB) | Bandwidth (GHz) (RL < −10 dB) | Ref. |
|---|---|---|---|---|---|---|---|
| Co flower | 66.7 | −25 | 5.6 | — | — | 3 | 76 |
| CNTs/Co@C | 60 | −23.2 | 4.9 | — | — | <2 | 3 |
| Co@C | 50 | −39.6 | 9.6 | — | — | 3.8 | 28 |
| FeCo/graphene | 50 | −40.2 | 8.9 | 2.0–8.0 | 2.3–12.8 | <4.5 | 30 |
| FeCo/C composites | 70 | −43.8 | 13.7 | — | — | 5.44 | 2 |
| FeCo microspheres | 40 | −30.8 | 11.4 | 1.2–2.0 | 10.9–15.6 | <3.5 | 32 |
| Co3Fe7/C microspheres | 35 | −44.4 | 10.2 | 1.4–2.0 | 9.7–15.2 | 4.1 | 33 |
| Co7O3 | 70 | −78.4 | — | — | — | 6.7 | 1 |
| FeCo nanoparticle/nano porous carbon | 50 | −21.7 | 15.2 | 2.0 | 14.8–16.0 | 5.8 | 34 |
| Co HFs | 40 | −39.06 | 9.36 | 1.25–1.3 | 8.29–14.6 | 2.8 | This work |
| 4.5–7.8 | 16.5–17.55 | ||||||
| Co/C/Fe/C CSHFs (1 mL) | 40 | −34.52 | 3.92 | 3.3–5.1 | 3.12–4.88 | 2.96 | This work |
| Co/C/Fe/C CSHFs (2 mL) | 40 | −20.92 | 2 | 5.4–5.5 | 2–2.32 | 1.44 | This work |
| 5.7–6.1 | |||||||
| Co/C/Fe/C CSHFs (3 mL) | 30 | −27.59 | 17.6 | 1.2–1.5 | 13.76–14.72 | 4.08 | This work |
| Co/C/Fe/C CSHFs (4 mL) | 25 | −45.06 | 17.92 | 1.35–9.0 | 2.0–18.0 | 5.6 | This work |
| Co/C/Fe/C CSHFs (6 mL) | 30 | −41.09 | 8 | 2.8–4.5 | 4.56–8.4 | 5.44 | This work |
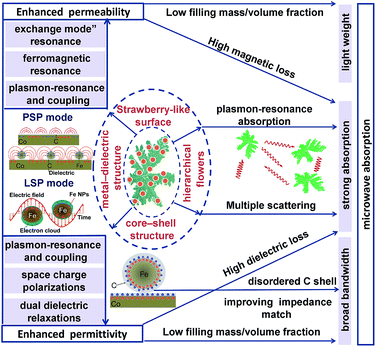
Anyhow, the superior EM absorption performances of Co/C/Fe/C CSHFs obtained at δ = 3–6 mL containing strong absorption, broad bandwidth, thin thickness and light weight are mainly ascribed to the core–shell, metal–dielectric and hierarchical heterostructures of Co/C/Fe/C CSHFs with strawberry-like surface, as shown in Fig. 11. (i) In this study, the thin and light MAMs can be achieved via increasing EM parameters of the Co/C/Fe/C CSHFs and decreasing the filling mass/volume fraction of absorbers in a matrix. The core–shell and metal–dielectric heterostructures with strawberry-like surface can enhance the permittivity due to the space charge polarizations, dual dielectric relaxations and plasmon resonance and coupling. The permeability is enhanced due to ferromagnetic resonance and exchange mode” resonance, which is induced by plasmon-resonance and coupling. (ii) The strong absorption is ascribed to high attenuation constant and plasmon resonance absorption of Co/C/Fe/C CSHFs. Co/C/Fe/C CSHFs with strawberry-like surface have much higher attenuation constant than pure Co HFs owing to high dielectric loss and magnetic loss caused by heterostructures with the strawberry-like surface (Fig. S7a†). The high attenuation constant means that more EM waves are absorbed by MAMA via converting them into thermal energy or interfere. Meanwhile, Co/C/Fe/C CSHFs function as antennas that concentrate EM wave on the Fe and Co surface and generate intense near-fields. On the strawberry-like surface, Fe/C NPs interact each other by near-field coupling of EM fields while the enhanced plasmon resonance increases the total EM energy absorption. Additionally, hierarchically flower-like structures randomly distributed in the matrix can exhibit multiple scattering and further increase the attenuation of the electromagnetic wave. (iii) In core–shell structure, the disordered C shell with high electrical resistivity plays an insulation protection role on the Co and Fe surface, which therefore improves the impedance matching and widens the bandwidth (Fig. S7b†).
4. Conclusions
Using hydrothermal–chemical vapor decomposition, we fabricated Co/C/Fe/C CSHFs at various interparticle spacing and sizes of Fe/C NPs for plasmon-resonance-enhanced microwave absorption. The diameter and interparticle spacing of Fe/C NPs were 25 ± 10–380 ± 100 nm and 38 ± 12–240 ± 130 nm, respectively, which could be changed by adjusting δ and Td through a carefully devised kinetically tuned procedure. A low Td and small δ contributed to the formation of a strawberry-like plasmon surface. Owing to plasmon resonance and coupling, the Co/C/Fe/C CSHFs with a strawberry-like surface exhibited negative permittivity and permeability, significantly enhanced permittivity and permeability, multiple resonances and attenuation compared with the Co HFs. These features suggest that Co/C/Fe/C CSHFs have great potential as excellent absorbers with strong absorption, broad bandwidth and light weight. The Co/C/Fe/C CSHFs with a particle size of 110 ± 20 nm and an interparticle spacing of 150 ± 90 nm exhibit an enhanced microwave absorption. The minimal RL of −45.06 dB is reached at 17.92 GHz. The frequency range (RL ≤ −20 dB) of 16 GHz ranges from 2 GHz to 18 GHz, and the RL values below −10 dB (90% attenuation) reaches 5.6 GHz. This finding can effectively guide the design and fabrication of plasmon resonance absorbers for broadband and lightweight microwave absorption.Conflicts of interest
There are no conflicts to declare.Acknowledgements
Support from the National Natural Scientific Foundation of China (51672252), Public Utility Items of Zhejiang Province (2015C31022) and Natural Scientific Foundation of Zhejiang Province (LY14B010001) is appreciated.Notes and references
- N. Chen, J. T. Jiang, C. Y. Xu, Y. Yuan, Y. X. Gong and L. Zhen, ACS Appl. Mater. Interfaces, 2017, 9, 21933–21941 CrossRef CAS PubMed.
- D. R. Li, B. S. Zhang, W. Liu, X. H. Liang and G. B. Ji, Dalton Trans., 2017, 46, 14926–14933 RSC.
- N. N. Wu, J. Qiao, J. R. Liu, W. J. Du, D. Mei and W. Liu, Advanced Composites and Hybrid Materials, 2018, 1, 149–159 CrossRef.
- T. Liu, P. H. Zhou, J. L. Xie and L. J. Deng, J. Appl. Phys., 2011, 110, 033918 CrossRef.
- B. Zhao and C. B. Park, J. Mater. Chem. C, 2017, 5, 6954–6961 RSC.
- Q. H. Liu, Q. Cao, H. Bi, C. Y. Liang, K. P. Yuan, W. She, Y. J. Yang and R. C. Che, Adv. Mater., 2016, 28, 486–490 CrossRef CAS PubMed.
- T. Wu, Y. T. Zhao, Y. N. Li, W. H. Wu and G. X. Tong, ChemCatChem, 2017, 9, 3486–3496 CrossRef CAS.
- Y. N. Li, T. Wu, K. Y. Jin, Y. Qian, N. X. Qian, K. D. Jiang, W. H. Wu and G. X. Tong, Appl. Surf. Sci., 2016, 387, 190–201 CrossRef CAS.
- Y. N. Li, T. Wu, K. D. Jiang, G. X. Tong, K. Y. Jin, N. X. Qian, L. H. Zhao and T. X. Lv, J. Mater. Chem. C, 2016, 4, 7119–7129 RSC.
- T. Wu, Y. Liu, T. T. Cui, Y. T. Zhao, Y. N. Li and G. X. Tong, ACS Appl. Mater. Interfaces, 2016, 8, 7370–7380 CrossRef CAS PubMed.
- X. J. Zhang, G. S. Wang, W. Q. Cao, Y. Z. Wei, J. F. Liang, L. Guo and M. S. Cao, ACS Appl. Mater. Interfaces, 2014, 6, 7471–7478 CrossRef CAS PubMed.
- Y. Zhang, T. F. Zhang, H. C. Chang, P. S. Xiao, H. H. Chen, Z. Y. Huang and Y. S. Chen, Adv. Mater., 2015, 27, 2049–2053 CrossRef CAS PubMed.
- L. Liu, Z. D. He, Y. T. Zhao, J. C. Sun and G. X. Tong, J. Alloys Compd., 2018, 765, 1218–1227 CrossRef CAS.
- Y. T. Zhao, L. Liu, J. N. Han, W. H. Wu and G. X. Tong, J. Alloys Compd., 2017, 728, 100–111 CrossRef CAS.
- Y. T. Zhao, L. Liu, K. D. Jiang, M. T. Fan, C. Jin, J. N. Han, W. H. Wu and G. X. Tong, RSC Adv., 2017, 7, 11561–11567 RSC.
- H. Sun, R. C. Che, X. You, Y. S. Jiang, Z. B. Yang, J. Deng, L. B. Qiu and H. S. Peng, Adv. Mater., 2014, 26, 8120–8125 CrossRef CAS PubMed.
- G. X. Tong, F. T. Liu, W. H. Wu, F. F. Du and J. G. Guan, J. Mater. Chem. A, 2014, 2, 7373–7382 RSC.
- Y. Liu, Y. N. Li, K. D. Jiang, G. X. Tong, T. X. Lv and W. H. Wu, J. Mater. Chem. C, 2016, 4, 7316–7323 RSC.
- G. X. Tong, Y. Liu, T. T. Cui, Y. N. Li, Y. T. Zhao and J. G. Guan, Appl. Phys. Lett., 2016, 108, 072905 CrossRef.
- G. X. Tong, W. H. Wu, Q. Hua, Y. Q. Miao, J. G. Guan and H. S. Qian, J. Alloys Compd., 2011, 509, 451–456 CrossRef CAS.
- Y. Liu, T. T. Cui, Y. N. Li, Y. C. Ye and G. X. Tong, Mater. Chem. Phys., 2016, 173, 152–160 CrossRef CAS.
- C. Kittel, Phys. Rev., 1948, 73, 155–161 CrossRef CAS.
- V. S. Tkachenko, A. N. Kuchko, M. Dvornik and V. V. Kruglyak, Appl. Phys. Lett., 2012, 101, 152402 CrossRef.
- Y. H. Jang, Y. J. Jang, S. Kim, L. N. Quan, K. Chung and D. H. Kim, Chem. Rev., 2016, 116, 14982–15034 CrossRef CAS PubMed.
- J. Lermé, C. Bonnet, M. Broyer, E. Cottancin, D. Manchon and M. Pellarin, J. Phys. Chem. C, 2013, 117, 6383–6398 CrossRef.
- S. Eustis and M. A. EI-Sayed, Chem. Soc. Rev., 2006, 35, 209–217 RSC.
- H. Wang, F. Tam, N. K. Grady and N. J. Halas, J. Phys. Chem. B, 2005, 109, 18218–18222 CrossRef CAS PubMed.
- R. Qiang, Y. C. Du, D. T. Chen, W. J. Ma, Y. Wang, P. Xu, J. Ma, H. T. Zhao and X. J. Hang, J. Alloys Compd., 2016, 681, 384–393 CrossRef CAS.
- B. Zhao, J. S. Deng, L. Y. Liang, C. Y. X. Zuo, Z. Y. Bai, X. Q. Guo and R. Zhang, CrystEngComm, 2017, 19, 6095–6106 RSC.
- X. H. Li, J. Feng, Y. P. Du, J. T. Bai, H. M. Fan, H. L. Zhang, Y. Peng and F. S. Li, J. Mater. Chem. A, 2015, 3, 5535–5546 RSC.
- J. Xiang, X. H. Zhang, Q. Ye, J. L. Ye and X. Q. Shen, Mater. Res. Bull., 2014, 60, 589–595 CrossRef CAS.
- X. G. Liu, D. Y. Geng and Z. D. Zhang, Appl. Phys. Lett., 2008, 92, 243110 CrossRef.
- W. X. Li, L. C. Wang, G. M. Li and Y. Xu, Mater. Chem. Phys., 2015, 163, 431–438 CrossRef CAS.
- X. M. Zhang, G. B. Ji, W. Liu, B. Quan, X. H. Liang, C. M. Shang, Y. Cheng and Y. W. Du, Nanoscale, 2015, 7, 12932–12942 RSC.
- X. F. Zhang, Y. X. Li, R. G. Liu, Y. Rao, H. W. Rong and G. W. Qin, ACS Appl. Mater. Interfaces, 2016, 8, 3494–3498 CrossRef CAS PubMed.
- G. X. Tong, J. H. Yuan, W. H. Wu, Q. Hu, H. S. Qian, L. C. Li and J. P. Shen, CrystEngComm, 2012, 14, 2071–2079 RSC.
- M. Descostes, F. Mercier, N. Thromat, C. Beaucaire and M. Gautier-Soyer, Appl. Surf. Sci., 2000, 165, 288–302 CrossRef CAS.
- E. B. Castro and C. A. Gervasi, Int. J. Hydrogen Energy, 2000, 25, 1163–1170 CrossRef CAS.
- C. Moreno-Castill, M. V. Lopez-Ramon and F. Carrasco-Marın, Carbon, 2000, 38, 1995–2001 CrossRef.
- M. C. Biesinger, B. P. Payne, A. P. Grosvenor, W. M. Lau, A. R. Gerson and R. S. C. Smart, Appl. Surf. Sci., 2011, 257, 2717–2730 CrossRef CAS.
- P. C. J. Graat and M. A. J. Somers, Appl. Surf. Sci., 1996, 100, 36–40 CrossRef.
- C. Altavilla, E. Ciliberto, A. Aiello, C. Sangergorio and D. Gatteschi, Chem. Mater., 2007, 19, 5980–5985 CrossRef CAS.
- G. Bhargava, I. Gouzman, C. M. Chun, T. A. Ramanarayanan and S. L. Bernasek, Appl. Surf. Sci., 2007, 253, 4322–4329 CrossRef CAS.
- T. Yu, Y. W. Zhu, X. J. Xu, Z. X. Shen, P. Chen, C. T. Lim, J. T. Thong and C. H. Sow, Adv. Mater., 2005, 17, 1595–1599 CrossRef CAS.
- H. Jabeen, K. C. Kemp and V. Chandra, J. Environ. Manage., 2013, 130, 429–435 CrossRef CAS PubMed.
- H. F. Zarick, W. R. Erwin, A. Boulesbaa, O. K. Hurd, J. A. Webb, A. A. Puretzky, D. B. Geohegan and R. Bardhan, ACS Photonics, 2016, 3, 385–394 CrossRef CAS.
- A. C. Ferrari, Solid State Commun., 2007, 143, 47–57 CrossRef CAS.
- Y. T. Zhao, L. Liu, T. T. Cui, C. Jin, G. X. Tong, Y. Qian and W. H. Wu, Appl. Surf. Sci., 2017, 412, 58–68 CrossRef CAS.
- L. Ju, B. S. Geng, J. Horng, C. Girit, M. Martin, Z. Hao, H. A. Bechtel, X. G. Liang, A. Z. Y. R. Shen and F. Wang, Nat. Nanotechnol., 2011, 6, 630–634 CrossRef CAS PubMed.
- J. Ahmed, S. Sharma, K. V. Ramanujachary, S. E. Lofland and A. k. Gangul, J. Colloid Interface Sci., 2009, 336, 814–819 CrossRef CAS PubMed.
- M. Erbudak, E. Wetli, M. Hochstrasser, D. Pescia and D. D. Vvedensky, Phys. Rev. Lett., 1997, 79, 1893 CrossRef CAS.
- W. D. Zhong, Ferromagnetic, Science Press, Beijing, 1998, p. 8 Search PubMed.
- Y. Lu, Y. Wang, H. Li, Y. Lin, Z. Jiang, Z. Xie, Q. Kuang and L. Zheng, ACS Appl. Mater. Interfaces, 2015, 7, 13604–13611 CrossRef CAS PubMed.
- G. X. Tong, Y. Liu, T. Wu, C. L. Tong and F. F. Du, J. Mater. Chem. C, 2015, 3, 5506–5515 RSC.
- X. Yao, X. Kou, J. Qiu and M. Moloney, RSC Adv., 2016, 6, 35378–35386 RSC.
- J. B. Pendry, M. L. Moreno and F. J. Garcia-Vidal, Science, 2004, 305, 847–848 CrossRef CAS PubMed.
- X. C. Yao, X. C. Kou and J. Qiu, Carbon, 2016, 107, 261–267 CrossRef CAS.
- S. S. S. Afghahi and A. Shokuhfar, J. Magn. Magn. Mater., 2014, 370, 37–44 CrossRef CAS.
- H. B. Michaelson, J. Appl. Phys., 1977, 48, 4729–4733 CrossRef CAS.
- Y. C. Du, W. W. Liu, R. Qiang, Y. Wang, X. J. Han, J. Ma and P. Xu, ACS Appl. Mater. Interfaces, 2014, 6, 12997–13006 CrossRef CAS PubMed.
- M. Kuriakose, S. Longuemart, M. Depriester, S. Delenclos and A. H. Sahraoui, Phys. Rev. E: Stat., Nonlinear, Soft Matter Phys., 2014, 89, 022511 CrossRef CAS PubMed.
- H. Wu, G. Wu, Y. Ren, L. Yang, L. Wang and X. Li, J. Mater. Chem. C, 2015, 3(29), 7677–7690 RSC.
- D. Lan, M. Qin, R. Yang, S. Chen, H. Wu, Y. Fan, Q. Fu and F. Zhang, J. Colloid Interface Sci., 2019, 533, 481–491 CrossRef CAS PubMed.
- G. Viau, F. Fievet-Vincent, F. Fievet, P. Toneguzzo, F. Ravel and O. Acher, J. Appl. Phys., 1997, 81, 2749 CrossRef CAS.
- Y. T. Zhao, L. Liu, K. D. Jiang, M. T. Fan, C. Jin, J. N. Han, W. H. Wu and G. X. Tong, RSC Adv., 2017, 7, 11561–11567 RSC.
- A. K. Sharma, R. J. Jha and B. D. Gupta, IEEE Sens. J., 2007, 7, 1118–1129 Search PubMed.
- K. C. Lee, S. J. Lin, C. H. Lin, C. S. Tsai and Y. J. Lu, Surf. Coat. Technol., 2008, 202, 5339–5340 CrossRef CAS.
- N. Hooshmand, S. R. Panikkanvalappil and M. A. Elsayed, J. Phys. Chem. C, 2016, 120, 20896–20904 CrossRef CAS.
- K. H. Su, Q. H. Wei, X. Zhang, J. J. Mock, D. R. Smith and S. Schultz, Nano Lett., 2003, 3, 1087–1090 CrossRef CAS.
- X. F. Zhang, X. L. Dong, H. Huang, Y. Y. Liu, B. Lv, J. P. Lei and C. J. Choi, J. Phys. D: Appl. Phys., 2007, 40, 5383–5387 CrossRef CAS.
- L. J. Deng and M. G. Han, Appl. Phys. Lett., 2007, 91, 023119 CrossRef.
- B. Zhao and C. B. Park, J. Mater. Chem. C, 2017, 5, 6954–6961 RSC.
- L. Liu, N. He, T. Wu, P. B. Hu and G. X. Tong, Chem. Eng. J., 2009, 335, 103–108 Search PubMed.
- D. Z. Zhang, P. P. Wang, R. Murakami and X. P. Song, Appl. Phys. Lett., 2010, 96, 233114 CrossRef.
- J. R. Liu, M. Itoh, M. Terada, T. Horikawa and K. Machida, Appl. Phys. Lett., 2007, 91, 093101 CrossRef.
- T. Liu, P. H. Zhou, J. L. Xie and L. J. Deng, J. Appl. Phys., 2011, 110, 033918 CrossRef.
Footnote |
| † Electronic supplementary information (ESI) available: SEM images and EDX spectra of Co HFs and Co/C/Fe/C CSHFs formed under various Td and δ. 3D plots, reflection loss curves, attenuation constant and impedance matching of Co/C/Fe/C CSHFs. See DOI: 10.1039/c9ra04988f |
| This journal is © The Royal Society of Chemistry 2019 |


