 Open Access Article
A comparative study of different electrodeposited NiCo2O4 microspheres anchored on a reduced graphene oxide platform: electrochemical sensor for anti-depressant drug venlafaxine
Marwa F. B.
Ali
 and
Marwa R.
El-Zahry
 *
*
Pharmaceutical Analytical Chemistry Department, Faculty of Pharmacy, Assiut University, Assiut, 71526, Egypt. E-mail: marwazahry@aun.edu.eg; Tel: +20-88-2411520
First published on 4th October 2019
Abstract
Two different fabrication methods were performed and compared for preparation of binary metallic oxide microstructures supported on a reduced graphene oxide (rGO) modified graphite electrode. Nickel–Cobalt oxide microspheres (NiCo2O4 MSs) were prepared by two different deposition methods: wet chemical and in situ-electrical deposited methods. Different characterization methods were conducted, including cyclic voltammetry (CV), scanning emission microscopy (SEM), electrochemical impedance spectroscopy (EIS) and Raman spectroscopy. The deposition methods of NiCo2O4 MSs were found to affect the electrochemical behavior of the modified electrodes towards the oxidation of venlafaxine (VEN), an anti-depressant drug. The fabricated electrode showed linearity over the range 5–500 nmol L−1 and an excellent sensitivity with a limit of detection (LOD) and limit of quantitation (LOQ) of 3.4 and 10.3 nmol L−1, respectively. It was revealed that the wet-NiCo2O4@rGO modified electrode prepared by the wet chemical method showed an improved electrochemical behavior for determination of VEN in pharmaceuticals and human plasma with high recovery results in the range of 96.7–98.6% and 96.0–100.7%, respectively without any interference from the co-existing components.
Introduction
Venlafaxine (VEN), an anti-depressant drug, is a selective serotonin-norepinephrine reuptake inhibitor (SNRI) used in the treatment of depression, social phobia, generalized anxiety and panic disorder. It increases the concentration of the neurotransmitters serotonin and norepinephrine in the brain.1,2 However, an overdose of VEN leads to serious adverse effects; it might cause symptoms of depression, serotonin toxicity, seizure, or cardiac conduction abnormalities.3 To avoid the adverse effects and toxicity, monitoring its therapeutic efficiency, as well as the drug level in body fluids should be carefully followed. Hence, the main aim of this research is to develop a simple, highly sensitive and cost effective analytical method to quantify VEN in biological fluids.After a careful literature survey, it was revealed that most of the analytical methods for determination of VEN are HPLC methods.4–12 However, these methods face some drawbacks including the cost of equipment, consumption of large volumes of solvents and requirement of several pretreatment procedures for biological samples. Also, thin layer chromatography (TLC) was described for VEN analysis in bulk and capsules.13 Many spectrophotometric methods14–22 and spectrofluorimetric methods23,24 have been reported for quantitation of VEN as well. Capillary electrophoresis was used for stereoselective analysis of VEN and its metabolites25 and for determination of the toxic levels of VEN in human serum.26
Only few research articles were reported for the utility of electrochemical techniques in the determination of VEN27–31 especially in biological fluids.27–30 Two of them used hanging mercury drop electrode (HMDE) as working electrode27,28 which suffers from several drawbacks such as toxicity, fluctuation of mercury drop surface area, and its limited applications in analysis of more positive potential range.
Pencil graphite electrode (PGE) has several attractive advantages compared with HMDE or other carbon-based electrodes. It has high electrochemical reactivity, good mechanical rigidity, low background current, low cost, commercial availability, offer simple polishing procedure easy in modification and it is considered user and environmental-friendly electrode.32–34
Due to its remarkable electrochemical properties, bimetallic oxides such NiCo2O4 have been used in different fields as electrocatalyst35,36 and in drug delivery system.37 They have tunable chemical and physical properties, low cost, low toxicity and natural availability. Additionally, they show remarkable magnetic and electrochemical behaviors differing from monometallic oxide.35
Recently, a lot of efforts have been made to improve the properties of the prepared NiCo2O4 nanostructures which related to its aggregation behavior that reduces its applicability. In order to reduce their aggregation and increase their potentialities, many nanoplatforms have been developed as backbone substrates to support these nanostructures. Graphene is a monolayer of carbon atoms used for two decades in modification of electrode. Graphene oxide (GO) is considered one of the most promising substrates due to its ability to bind with nanoparticles via its extra-ordinary chemical and physical properties. Comparing with other carbon-based platforms, such as multi-walled carbon nanotubes (MWCNTs), GO is considered the best because of its availability, cheapness and the ease of preparation. Removal oxygen containing functional groups from GO surface producing the reduced form of graphene oxide (rGO); having a lot of advantages; high surface area and excellent electrocatalytic performance compared with GO.38–40 Different reduction methods have been reported for preparation of rGO; such as chemical or thermal, or electrochemical reduction.39 Among carbon based electrode, rGO is considered an excellent material owing to its outstanding properties; such as high conducting activity, large surface to volume ratio, and chemical stability and inertness.32,40
The presented article describes a comparative study of utilizing two different fabrication approaches to prepare integrated microstructures of binary metallic nickel/cobalt oxide anchored on reduced graphene platform. Different characterization methods such as SEM, EIS and Raman spectroscopy were carried out to evaluate the morphology, spectral properties and the electrochemical behavior of the resultant hybrid microstructures modified electrode. Square wave voltammetric (SWV) curves were recorded using the fabricated wet-NiCo2O4@rGO modified sensor for analysis of VEN in pharmaceutical formulation and in human plasma without any interference from the complicated matrix. The proposed SWV method showed high sensitivity, selectivity, and accurate results when compared with previously reported electrochemical methods27–31 for VEN determination.
Experimental
Chemicals and reagents
Venlafaxine was kindly gifted from Mash premiere company, Ni (NO3)2·6H2O and Co(NO3)2·6H2O were obtained from Sigma Aldrich. Venlaxin® tablet (containing 75 mg VEN per tablet) and Venllamash® capsule (containing 75 mg VEN per capsule) were purchased from local market.Graphene oxide (GO) was synthesized following the modified Hummer's method.38 Potassium ferrocyanide with purity of 98% was purchased from Alpha Chemika, India.
All chemicals were of analytical reagent grade and were used as received. Deionized water was used for the preparation of standard solutions and electrolytes.
Apparatus
Using a Princeton VersaSTAT MC (VersaSTAT 3, Model RE-1, Princeton Applied Research, AMETEK, USA) controlled by 394 software in conjunction with a PAR Model polarographic analyzer, the electrochemical measurements were carried out. A three-electrodes cell containing bare or modified pencil graphite electrode PGE as a working electrode, Ag/AgCl (3 mol L−1 KCl) as a reference electrode and a platinum wire as an auxiliary electrode was employed. Z-view software (Z-view version 3.5d) was applied for electrochemical impedance spectroscopy calculations.The electrical contact with the pencil was conducted using a metallic wire wrapped to the metallic part of the lead inside the pencil. The pencil electrode (with a diameter of 0.5 mm and a length of 60 mm) was then fitted vertically and immersed into the electrolyte solution inside the electrochemical cell. The electrochemical measurements were carried out at room temperature (25 ± 5 °C).
Surface morphological studies of bare and modified electrodes were investigated using scanning electron microscope (SEM), JEOL JSM-5400 LV instrument (Oxford, USA). Raman spectra were monitored for GO and the fabricated in situ and wet-NiCo2O4@rGO using a Bruker Senterra Raman microscope (Bruker, Optics Inc., Germany) equipped with 785 nm excitation using a Nikon objective (×20) and a holographic grating with 1200 lines per mm along with a charge coupled device detector (CCD). The spectra were recorded over the range 400 to 2000 cm−1 using 8 s integration time.
All pH-metric measurements were made on Hanna pH meter (Hanna Instruments, São Paulo, Brazil) digital pH-meter with glass combination electrode. OriginPro 8.5 software was used for graphing and analyzing the experimental data.
Fabrication of NiCo2O4 microspheres anchored on rGO modified PGE
The resultant NiCo2O4@rGO were electrodeposited on the surface of PGE by applying a potential ranged from −0.9 to 1.5 V for 30 s. The modified PGE electrode is denoted with wet-NiCo2O4@rGO.
Applications
Results and discussion
The electrocatalytic behavior of VEN on different carbon electrodes
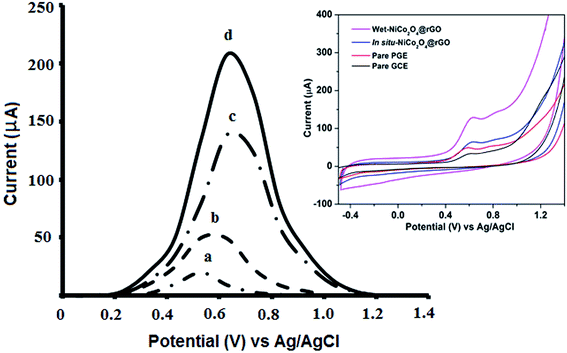
The effect of various types of carbon based electrodes, such as glassy carbon electrode (GCE), bare PGE and modified PGE, was investigated towards the electro-oxidation of VEN. Additionally, wet chemical or in situ-electrically deposited modified supported on PGE electrode were utilized to examine the electro-oxidation behavior of VEN.According to Fig. 1, VEN has a weak oxidation peak current at GCE (0.57 V), while a slightly intense and sharp oxidation peak current was provided at PGE bare (0.59 V). Using the wet-NiCo2O4@rGO modified electrode, the peak was shifted to 0.68 V and the intensity of the peak was increased by 4-fold compared with bare PGE. It can be noticed that wet-NiCo2O4@rGO modified electrode showed the highest sensitivity in terms of VEN oxidation peak current intensity. This shift could be attributed to the electrodeposited layer of composites on PGE, and the change in the charge transfer rate between the analyte and the modified NiCo2O4 electrode. These results confirm the significance of the modification step, suitability, and sensitivity of fabricated sensor for trace analysis of VEN in different matrices.
The prepared wet-NiCo2O4@rGO which was selected for subsequent work was electrically deposited on PGE surface, where different variables such as initial potential and deposition time were studied and optimized. Initial potential values ranged from −1.0 to +1.5 V and deposition time in the range from 10 to 90 s were investigated and it was concluded that the optimum results were obtained using initial potential of −0.9 V for 15 s as deposition time.
Characterization of the modified PGE
Upon synthesis of wet-NiCo2O4@rGO, hydroxyl ions will be released from ammonia on heating and consumed in complexation with metal salts (Ni2+ and Co2+). The concentration of the free metals is decreased in the formation of metal hydroxides. When it is mixed with GO solution, the metal ions attached to the negative surface of GO platform which is reduced to rGO due to the effect of ammonia.41Morphological characterization
The morphology of cross sections of bare PGE, in situ-NiCo2O4@rGO and wet-NiCo2O4@rGO modified electrodes were carried out by SEM technique. As shown in Fig. 2A, thin fragile layers of graphite with smooth surface morphology could be seen for bare electrode. In case of in situ-NiCo2O4@rGO modified electrode (Fig. 2B), the surface is covered with few microsphere like structures. Fig. 2C represents the wet-NiCo2O4@rGO modified one, the hybrid composite represented as microsphere like structures which are anchored allover PGE surface in the form of cavities and protrusions owing to the deposition of NiCo2O4 and rGO structures. Such modified structures may provide a high surface area of the interfacial surface between the analyte and the electrode; leading to increase the capability of hosting larger amount of drug; resulting in an increase in the oxidation peak current of VEN.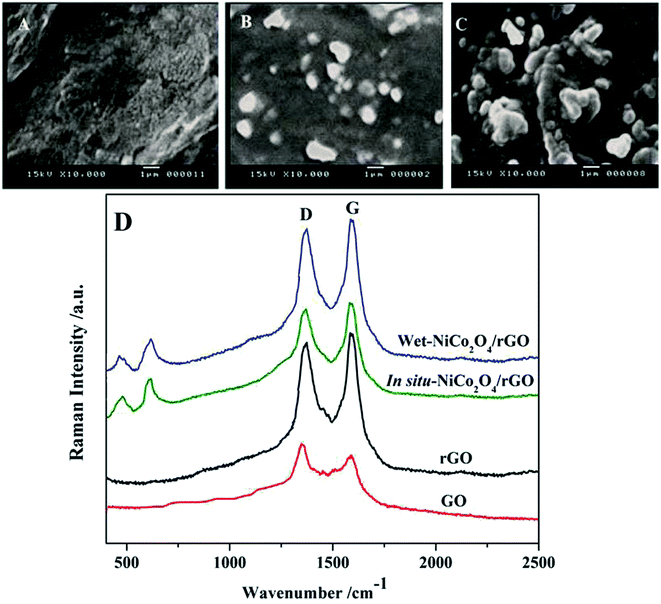 | ||
| Fig. 2 SEM images of (A) bare PGE, (B) in situ-NiCo2O4@rGO, (C) wet-NiCo2O4@rGO surfaces and (D) Raman spectra of GO, rGO, in situ and wet-NiCo2O4/rGO composite. | ||
In Fig. 2D, Raman spectra were recorded for GO, rGO, and the composites of in situ and wet-NiCo2O4/rGO. Two significant bands at 1350 (D band) and 1580 cm−1 (G band) assigning to the carbon bands were observed in the GO and rGO spectra. In case of both types of NiCo2O4/rGO, it clearly shown new bands appeared around 506 and 653 cm−1 which assigned to the vibration of Ni–O and Co–O bonds.35,42
Electrochemical characterization of the modified electrode using ferrocyanide-ferricyanide system
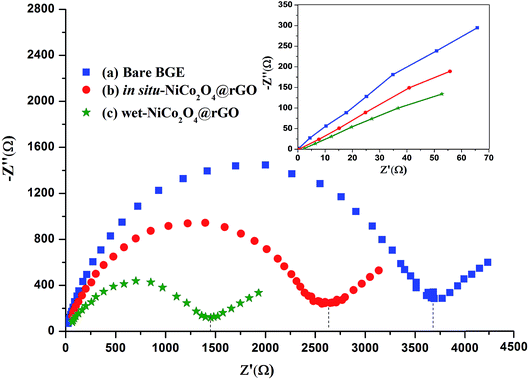
Ferrocyanide–ferricyanide redox couple (1.0 mmol L−1 Fe (CN)63−/4− in 0.5 mol L−1 KCl) was utilized to examine the electrochemical performance of bare PGE, in situ and wet-NiCo2O4@rGO electrodes.Electrochemical impedance spectroscopy (EIS) experiments as meaningful tool for studying the interface properties of the modified electrodes were conducted. The EIS results were fitted to a Randles indented as equivalent circuit. The circuit composed of solution resistance (Rs), the charge transfer resistance (Rct), and Warburg element (Ws). Fig. 3 exhibits the Nyquist plots of bare PGE and modified electrodes. Nyquist plot describes charge transfer resistance (Rct) across the electrode surface. The (Rct) is equal to the diameter of the semicircle portion which corresponds to electron-transfer limited process across PGE electrode. Rct values were measured for bare, in situ-NiCo2O4@rGO and wet-NiCo2O4@rGO. Comparing with in situ-NiCo2O4@rGO electrode, the Nyquist diameter of the semi-circle portion (Rct) of the bare PGE electrode (curve a, Rct ∼3600 Ω) is much larger than that deposited with in situ-NiCo2O4@rGO (curve b, ∼2600 Ω) indicating an acceleration of electron transfer. While deposition with wet-NiCo2O4@rGO, the Rct is markedly decreased to about ∼1400 Ω (curve c) which is agreed with the fact that the deposited layer of wet-NiCo2O4@rGO provided an increase in the electron transfer owing to their excellent conductivity.
It is well known that the electrochemical performance of any electrode is mainly proportional to the real contact surface area with the solution. So the main aim of the following section is to calculate the surface active area of the studied electrodes using Randles–Sevcik equation.43
| IP = (2.69 × 10⁵)n3/2AeffDR1/2C0ν1/2 |
Effect of scan rate
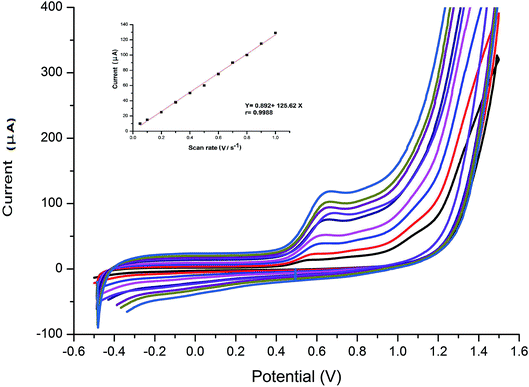
The effect of scan rate on the electro-oxidation of VEN at the wet-NiCo2O4@rGO was studied by CV technique. The cyclic voltammograms of 0.1 μmol L−1 VEN in BR buffer (pH 10.5) using modified electrode at different scan rates varying from 0.05 to 1.0 V s−1 were recorded and presented in Fig. 4. It can be seen that the anodic oxidation peak potential is shifted to more positive values by increasing the scan rate along with an increase in current signal indicating the irreversibility of the electro-chemical oxidation of VEN. According to the following equation, the peak current is directly proportional to scan rate. Good linearity was obtained between the oxidation peak current (IP) and the scan rate (ν), with high correlation coefficient equal to 0.9988, suggesting that the electrode reaction is controlled by adsorption rather that diffusion.| IP (μA) = 0.892 + 125.62ν (r = 0.9988) |
Further, the effect of logarithm scan rate (log![[thin space (1/6-em)]](https://www.rsc.org/images/entities/char_2009.gif) ν) on the logarithm peak current (log
ν) on the logarithm peak current (log![[thin space (1/6-em)]](https://www.rsc.org/images/entities/char_2009.gif) IP) was examined giving a straight line as shown in Fig. 5, with a slope of 0.953, very close to the theoretical value of 1,
IP) was examined giving a straight line as shown in Fig. 5, with a slope of 0.953, very close to the theoretical value of 1,
log![[thin space (1/6-em)]](https://www.rsc.org/images/entities/char_2009.gif) IP (μA) = 0.953 IP (μA) = 0.953![[thin space (1/6-em)]](https://www.rsc.org/images/entities/char_2009.gif) log log![[thin space (1/6-em)]](https://www.rsc.org/images/entities/char_2009.gif) ν + 2.09 (V s−1) (r = 0.9977) ν + 2.09 (V s−1) (r = 0.9977) |
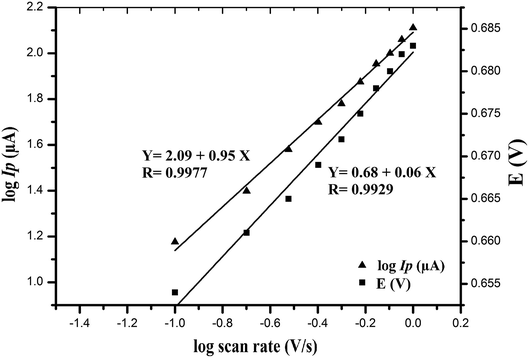 | ||
Fig. 5 Dependence of the logarithm of peak current (log![[thin space (1/6-em)]](https://www.rsc.org/images/entities/char_2009.gif) IP/μA) and the oxidation peak potential (E/V) of VEN on logarithm of scan rate (V s−1). IP/μA) and the oxidation peak potential (E/V) of VEN on logarithm of scan rate (V s−1). | ||
This result implied that the electrode process is adsorption controlled which is matched with the previously reported studies on VEN oxidation.29,30
Moreover, a linear relationship between EP and log![[thin space (1/6-em)]](https://www.rsc.org/images/entities/char_2009.gif) ν was observed (Fig. 5) following the next equation:
ν was observed (Fig. 5) following the next equation:
EP (V) = 0.06![[thin space (1/6-em)]](https://www.rsc.org/images/entities/char_2009.gif) log log![[thin space (1/6-em)]](https://www.rsc.org/images/entities/char_2009.gif) ν (V s−1) + 0.682 (r = 0.9929) ν (V s−1) + 0.682 (r = 0.9929) |
According to Laviron equation;44 a relationship between the potential and the scan rate; the number of electron (n) transferred in the rate limiting step can be deduced from the following equation:
| Slope = 2.303RT/αnF |
![[thin space (1/6-em)]](https://www.rsc.org/images/entities/char_2009.gif) ν plot, which was found to be 0.06 and αn value was calculated as 1.05. In case of totally irreversible reactions, it has been reported29–31 that (α) equals 0.5; hence the number of electrons transferred in the oxidation process will be ∼2. These calculations agreed well with the reported values in the oxidation reaction of VEN.
ν plot, which was found to be 0.06 and αn value was calculated as 1.05. In case of totally irreversible reactions, it has been reported29–31 that (α) equals 0.5; hence the number of electrons transferred in the oxidation process will be ∼2. These calculations agreed well with the reported values in the oxidation reaction of VEN.
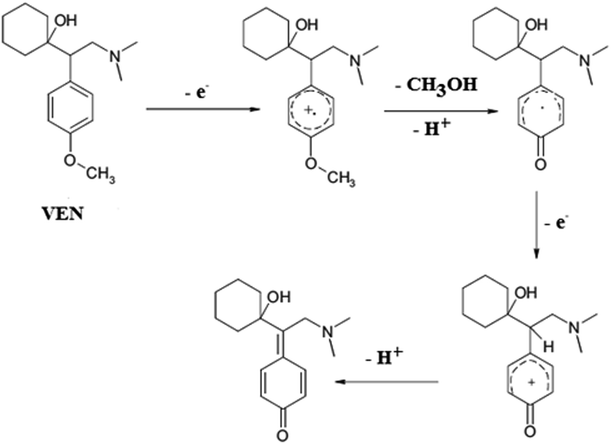
Since the electrochemical oxidation of VEN is known to occur by transferring two electrons, thus the number of protons involved was also predicted to be two. These results suggested that two electrons and two protons participated in the irreversible electrochemical oxidation of VEN on wet-NiCo2O4@rGO.29–31
Optimization of experimental and electrochemical parameters
Further optimization of buffer concentration was carried out using different concentrations ranged from 0.02 to 0.10 mol L−1. The best oxidation peak response was observed in the range from 0.04 to 0.08 mol L−1 BR buffer. Hence, 0.04 mol L−1 was selected as the best buffer concentration.
| Parameters | The calculated value |
|---|---|
| a Standard deviation of intercept. b Standard deviation of slope. c Limit of detection. d Limit of quantitation. e Relative standard deviation. f Mean values of three measurements at three different concentration levels. | |
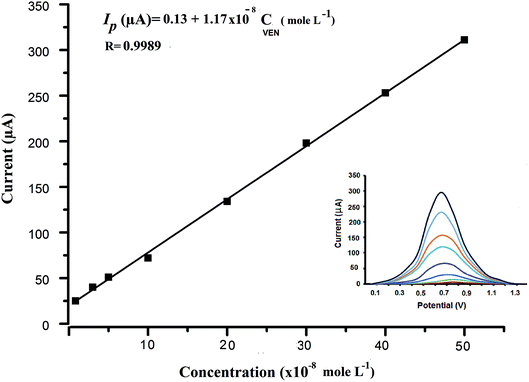
| Linearity range (×10−8 mol L−1) | 0.5–50 |
| Intercept (μA) ± SDa | 0.13 ± 0.121 |
| Slope (μA) ± SDb | 1.17 ± 0.312 |
| Correlation coefficient (R) | 0.9989 |
| LODc (×10−9 mol L−1) | 3.4 |
| LOQd (×10−9 mol L−1) | 10.3 |
| Intra-day precisione (%RSD) n = 3f | ≤2.55 |
| Inter-day precisione (%RSD) n = 3f | ≤2.97 |
| Concomitant substances | Ratio | Recovery% ± SDa |
|---|---|---|
VEN![[thin space (1/6-em)]](https://www.rsc.org/images/entities/char_2009.gif) : :![[thin space (1/6-em)]](https://www.rsc.org/images/entities/char_2009.gif) concomitant concomitant |
||
| a Average of three determinations. | ||
| Ascorbic acid | 1![[thin space (1/6-em)]](https://www.rsc.org/images/entities/char_2009.gif) : :![[thin space (1/6-em)]](https://www.rsc.org/images/entities/char_2009.gif) 10 10 |
96.6 ± 0.16 |
1![[thin space (1/6-em)]](https://www.rsc.org/images/entities/char_2009.gif) : :![[thin space (1/6-em)]](https://www.rsc.org/images/entities/char_2009.gif) 100 100 |
98.5 ± 0.76 | |
| Citric acid | 1![[thin space (1/6-em)]](https://www.rsc.org/images/entities/char_2009.gif) : :![[thin space (1/6-em)]](https://www.rsc.org/images/entities/char_2009.gif) 10 10 |
99.0 ± 0.72 |
1![[thin space (1/6-em)]](https://www.rsc.org/images/entities/char_2009.gif) : :![[thin space (1/6-em)]](https://www.rsc.org/images/entities/char_2009.gif) 100 100 |
103.2 ± 0.38 | |
| Starch | 1![[thin space (1/6-em)]](https://www.rsc.org/images/entities/char_2009.gif) : :![[thin space (1/6-em)]](https://www.rsc.org/images/entities/char_2009.gif) 10 10 |
98.6 ± 1.24 |
1![[thin space (1/6-em)]](https://www.rsc.org/images/entities/char_2009.gif) : :![[thin space (1/6-em)]](https://www.rsc.org/images/entities/char_2009.gif) 100 100 |
99.4 ± 0.92 | |
| Magnesium stearate | 1![[thin space (1/6-em)]](https://www.rsc.org/images/entities/char_2009.gif) : :![[thin space (1/6-em)]](https://www.rsc.org/images/entities/char_2009.gif) 10 10 |
101.5 ± 0.46 |
1![[thin space (1/6-em)]](https://www.rsc.org/images/entities/char_2009.gif) : :![[thin space (1/6-em)]](https://www.rsc.org/images/entities/char_2009.gif) 100 100 |
97.5 ± 0.97 | |
| Uric acid | 1![[thin space (1/6-em)]](https://www.rsc.org/images/entities/char_2009.gif) : :![[thin space (1/6-em)]](https://www.rsc.org/images/entities/char_2009.gif) 10 10 |
95.5 ± 1.22 |
1![[thin space (1/6-em)]](https://www.rsc.org/images/entities/char_2009.gif) : :![[thin space (1/6-em)]](https://www.rsc.org/images/entities/char_2009.gif) 100 100 |
96.4 ± 1.05 | |
| Glucose | 1![[thin space (1/6-em)]](https://www.rsc.org/images/entities/char_2009.gif) : :![[thin space (1/6-em)]](https://www.rsc.org/images/entities/char_2009.gif) 10 10 |
97.5 ± 0.37 |
1![[thin space (1/6-em)]](https://www.rsc.org/images/entities/char_2009.gif) : :![[thin space (1/6-em)]](https://www.rsc.org/images/entities/char_2009.gif) 100 100 |
97.8 ± 0.88 | |
| Sucrose | 1![[thin space (1/6-em)]](https://www.rsc.org/images/entities/char_2009.gif) : :![[thin space (1/6-em)]](https://www.rsc.org/images/entities/char_2009.gif) 10 10 |
97.9 ± 1.12 |
1![[thin space (1/6-em)]](https://www.rsc.org/images/entities/char_2009.gif) : :![[thin space (1/6-em)]](https://www.rsc.org/images/entities/char_2009.gif) 100 100 |
98.1 ± 0.53 | |
Application of the proposed method
| Drug | Labeled content (mg) | Recoverya (%) ± SD | F-Testc value | t-Testc value | |
|---|---|---|---|---|---|
| Proposed method | Reportedb method | ||||
| a Average of 5 determinations. b Ref. 23. c Theoretical values at 95% confidence level, t-value = 3.182 and F-value = 2.36, respectively. | |||||
| Venlaxin® | 75 | 96.7 ± 1.2 | 97.4 ± 1.6 | 2.346 | 0.634 |
| Venllamash® | 75 | 97.4 ± 1.5 | 98.6 ± 1.3 | 1.126 | 0.279 |
In order to study the repeatability and reproducibility, the RSD of six repetitive measurements of 20 × 10−8 M VEN using the same modified electrode was found to be 1.57%. Additionally, six modified electrodes were prepared and used for determination of 20 × 10−8 M VEN. The RSD was calculated and found to be 2.38%. These results indicate that the developed electrode has high repeatability and reproducibility in synthesis procedure and voltammetric quantitation.
Comparison of the proposed with previously reported methods
Table 5 shows a comparison between the analytical behavior of the proposed method and the previously reported methods for quantitation of VEN either in pharmaceutical dosage forms or in biological fluids. As shown, the proposed method has a large advantage over the reported methods considering linearity range, and LOD values. Additionally, using PGE provides another advantage of the proposed method, in terms of its simplicity, high electrochemical reactivity, cost effective and more environmentally friendly electrode.| Electrode | Linearity working range | LOD (mol L −1) | Ref. |
|---|---|---|---|
| Mercury film microelectrode | 1.27 × 10⁻⁶ to 24.3 × 10⁻⁶ | 6.93 × 10⁻⁷ | 27 |
| Hanging mercury drop electrode (HMDE) | 3.58 × 10⁻⁷ to 6.48 × 10⁻⁶ | 3.58 × 10⁻⁷ | 28 |
| Multi-walled carbon nanotubes | 10 × 10−6 to 500 × 10−6 | 4.70 × 10⁻⁷ | 29 |
| NAF-CNT-GCE | 3.81 × 10⁻⁸ to 6.22 × 10⁻⁵ | 1.24 × 10⁻⁸ | 30 |
| Multiwall carbon nanotubes-ionic liquid gel modified GCE | 2.0 × 10⁻⁶ to 2.0 × 10⁻³ | 1.69 × 10⁻⁶ | 31 |
| NiCo2O4@rGO modified PGE electrode | 5 × 10⁻⁹ to 500 × 10−9 | 3.40 × 10⁻⁹ | The present work |
Conclusion
In the present work, a comparative study using two different deposition approaches for synthesis of NiCo2O4@rGO modified graphite electrode was developed. The differences between the two modified electrodes, wet-NiCo2O4@rGO and in situ-NiCo2O4@rGO modified electrodes were characterized by various techniques; cyclic voltammetry (CV), electrochemical impedance spectroscopy (EIS), scanning electron microscopy (SEM) techniques and Raman spectroscopy. The wet-NiCo2O4@rGO modified electrode is considered an easy and excellent sensing tool to be utilized for voltammetric determination of VEN, an antidepressant drug. In addition, different electrochemical parameters were studied and optimized. The SWV method was validated according to ICH guidelines and showed higher sensitivity (LOD = 3.4 nmol L−1) with high precision (% RSD < 2.97). The proposed method was successfully applied to determine VEN in pharmaceutical formulation and in human plasma. No interference from matrix of real samples was observed. The developed electrode presented excellent stability and reproducibility. Bimetallic microspheres hybrid with a highly conductive reduced graphene oxide (wet-NiCo2O4@rGO) probe is considered a selective and sensitive tool for trace analysis of VEN in different matrices.Conflicts of interest
The authors declare that there is no conflict of interest.References
- S. M. Holliday and P. Benfield, Drugs, 1995, 49, 280 CrossRef CAS.
- W. A. Morton, S. C. Sonne and M. A. Verga, Ann. Pharmacother., 1995, 29, 387 CrossRef CAS.
- G. M. Bosse, H. A. Spiller and A. M. Collins, J. Med. Toxicol., 2008, 4, 18 CrossRef.
- S. K. Dubey, R. N. Saha, H. Jangala and S. Pasha, J. Pharm. Anal., 2013, 3, 466 CrossRef.
- L. Peikova, I. Pencheva and V. Maslarska, Pharmacia, 2013, 60, 12 CAS.
- B. K. Rao, K. R. Manjula, K. S. Babu and C. Rambabu, Pharma Chem., 2015, 7, 247 CAS.
- U. K. Chhalotiya, H. B. Patel and K. K. Bhatt, Indian J. Pharm. Sci., 2010, 72, 814 CrossRef CAS PubMed.
- R. Sekar, M. K. Siddaiah, N. M. Joghee and S. Bhojraj, Transl. Clin. Pharmacol., 2014, 22, 35 CrossRef.
- M. Younus, M. F. Arif, M. P. Richards and D. Bharat Kumar, Trop. J. Pharm. Res., 2015, 14, 239 CrossRef.
- C. S. Srinivas, P. R. Devi and G. Vijayakumar, Int. J. Adv. Pharm. Sci., 2010, 1, 177 Search PubMed.
- H. Kang, M. Kang, H. Kim, Y. Park, S. Kim and J. Kang, Transl. Clin. Pharmacol., 2014, 22, 35 CrossRef.
- V. Somasekhar, D. Gowrisankar and H. N. Shivakumar, E-J. Chem., 2009, 6, 1091 CrossRef CAS.
- V. K. Redasani, J. Anal. Pharm. Res., 2017, 4, 400103 Search PubMed.
- S. C. Daswadkar, V. N. Gajale, C. D. Shevkar, G. A. Phadtare, C. S. Sonawane and D. Y. P. College, Int. J. Appl. Pharm. Biol. Res., 2017, 2, 28 CAS.
- M. M. Eswarudu, World J. Pharm. Pharm. Sci., 2017, 6, 1292 CAS.
- M. J. R. Sundaraganapathy, S. A. Thangadurai and U. U. Subasini, International Journal of Pharmacy and Industrial Research, 2011, 1, 28 Search PubMed.
- N. A. Karani and P. Pingale, J. Pharm. Res., 2009, 2, 1246 CAS.
- D. Kumar, J. Debata, P. Yalamanchili and A. Goje, Int. J. Drug Dev. Res., 2013, 5, 133 Search PubMed.
- B. A. Pakhale, D. M. Shinkar and R. B. Saudagar, Int. J. Pharma Sci. Res., 2015, 6, 66 CAS.
- H. Pathan, S. Baokar and U. Santosh, Rasayan J. Chem., 2009, 2, 276 Search PubMed.
- C. Sowmya, Y. P. Reddy, M. K. Kumar and M. S. Raja, Int. J. Chem. Sci., 2011, 9, 52 Search PubMed.
- K. P. C. Vimal, D. Shirvi and G. Vijaya Kumar, Int. J. PharmTech Res., 2010, 2, 572 Search PubMed.
- L. Du, X. Wei, X. Lei, L. Wang, Q. Gong and X. Wang, Anal. Methods, 2014, 6, 1108 RSC.
- H. H. Ardeshna, M. R. Moradiya, P. A. Shah, R. S. Nakrani, K. G. Patel and T. R. Gandhi, Pharma Chem., 2012, 4, 1956 CAS.
- M. A. Bortoleto, M. Z. Bocato, M. T. Pupo, C. M. Gaitanib and A. R. M. Oliveira, J. Braz. Chem. Soc., 2015, 26, 1956 CAS.
- N. C. Purdel, D. Bălălău, M. Ilie and C. C. Aramă, Farmacia, 2010, 58, 62 CAS.
- S. Morais, C. P. M. C. A. Ryckaert and C. Delerue-Matos, Anal. Lett., 2003, 36, 2515 CrossRef CAS.
- P. Qiu, C. Liu, D. Lin and G. Zeng, Asian J. Chem., 2013, 25, 8943 CrossRef CAS.
- E. Eslami and F. Farjami, Journal of Applied Chemical Research, 2018, 12, 42 Search PubMed.
- B. J. Sanghavi and A. K. Srivastava, Electrochim. Acta, 2011, 56, 4188 CrossRef CAS.
- L. Ding, L. Li, W. You, Z.-N. Gao and T.-L. Yang, Croat. Chem. Acta, 2015, 88, 81 CrossRef CAS.
- M. R. El-Zahry and M. F. B. Ali, RSC Adv., 2019, 9, 7136 RSC.
- M. R. El-Zahry, Talanta, 2018, 186, 229 CrossRef CAS.
- F. M. Abdel-aal and M. F. B. Ali, J. Electrochem. Soc., 2017, 164, H1053 CrossRef CAS.
- E. Umeshbabu, G. Rajeshkhanna, P. Justin and G. R. Rao, J. Solid State Electrochem., 2016, 20, 2725 CrossRef CAS.
- G. Zhang, B. Y. Xia, X. Wang and X. W. Lou, Adv. Mater., 2014, 26, 2408 CrossRef CAS.
- A. Z. Wilczewska, K. Niemirowicz, K. H. Markiewicz and H. Car, Pharmacol. Rep., 2012, 64, 1020 CrossRef CAS.
- N. I. Zaaba, K. L. Foo, U. Hashim, S. J. Tan, W. W. Liu and C. H. Voon, Procedia Eng., 2017, 184, 469 CrossRef CAS.
- S. Sakthinathan, T. Kokulnathan, S.-M. Chen, R. Karthik and T.-W. Chiu, Inorg. Chem. Front., 2018, 5, 490 RSC.
- S. Sakthinathan, S. Kubendhiran, S.-M. Chen, S. Karuppiah and T.-W. Chiu, J. Phys. Chem. C, 2017, 121, 14096 CrossRef CAS.
- Y. Bai, M. Liu, J. Sun and L. Gao, Ionics, 2016, 22, 535 CrossRef CAS.
- M. R. El-Zahry, I. H. Refaat, H. A. Mohamed and B. Lendl, Anal. Bioanal. Chem., 2016, 408, 4733 CrossRef CAS.
- A. J. Bard, and L. R. Faulkner, Electrochemical Methods: Fundamentals and Applications, John Wiley & Sons, New York, 2nd edn, 2001 Search PubMed.
- E. Laviron, J. Electroanal. Chem., 1979, 101, 19 CrossRef CAS.
- International Conference on Harmonization (ICH), Q2 (R1): Validation of Analytical Procedure: Text and Methodology, 2005 Search PubMed.
| This journal is © The Royal Society of Chemistry 2019 |

