 Open Access Article
Structure, optical simulation and thermal stability of the HfB2-based high-temperature solar selective absorbing coatings
Xiao-Li Qiuab,
Xiang-Hu Gao*a,
Cheng-Yu Hea,
Bao-Hui Chenc and
Gang Liu *ab
*ab
aResearch and Development Center for Eco-Chemistry and Eco-Materials, State Key Laboratory of Solid Lubrication, Lanzhou Institute of Chemical Physics, Chinese Academy of Sciences, Lanzhou 730000, China. E-mail: gangliu@licp.cas.cn; gaoxh@licp.cas.cn
bCenter of Materials Science and Optoelectronics Engineering, University of Chinese Academy of Sciences, Beijing 100049, China
cState Key Laboratory of Disaster Prevention & Reduction for Power Grid Transmission and Distribution Equipment, Changsha 410007, China
First published on 19th September 2019
Abstract
Transition metal borides are a kind of potential materials for high-temperature solar thermal applications. In this work, a novel SS/HfB2/Al2O3 tandem absorber was prepared, which exhibited high solar spectrum selectivity (α/ε) of 0.920/0.109. The optical constants of the coating were obtained using spectroscopic ellipsometry, and the dispersion model of the HfB2 layer was modeled with the Tauc–Lorentz dispersion formula. In addition, the reflectance spectrum simulated by the CODE software corroborated well with the experimental results. The thermal stability test indicated that the HfB2/Al2O3 solar absorber coating was thermally stable in vacuum at 600 °C for 2 h. When extending the annealing time to 100 h, the coating could maintain high spectral selectivity after aging at 500 °C irrespective of whether in air or vacuum. All these results indicate that the coating has good solar selectivity and is a promising candidate for high-temperature solar thermal applications.
1. Introduction
Solar energy resources are quite affluent. The radiant energy received by the earth's surface from the sun is as much as 90![[thin space (1/6-em)]](https://www.rsc.org/images/entities/char_2009.gif) 000 TW, which is equivalent to burning 5.0 × 10⁶ tons of coal. Collecting and storing solar energy have become urgent in the global effort in the reinforcement of environmentally sustainable development.1,2 In the solar energy photothermal conversion field, the solar spectral selective absorbing coatings (SSACs) are the key devices of the solar collector. A high-quality SSAC is necessary to improve the efficiency of solar energy photothermal conversion. The SSAC is essentially an optical film, which requires high absorptance and low emittance.3,4 The absorption mechanism of SSAC strongly depends on the macroscopic and microscopic physical properties for a solid thin film. Optical constants (refractive index n and extinction coefficient k) are essentially important parameters to understand the optical properties of the materials. For example, the extinction coefficient, k, represents the absorption of a material, and a low extinction coefficient indicates low absorption.5
000 TW, which is equivalent to burning 5.0 × 10⁶ tons of coal. Collecting and storing solar energy have become urgent in the global effort in the reinforcement of environmentally sustainable development.1,2 In the solar energy photothermal conversion field, the solar spectral selective absorbing coatings (SSACs) are the key devices of the solar collector. A high-quality SSAC is necessary to improve the efficiency of solar energy photothermal conversion. The SSAC is essentially an optical film, which requires high absorptance and low emittance.3,4 The absorption mechanism of SSAC strongly depends on the macroscopic and microscopic physical properties for a solid thin film. Optical constants (refractive index n and extinction coefficient k) are essentially important parameters to understand the optical properties of the materials. For example, the extinction coefficient, k, represents the absorption of a material, and a low extinction coefficient indicates low absorption.5
Hafnium diboride (HfB2) is a kind of transition metal boride, which has a high melting temperature, high heat resistance, and electrical conductivity.6,7 Most importantly, HfB2 has also been proven to have intrinsic spectral selectivity because the density of free electrons in the d band of the Hf element in HfB2 can be controlled to affect the optical properties.8–10 Due to these unique capabilities, HfB2 is a candidate for high-temperature SSAC applications. A small number of reports focus on the HfB2 material for solar receivers in a solar tower plant. Diletta Sciti et al. prepared bulk HfB2 for novel sunlight absorbers in solar tower plant, which exhibited the value of α/ε = 2.5 at T = 1400 K.11 E. Sani et al. reported that the emittance for bulk HfB2 was around 0.4 at temperatures between 1300 and 1450 K. When the thermal temperature increased to 1636 K, the maximum measured emittance value of HfB2 was as low as 0.47.12,13 They also confirmed that the content of secondary phases affected either the mechanical performance or the optical behavior of HfB2.14 Recently, Clara Musa et al. prepared SiC–HfB2 (HBS) and HfB2–HfC–SiC (HBCS) by the reactive spark plasma sintering technique (R-SPS). They found that the addition of SiC to HfB2 (HBS) could increase solar absorbance slightly, and the value of α/ε (2.75) for HBCS surpassed that of pure boride.9 Despite these advances in HfB2, its structure, thermal stability, and optical properties are, to the best of our knowledge, totally unexplored as far as the HfB2 film for the present high-temperature SSAC applications is concerned.
Here, we reported novel SS/HfB2/Al2O3 SSAC. This tandem absorber coating essentially consisted of an absorber layer (HfB2) and an anti-reflective layer (Al2O3). First, the structural, chemical and optical properties of the coating were studied. Second, the optical simulation was successfully investigated by phase modulated spectroscopic ellipsometry (SE) and a CODE commercial optical simulation software. Finally, the details of the thermal stability in vacuum and air were discussed.
2. Experimental details
A magnetron sputtering system (Kurt J. Lesker, USA) was used to deposit the HfB2/Al2O3 coatings. The polished stainless steel (SS, model 316) was used as the substrate, and its dimensions were 50 mm × 50 mm × 1 mm. Before sputtering, the base pressure in the vacuum chamber was evacuated to 4.655 × 10⁻⁴ Pa. The HfB2 absorber layer was deposited by direct current (DC) magnetron sputtering using a high-purity HfB2 target (99.99%, diameter = 76.2 mm), while the Al2O3 layer was deposited by radio frequency (RF) magnetron sputtering using a high-purity Al2O3 target (99.99%, diameter = 76.2 mm). All the coatings were deposited on a substrate with a temperature of 200 °C. The details of the deposition parameters of each layer are listed in Table 1. Furthermore, the same experimental processes and parameters were used to deposit the HfB2/Al2O3 coatings on the Si substrate for measuring the optical constants.| Parameters | Value |
|---|---|
| Substrate | SS and Si |
| Substrate temperature (°C) | 200 |
| Target material | HfB2 and Al2O3 |
| Ar flow rate (sccm) | 33 |
| Operating pressure (Pa) | 1.03 |
| Sputtering method of HfB2 layer | DC |
| Sputtering method of Al2O3 layer | RF |
| HfB2 target power density (W cm−2) | 3.29 |
| Al2O3 target power density (W cm−2) | 5.48 |
The morphologies of the as-deposited and annealed SS/HfB2/Al2O3 coatings were studied by scanning electron microscopy (SEM, SU8200, Tokyo, Japan). The high-resolution transmission electron microscopy (HR-TEM) image was obtained on Tecnai G2 F20 S-TWIN. X-ray photoelectron spectroscopy (XPS) of Hf, B, O and Al was conducted on ESCALAB 210 (VG Scientific Ltd., UK). Raman spectra were recorded in the range of 150–1000 cm−1 using a confocal-micro-Raman technique (LabRAM HR Evolution, HORIBA Jobin Yvon S.A.S., French) at room temperature with an excitation of 532 nm laser light. Spectral reflectance in the wavelength range of 0.3–2.5 μm was measured with a PerkinElmer Lambda 950 UV/vis/NIR spectrometer with an integration sphere (module 150 mm), while the wavelength interval of 2.5–20 μm was obtained on a Bruker TENSOR 27 FT-IR spectrometer equipped with an integrating sphere (A562-G/Q) using a gold plate as a standard for diffuse reflectance. The calculation method of absorptance (α) and emittance (ε) was reported in a previous work.15
The coatings were annealed in a resistive tube (Hefei Kejing Materials Technology Co., Ltd, China) to test the thermal stability at the temperature range of 400–700 °C for 2 h with a pressure of 5.0 × 10⁻¹ Pa. Similarly, the long-term thermal stability of the coatings in vacuum and air was investigated for 100 h from room temperature to the desired temperature. The coatings were naturally cooled down in the furnace after annealing.
A spectroscopic phase modulated ellipsometer (HORIBA Jobin Yvon, France) was used to measure the optical constants of the single HfB2 coatings. The range of the measured optical wavelength was 300–2060 nm, and the incidence angle was 70°. The CODE software was used to simulate the reflectance spectra of the coating.16
3. Results and discussion
3.1 Coating structure and spectral selectivity
Fig. 1(a) displays the schematic diagram of SS/HfB2/Al2O3 SSAC. The TEM cross-section image of HfB2/Al2O3 SSAC is shown in Fig. 1(b). The upper Al2O3 acted as an anti-reflective layer with a thickness of 59.5 nm, and the bottom HfB2 acted as an absorber layer with a thickness of 48.5 nm. The HR-TEM images of the HfB2 and Al2O3 layers revealed that each layer was amorphous (Fig. 1(a and d)).Fig. 1(e) shows the reflectance spectra of the SS substrates, SS/HfB2 coatings, and SS/HfB2/Al2O3 coatings. The reflectance spectra of SSAC usually show local maxima (Rmax) and minima (Rmin) in order to achieve spectral selectivity. The reflectance spectrum of SS/HfB2 showed Rmin at λ = 800 nm, which resulted in a value of α/ε = 0.731/0.110. After depositing the Al2O3 layer, two reflectance minima were observed at λ = 502 nm and λ = 800 nm, which were caused by the interference effect at the interface between layers.17,18 The optimized SS/HfB2/Al2O3 coating exhibited a value of α/ε = 0.920/0.109. Clearly, the Al2O3 layer greatly improves the solar absorptance and works as the antireflection layer.
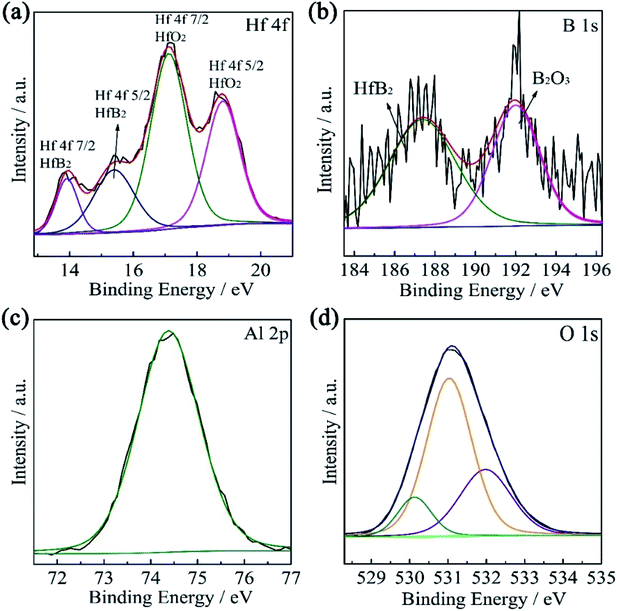
The high-resolution XPS spectra with the fitting curves of Hf 4f (7/2, 5/2), B 1s, O 1s, and Al 2p for solar absorber coatings are shown in Fig. 2. The Hf 4f spectrum (Fig. 2(a)) consists of four peaks. The peaks centered at 14.0 eV and 15.4 eV can be assigned to Hf 4f7/2 and Hf 4f5/2 of HfB2, respectively, while the higher intensity peaks at 17.1 eV and 18.8 eV correspond to Hf 4f7/2 and Hf 4f5/2 of HfO2.19 The B 1s spectrum (Fig. 2(b)) of the single HfB2 coating consists of two peaks. The peak at 192.1 eV belongs to the B–O bonds of B2O3, and the peak at 187.0 eV belongs to the B–Hf bonds of HfB2. Generally speaking, the B element exhibits stronger affinity for oxygen. The heat of formation for HfO2 and B2O3 was strongly according to the following reaction:
| HfB2 + 5/2O2 → HfO2 + B2O3 |
 | ||
| Fig. 2 High-resolution XPS spectra of (a) Hf 4f and (b) B 1s for the single HfB2 layer and (c) Al 2p and (d) O 1s for the top Al2O3 layer. | ||
The reaction is favorable at all temperatures with ∇Gorxn = −2003 + 0.374 (kJ).6
Fig. 2(c) shows the Al 2p spectrum of the Al2O3 coating. A single peak centered at 74.4 eV corresponds to Al2O3. Fig. 2(d) shows the O 1s spectrum, where the peaks centered at 531.4 and 532.1 eV are assigned to the characteristics of Al2O3, and the peak centered at 530.7 eV belongs to the crystal lattice oxygen (O–Al).20,21
3.2 Optical simulation
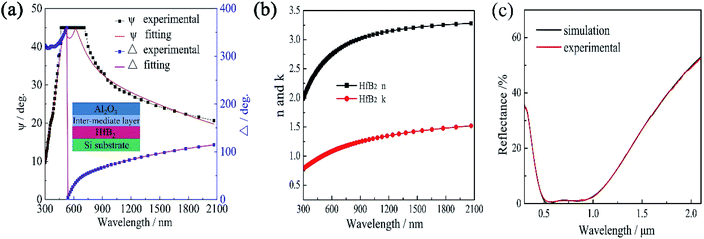
Generally, the optical constants of films are very different from those of the bulk materials, which strongly depend on the preparation method. Spectroscopic ellipsometry (SE) is an important method for investigating the optical constants of thin films.22,23 Fig. 3(a) shows the ellipsometric angle (ψ and Δ) spectra measured by SE for the HfB2/Al2O3 coating. The experimental spectra were fitted with a three-layer model. The parameters of the top Al2O3 layer were obtained from the database of the DP2 software. The bottom HfB2 layer was modeled using the Tauc–Lorentz oscillator model because this oscillator model is very effective in the characterization of amorphous materials. In addition, the intermixed layer between HfB2 and Al2O3 was inevitable in the magnetron sputtering process. Hence, an intermediate layer containing 50% HfB2 and 50% Al2O3 was chosen by optimising the composition. The spectra showed great agreement between the experimental value and the theoretical value of (ψ, Δ). The fitting degree of the theoretical value and the experimental value was expressed by χ2.24 In this fitting process, χ2 = 2.39, and the thickness of each layer was HfB2 (59 nm)/intermediate layer (3 nm)/Al2O3 (46 nm).The formula of the Tauc–Lorentz oscillator model was based on the Tauc expression and the Lorentz oscillator model. The imaginary part of the function is as follows:
 | (1) |
The real part ε1 was determined from ε2 with the Kramers–Kronig relation:
 | (2) |
| Parameters | Value |
|---|---|
| The energy band gap Eg | 0.101 |
| The peak in the joint density of states E0 | 4.526 |
| The high frequency dielectric constant ε∞ | 1.479 |
| The optical transition matrix elements A | 5.260 |
| Broadening factor C | −3.815 |
The relationship between the reflectance of the thin film and optical constant is as follows:
 | (3) |
To simulate the reflectance spectrum of the coating, n, k and thickness of the HfB2 layer and the Al2O3 layer were introduced, and the simulated reflectance spectrum is displayed in Fig. 3(c). In addition, the fitting parameters of the SS substrates were obtained from our previous work.26 The schematic diagram in the inset of Fig. 3(a) was assumed for simulating the model of the coating. The fit deviation between the simulation and experimental data was 0.00000543, which showed great agreement. This work also confirms that the optical constants obtained from spectroscopic ellipsometry are valid.
3.3 Thermal stability
The SS/HfB2/Al2O3 SSAC materials were annealed in vacuum for 2 h at 400–700 °C to test their thermal stability. Fig. 4 shows the surface micro-morphologies of the as-deposited samples and annealed samples. The surface of the as-deposited coating exhibited a homogeneous structure (Fig. 4(a)). Fig. 4(b–d) show that there is no obvious change in the surface morphologies at a temperature within the range of 400–600 °C. However, when the samples were annealed in vacuum at 700 °C, the size of the grain on the surface increased (Fig. 4(e)). The SEM results indicate that the micro-morphologies of the coating have an excellent thermal stability at 600 °C for 2 h.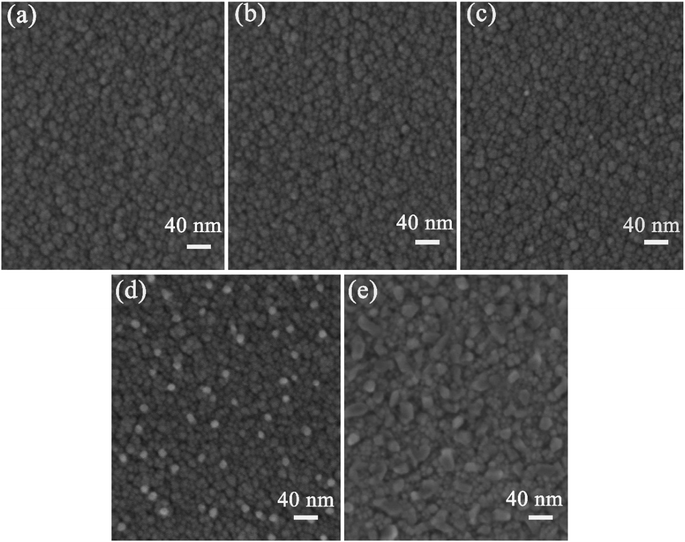 | ||
| Fig. 4 Surface SEM images of the (a) as-deposited coatings and the coatings annealed at (b) 400 °C, (c) 500 °C, (d) 600 °C and (e) 700 °C for 2 h in vacuum. | ||
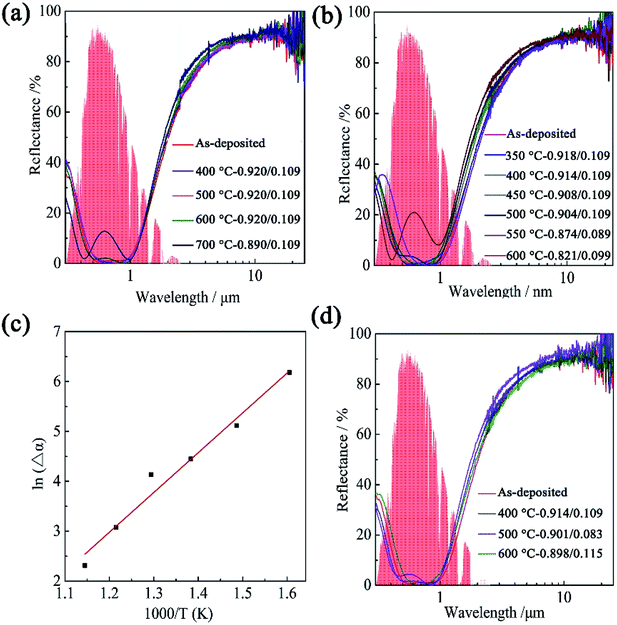
The reflectance spectra of the SS/HfB2/Al2O3 coatings, which were annealed in vacuum for 2 h, are shown in Fig. 5(a). The reflectance spectra of the 400–600 °C annealed coatings were similar to that of the as-deposited coating as the wavelength increased, and the values of α and ε did not show any changes (Δα = 0, Δε = 0). As the temperature increases to 700 °C, the reflectance spectrum shows two local Rmin values at λ = 410 nm and λ = 800 nm as well as a local reflectance maximum (Rmax) at λ = 670 nm, which indicate that the coating starts to degrade (Δα = 0.03, Δε = 0).27
Long-term thermal stability of SSAC is another crucial performance index for solar thermal power generation applications. To test this performance, the samples were annealed in vacuum for 100 h at different temperatures (350–600 °C). Fig. 5(b) shows the corresponding reflectance spectra. It is clear that the absorptance of the coatings gradually degrades with the increase in the annealing temperature. When the heat-treatment temperature was higher than 500 °C, the absorptance of the coating dropped below 0.9, and the Rmin and Rmax values in the reflectance spectra showed a significant change.
The activation energy (Eg) of the coatings annealed at 350–600 °C for 100 h was calculated by the Arrhenius equation:
 | (4) |
The coatings were also annealed in air for 100 h at different temperatures. Fig. 5(d) displays long-term thermal stability in air by using reflectance spectra at the wavelength of 0.3–25 μm. There was a negligible change in the reflectance spectrum at 400 °C. However, at 500 °C, local Rmax appeared in the reflectance spectrum at λ = 570 nm (Δα = −0.019, Δε = −0.026). When the annealing temperature was increased to 600 °C, a slight redshift of Rmin was observed from λ = 502 nm to λ = 616 nm, and the value of α/ε of the coating was 0.898/0.116. This value indicates that the coating has better thermal stability in air, which is suitable for high-temperature selective solar absorption applications.
3.4 Thermal aging mechanism after air annealing
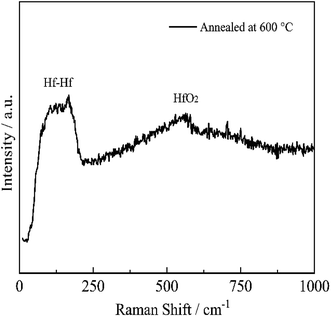
In order to investigate the failure mechanism of the coating at high temperatures, the microstructure of HfB2/Al2O3 SSAC after annealing was analyzed using micro-Raman spectrometry. The Raman spectra of the coatings annealed at 600 °C in air are shown in Fig. 6. The bands centered at 100–175 cm−1 and 552 cm−1 are observed, which originate from the vibrations of HfO2.28 The atomic (Hf, O) contribution for each normal mode for HfO2 is listed in Table 3. Considering the Raman spectrum, we can confirm that the formation of HfO2 leads to the degradation of optical properties.| Raman frequency28 (cm−1) | Hf (%) | O (%) | Experimental values of this work (cm−1) |
|---|---|---|---|
| 113 | 30 | 70 | 100–175 |
| 133 | 95 | 5 | |
| 133 | 74 | 26 | |
| 149 | 99 | 1 | |
| 164 | 99 | 1 | |
| 551 | 2 | 98 | 552 |
Ellipsometry was also used to investigate HfB2/Al2O3 SSAC after annealing at 600 °C in air, which was deposited on the Si substrate by magnetron sputtering. The detailed experimental parameters of the involved layer were the same as those of the single layer, as mentioned above, and the ellipsometric spectra are shown in Fig. 7. Based on the Raman spectra of the 600 °C-annealed coating, a three-layer model was established, which is shown in the inset of Fig. 7(a). The dispersion model of the HfB2–HfO2 layer was modeled with the Tauc–Lorentz dispersion formula, and the doped layer contained 70% HfO2 and 30% HfB2. The Lorentz oscillators were used to describe the optical functions of the Al2O3 layers. The experimental ellipsometric angle ψ and Δ of the tandem absorber coating were best fitted with the theoretical spectra, as shown in Fig. 7(a). In this fitting process, χ2 was 2.3. The thicknesses of the HfB2–HfO2 layer, intermediate layer, and Al2O3 layer were 59 nm, 3 nm, and 46 nm, respectively. The n and k values of the absorber layer obtained from the ellipsometric spectra of the annealed coating are shown in Fig. 7(b). Table 4 shows the optical constants of the absorber layers at a reference wavelength of 550 nm. The n and k values of the absorber layer were lower than those of the pristine absorber coating. This result indicated that the composition of the coatings changed after annealing at 600 °C in air, which was caused by the oxidation of HfB2.
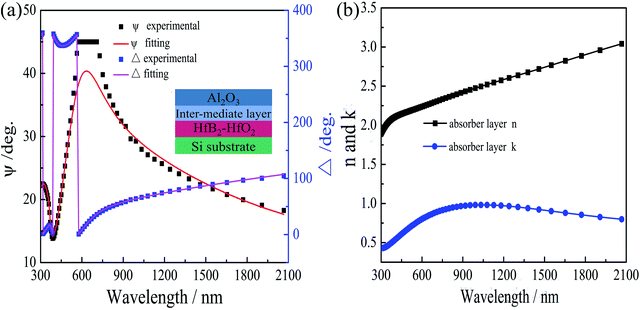 | ||
| Fig. 7 (a) Experimental and theoretical ellipsometric ψ and Δ spectra for the 600 °C annealed coating. (b) The n and k values for the absorber for the 600 °C annealed coating. | ||
| Layer | As-deposited coating | Annealed at 600 °C in air | ||
|---|---|---|---|---|
| n | k | n | k | |
| Absorber layer | 2.68 | 1.04 | 2.19 | 0.73 |
4. Conclusions
A novel SS/HfB2/Al2O3 tandem absorber was prepared, which exhibited high solar spectrum selectivity (α/ε) of 0.920/0.109. The high optical constants of the HfB2 layers measured from SE clearly revealed that the HfB2 layer was the main absorber layer. The CODE optical simulation program was used to simulate the reflectance spectra of SS/HfB2/Al2O3 SSAC, and the deviation between the simulation and experimental data was 0.00000543. The thermal stability test indicated that the HfB2/Al2O3 absorber coating was thermally stable in vacuum at 600 °C for 2 h. After extending the annealing time to 100 h, the coating could maintain high spectral selectivity after aging at 500 °C irrespective of whether in air or vacuum. The thermal stability test in vacuum for 100 h also indicated that the activation energy of the SS/HfB2/Al2O3 coating was about 66.31 kJ mol−1.Conflicts of interest
There are no conflicts to declare.Acknowledgements
This work was financially supported by the Youth Innovation Promotion Association CAS (2018455), the Key Research & Development Program in Gansu Province (18YF1GA125), the National Natural Science Foundation of China (No. 51402315), Major Subject of State Grid Corporation of China (No. 5216A01600W0).References
- F. Cao, K. McEnaney, G. Chen and Z. Ren, Energy Environ. Sci., 2014, 7, 1615–1627 RSC
.
- S. K. Sansaniwal, V. Sharma and J. Mathur, Renewable Sustainable Energy Rev., 2018, 82, 1576–1601 CrossRef
.
- N. Selvakumar and H. C. Barshilia, Sol. Energy Mater. Sol. Cells, 2012, 98, 1–23 CrossRef CAS
.
- X.-H. Gao, Z.-M. Guo, Q.-F. Geng, P.-J. Ma, A.-Q. Wang and G. Liu, Sol. Energy Mater. Sol. Cells, 2017, 163, 91–97 CrossRef CAS
.
- K. Hans, S. Latha, P. Bera and H. C. Barshilia, Sol. Energy Mater. Sol. Cells, 2018, 185, 1–7 CrossRef CAS
.
- W. G. Fahrenholtz, G. E. Hilmas, I. G. Talmy and J. A. Zaykoski, J. Am. Ceram. Soc., 2007, 90, 1347–1364 CrossRef CAS
.
- J. Zou, S. Grasso, L.-F. Liu, H.-B. Ma, M. Reece and J. Binner, Scr. Mater., 2018, 156, 115–119 CrossRef CAS
.
- E. Sani, L. Mercatelli, J.-L. Sans, L. Silvestroni and D. Sciti, Opt. Mater., 2013, 36, 163–168 CrossRef CAS
.
- C. Musa, R. Licheri, R. Orrù, G. Cao, A. Balbo, F. Zanotto, L. Mercatelli and E. Sani, Sol. Energy, 2018, 169, 111–119 CrossRef CAS
.
- N. Selvakumar, N. T. Manikandanath, A. Biswas and H. C. Barshilia, Sol. Energy Mater. Sol. Cells, 2012, 102, 86–92 CrossRef CAS
.
- D. Sciti, L. Silvestroni, L. Mercatelli, J.-L. Sans and E. Sani, Sol. Energy Mater. Sol. Cells, 2013, 109, 8–16 CrossRef CAS
.
- E. Sani, L. Mercatelli, D. Jafrancesco, J. L. Sans and D. Sciti, J. Eur. Opt. Soc. Rapid Publ., 2012, 7, 12052 Search PubMed
.
- E. Sani, M. Meucci, L. Mercatelli, D. Jafrancesco, J.-L. Sans, L. Silvestroni and D. Sciti, J. Photonics Energy, 2014, 4, 045599 CrossRef
.
- E. Sani, L. Mercatelli, M. Meucci, L. Silvestroni, A. Balbo and D. Sciti, Sol. Energy Mater. Sol. Cells, 2016, 155, 368–377 CrossRef CAS
.
- X.-H. Gao, Z.-M. Guo, Q.-F. Geng, P.-J. Ma, A.-Q. Wang and G. Liu, RSC Adv., 2016, 6, 63867–63873 RSC
.
- M. Theiss, Hard and Software for Optical Spectroscopy, Dr Bernhard-Klein-Str. 110 52078 Aachen, Germany, 2013 Search PubMed.
- J. Jyothi, H. Chaliyawala, G. Srinivas, H. S. Nagaraja and H. C. Barshilia, Sol. Energy Mater. Sol. Cells, 2015, 140, 209–216 CrossRef CAS
.
- W. Wang, H. Wen, S. Ling, Z. Li, J. Su and C. Wang, J. Mater. Chem. A, 2018, 6, 15690–15700 RSC
.
- C. Monticelli, A. Bellosi, F. Zucchi and M. Dal Colle, Electrochim. Acta, 2007, 52, 6943–6955 CrossRef CAS
.
- T. Schroeder, G. Lupina, O. Seifarth, M. Tallarida and D. Schmeißer, J. Appl. Phys., 2007, 102, 014103 CrossRef
.
- X.-H. Gao, Z.-M. Guo, Q.-F. Geng, P.-J. Ma, A.-Q. Wang and G. Liu, Sol. Energy Mater. Sol. Cells, 2017, 164, 63–69 CrossRef CAS
.
- T. W. H. Oates, H. Wormeester and H. Arwin, Prog. Surf. Sci., 2011, 86, 328–376 CrossRef CAS
.
- M. Rasheed and R. Barillé, J. Non-Cryst. Solids, 2017, 476, 1–14 CrossRef CAS
.
- A. Dana, H. C. Barshiliab, K. Chattopadhyay and B. Basu, Renewable Sustainable Energy Rev., 2017, 79, 1050–1077 CrossRef
.
- X.-H. Gao, W. Theiss, Y.-Q. Shen, P.-J. Ma and G. Liu, Sol. Energy Mater. Sol. Cells, 2017, 167, 150–156 CrossRef CAS
.
- X.-H. Gao, C.-B. Wang, Z.-M. Guo, Q.-F. Geng, W. Theiss and G. Liu, Opt. Mater., 2016, 58, 219–225 CrossRef CAS
.
- S. Zhao and E. Wackelgard, Sol. Energy Mater. Sol. Cells, 2006, 90, 243–261 CrossRef CAS
.
- C. W. Li, M. M. McKerns and B. Fultz, Phys. Rev. B, 2009, 80, 054304 CrossRef
.
| This journal is © The Royal Society of Chemistry 2019 |


