 Open Access Article
MoS2 nanotubes loaded with TiO2 nanoparticles for enhanced electrocatalytic hydrogen evolution†
Bo Fenga,
Chuntao Liu *ab,
Weiyi Yana,
Jianxin Genga and
Guimin Wanga
aSchool of Chemistry and Materials Science, Heilongjiang University, Harbin 150080, PR China. E-mail: liuct@hlju.edu.cn; liu_chuntao@163.com
bKey Laboratory of Chemical Engineering Process & Technology for High-efficiency Conversion, School of Chemistry and Materials Science, Heilongjiang University, Harbin 150080, PR China
First published on 23rd August 2019
Abstract
Efficient and stable non-precious metal catalysts composed of earth-abundant elements are crucial to the hydrogen evolution reaction (HER) in high-energy conversion efficiency. Herein, TiO2/MoS2-NTs catalyst, in which the MoS2 nanotubes were loaded with TiO2 nanoparticles, have been synthesized via a facile solvothermal and hydrothermal method. The as-prepared TiO2/MoS2-NTs electrocatalyst demonstrated enhanced electrocatalytic hydrogen evolution performance compared with MoS2-NTs. Electrochemical measurements reveal the overpotential and Tafel slope of as-prepared TiO2/MoS2-NTs are −0.21 V and 42 mV dec−1. The HER improvement is proposed to be attributed to the increased edge sites results from the interfaces and synergic effect between TiO2 nanoparticles and MoS2 nanotubes.
Introduction
The sustained and rapid development of human society has brought a growing demand for energy. Traditional fossil energy sources are difficult to meet green, healthy and sustainable energy development trends, their limited reserves and environmental pollution problems have stimulated extensive research on clean and renewable alternative energy.1 As a fuel, hydrogen possesses clean, renewable, portable properties and the highest energy density per unit mass among all chemical fuels, and has been considered to be an essential sustainable and environmentally-friendly energy source.2,3 There are currently three main technologies, including steam methane reforming, coal gasification and water electrolysis for industrial hydrogen production.4 Water electrolysis is an unquestionable clean way of energy utilization, since its feedstock is water—an abundant and renewable resource.5 It is critical to maximize the hydrogen evolution reaction (HER) efficiency by utilizing the excellent cathode catalysts. Platinum (Pt) and other precious metals are reported to be the most efficient HER electrocatalysts as their small overpotential and high electrocatalytic activity, whereas the high cost and relative scarcity of noble metals prohibit their practical application.6–8 Therefore, developing efficient and cheap non-precious metal HER catalysts composed of earth-abundant elements have a great significance on the electrocatalytic hydrogen production.9–12Molybdenum disulphide (MoS2), a typical layered structure with weak van der Waals interactions between individual sandwiched S–Mo–S layers, has been widely investigated as an efficient alternative to platinum for HER because of its promising electrochemical activity and abundant distribution.13–15 However, its HER performance is greatly limited by the insufficient active sites and intrinsic poor conductivity.16–19 On the basis of the above two key factors, extensive efforts have been devoted to the improvement of either the number of active sites or conductivity of MoS2 by cooperation with conductive materials and morphology optimization (controlling the synthesis of well-defined morphology with nanostructures) during the past few years.20–22 As is well-known that the characteristic surface morphology and/or microstructure of MoS2 manipulates the electron transport and electrolyte diffusion. MoS2 nanotubes (MoS2-NTs) were utilized widely because of more exposed edge sites and higher specific area for the HER.23–27 However, the overall HER activity is still limited as generally only a small fraction of edge sites contribute to the reaction rate.28–30 Titanium dioxide (TiO2) is rather inexpensive, relatively non-toxic, and excellent physical and chemical stability in acidic media.31–34 Most of the MoS2/TiO2 hetero-structures such as nanoflowerlike MoS2@TiO2 nanohybrids,35,36 TiO2 nanoparticles supported MoS2 nanosheet,37 TiO2/g-C3N4/MoS2 nanocomposites,38 MoS2/TiO2 thin film39,40 and TiO2@MoS2 nanotube array41 were used to improve the electrocatalytic hydrogen evolution activity and photocatalytic reaction. As for HER, loading TiO2 on MoS2 support cannot only activate the sites of MoS2 nanotubes, but also utilizes high mobility MoS2 frame as a bridge for charge transport.42
Herein, we demonstrate a facile solvothermal and hydrothermal method to load TiO2 nanoparticles onto MoS2-NTs for the HER. This electrocatalyst exhibited an onset overpotential of 140 mV, a Tafel slope of 42 mV dec−1, and an exchange current density of 32.4 μA cm−2. Electrochemical tests illustrated the catalytic efficiency is greatly improved by more edge sites results from the interfaces and synergic effect between TiO2 nanoparticles and MoS2 nanotubes.
Experimental section
Chemical and reagents
Sodium molybdate dihydrate (Na2MoO4·2H2O), thiourea ((NH2)2CS), tetrabutyltitanate (C16H36O4Ti), anhydrous ethanol, octylamine, nitric acid (HNO3) were purchased from Sinopharm Chemical Reagent Co. Ltd., China. All chemicals and reagents were used as received without further purification. All the chemicals are analytical reagents.Preparation of MoS2-NTs catalysts
MoS2-NTs were fabricated by a facile solvothermal method. In a typical synthesis, Na2MoO4·2H2O and (NH2)2CS (Mo/S molar ratio of 1![[thin space (1/6-em)]](https://www.rsc.org/images/entities/char_2009.gif) :
:![[thin space (1/6-em)]](https://www.rsc.org/images/entities/char_2009.gif) 4) were dissolved in 60 mL mixture of anhydrous ethanol/octylamine (v/v = 1
4) were dissolved in 60 mL mixture of anhydrous ethanol/octylamine (v/v = 1![[thin space (1/6-em)]](https://www.rsc.org/images/entities/char_2009.gif) :
:![[thin space (1/6-em)]](https://www.rsc.org/images/entities/char_2009.gif) 1) followed by stirring for about 30 min at room temperature to form a homogeneous solution. This solution was transferred into a 100 mL sealed Teflon-lined stainless steel autoclave and heated at 200 °C for 24 h in an electric oven. After the autoclave was cooled to room temperature naturally, the resulting black product was collected by centrifugation and washed repeatedly with deionized water and ethanol to remove ions and possible remnants. Finally, the MoS2-NTs were dried in a vacuum oven at 60 °C overnight before characterizations and further preparation.
1) followed by stirring for about 30 min at room temperature to form a homogeneous solution. This solution was transferred into a 100 mL sealed Teflon-lined stainless steel autoclave and heated at 200 °C for 24 h in an electric oven. After the autoclave was cooled to room temperature naturally, the resulting black product was collected by centrifugation and washed repeatedly with deionized water and ethanol to remove ions and possible remnants. Finally, the MoS2-NTs were dried in a vacuum oven at 60 °C overnight before characterizations and further preparation.
Preparation of TiO2/MoS2-NTs catalyst
TiO2/MoS2-NTs catalysts were prepared via a simple hydrothermal method. Briefly, 2 M HNO3 was initially added into 140 mL mixture of water/ethanol (v/v = 1![[thin space (1/6-em)]](https://www.rsc.org/images/entities/char_2009.gif) :
:![[thin space (1/6-em)]](https://www.rsc.org/images/entities/char_2009.gif) 4) until its pH reached to 2. Then, a certain amount of MoS2-NTs were dispersed in this solution followed by continuous stirring for 30 min at room temperature. After that, 4 mL of anhydrous ethanol solution which contained 0.5 mL of tetrabutyltitanate (TBT) was slowly injected into the abovementioned solution at 75 °C. The reaction mixture was capped and maintained at 75 °C for 24 h under vigorous stirring. After cooling down to room temperature, the product was washed thoroughly with anhydrous ethanol and deionized water. Finally, the homemade catalyst was dried in a vacuum oven at 60 °C for 12 h for further characterization and test. The weight percentage of TiO2 at 5, 10 and 15 wt% were evaluated for supporting MoS2-NTs and denoted as TiO2/MoS2-5, TiO2/MoS2-10 and TiO2/MoS2-15, respectively. For comparison, pure TiO2 nanoparticles were synthesized under the same conditions in the absence of MoS2-NTs.
4) until its pH reached to 2. Then, a certain amount of MoS2-NTs were dispersed in this solution followed by continuous stirring for 30 min at room temperature. After that, 4 mL of anhydrous ethanol solution which contained 0.5 mL of tetrabutyltitanate (TBT) was slowly injected into the abovementioned solution at 75 °C. The reaction mixture was capped and maintained at 75 °C for 24 h under vigorous stirring. After cooling down to room temperature, the product was washed thoroughly with anhydrous ethanol and deionized water. Finally, the homemade catalyst was dried in a vacuum oven at 60 °C for 12 h for further characterization and test. The weight percentage of TiO2 at 5, 10 and 15 wt% were evaluated for supporting MoS2-NTs and denoted as TiO2/MoS2-5, TiO2/MoS2-10 and TiO2/MoS2-15, respectively. For comparison, pure TiO2 nanoparticles were synthesized under the same conditions in the absence of MoS2-NTs.
Characterizations
X-ray diffraction (XRD) measurements were performed on a Bruker D8 diffractmeter with Cu Kα radiation (λ = 1.5406 Å). The operation voltage and current was 40 KV and 150 mA, respectively. X-ray photoelectron spectroscopy (XPS) measurements were carried out on Kratos-AXISULTRADLD, with Al Kα (1486.6 eV) radiation. The binding energies were referenced to the C 1s line at 284.6 eV from adventitious carbon. Raman spectra were collected on a Jobin Yvon HR 800 micro-Raman spectroscopy system with excitation line of 532 nm. The morphologies and microstructures were characterized by the scanning electron microscopy (SEM) and transmission electron microscopy (TEM).Electrochemical measurements
All electrochemical measurements were performed on an electrochemical workstation (CHI 760E, China) in a conventional three-electrode electrochemical cell at 25 ± 0.2 °C. A glassy carbon (GC) electrode (4 mm in diameter) with catalysts was used as the working electrode. A Pt wire and Hg/Hg2SO4 electrode were used as the counter and reference electrode, respectively. All the potentials reported in this manuscript were calibrated with respect to reversible hydrogen electrode (RHE).The catalysts were loaded onto the GC electrode by coating slurry method in the following way: 6 mg of catalysts were dispersed into the mixture solution of 0.05 mL Nafion solution (5 wt%, DuPont) and 0.95 mL ethanol by ultrasonication for about 1 h to form a homogeneous ink. Then, 6 μL of the suspension was transferred onto the surface of GC electrode and dried at room temperature, leading to a nominal catalyst loading of 0.286 mg cm−2.
The hydrogen evolution reaction (HER) activity of catalysts was investigated in 0.5 M H2SO4 electrolyte by linear potential sweep voltammetry (LSV) at a scan rate of 5 mV s−1. To evaluate the durability of catalyst, chronopotentiometry experiments were conducted in 0.5 M H2SO4 at a constant density of −10 mA cm−2. The long-term stability of the catalysts was performed by continuous 2000 cyclic voltammetry (CV) scanning between −0.6 V and 0.6 V at a scan rate of 50 mV s−1. Electrochemical impedance spectra (EIS) were carried out at overpotential of −200 mV over a frequency ranging from 100 kHz to 0.01 Hz with 12 points per decade. CV curves were used to estimate the double-layer capacitance (Cdl) under the potential region of 0.35–0.45 V performed with various sweep rates (20, 40, 60, 80 and 100 mV s−1). The electrolyte solution was deaerated with ultrapure argon for at least 30 min before each electrochemical measurement.
Results and discussion
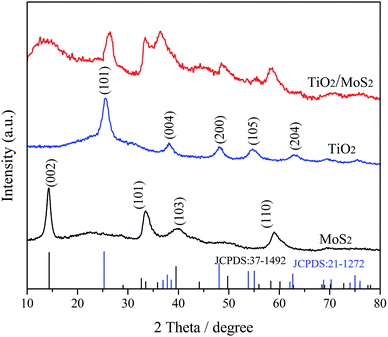
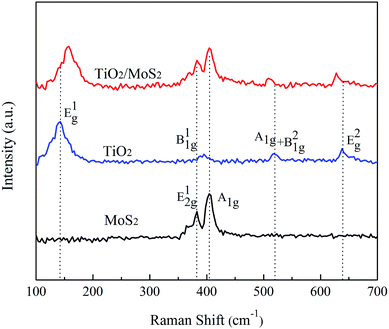
The XRD patterns of TiO2, MoS2-NTs and TiO2/MoS2-NTs composites are shown in Fig. 1. For MoS2-NTs, it is obviously observed that diffraction peaks at 2θ = 14.3°, 33.5°, 39.3° and 58.9° correspond to (002), (101), (103) and (110) lattice planes of the hexagonal phase MoS2 (JCPDS#37-1492), respectively. For pure TiO2, six characteristic XRD peaks are found at 2θ = 25.4°, 37.9°, 48.5°, 54.6°, and 62.8°, which are ascribed to (101), (004), (200), (105) and (204) lattice planes of the anatase phase TiO2 (JCPDS #21-1272), respectively. The diffraction peaks of TiO2/MoS2-NTs composites match those of TiO2 and MoS2, revealing that the hybrid compound was successfully prepared.Raman spectra were carried out for further characterizing the crystalline of TiO2, MoS2-NTs and TiO2/MoS2-NTs composites in Fig. 2. The two dominant Raman scattering peaks of pure MoS2 can be observed at 383 and 404 cm−1 corresponding to the in-plane E12g and out-of-plane A1g modes, respectively.43–45 Additionally, the integral intensity of the A1g mode is twice than that of the E12g mode, indicating that the MoS2-NTs are rich of edge sites.42 The characteristic Raman peaks of pure TiO2 at 143, 395, 517 and 637 cm−1 are assigned to the E1g, B11g, A1g + B21g and E2g modes of anatase-phase TiO2, respectively, and the strongest peak at 143 cm−1 is the symmetric stretching modes of O–Ti–O. The characteristic vibration peaks of TiO2 and MoS2 co-existed in the Raman spectrum of TiO2/MoS2-NTs composites, indicating that the TiO2/MoS2-NTs composites were successfully prepared. However, the wavenumber and intensity of the characteristic peaks of TiO2/MoS2-NTs composites changed slightly. The E1g mode showed a significant blue shift, while the A1g + B21g and E2g modes oppositely have a slightly red shift in the Raman spectrum of TiO2/MoS2-NTs composites compared with the corresponding peaks of TiO2. Remarkably, the obvious shift of the related peaks for TiO2/MoS2-NTs composites is consistent with the results of Liu46 and demonstrated that coupling effect between MoS2 and TiO2. Moreover, the two strong peaks of the E12g and A1g for MoS2 masked the B11g peak of TiO2 in the Raman spectrum of TiO2/MoS2-NTs composites. This is mostly owed to the relatively small content of TiO2.
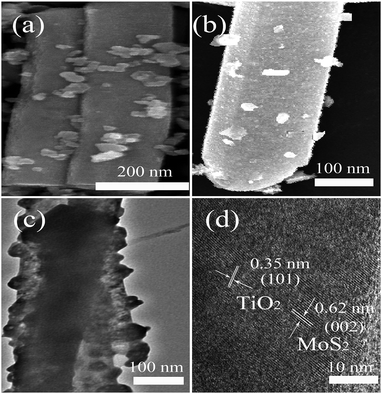
The morphology and structure of the TiO2/MoS2-NTs can be characterized by SEM and TEM. Fig. 3a and S1† displayed the SEM image of TiO2/MoS2-NTs. It is very clear that TiO2 nanoparticles dispersed on surface of the MoS2-NTs to form TiO2/MoS2-NTs in Fig. 3b. MoS2-NTs surface is attached by a small amount of TiO2 nanoparticles in the TEM image of as-prepared TiO2/MoS2-NTs, as shown in Fig. 3c, comparing with the naked MoS2-NTs (Fig. S2†). Fig. 3d is the high-resolution TEM image of TiO2/MoS2-NTs sample, there are two different lattice spacing, the one lattice spacing is 0.35 nm, which matches with that of anatase TiO2 (101) planes, the other lattice spacing of 0.62 nm is correspond to the lattice spacing of (002) planes for MoS2 nanotubes. TEM images confirmed a well decorated of TiO2 nanoparticles on MoS2-NTs, suggesting the formation of TiO2/MoS2-NTs composites which may be beneficial to the improvement of HER performance.37
The electrocatalytic HER activities of all prepared samples can be observed by LSV in acidic solution. Fig. 4a showed the LSV polarization curves of MoS2-NTs, TiO2, Pt/C, and TiO2/MoS2-NTs in 0.5 M H2SO4 solution at 25 °C. The TiO2 showed poor electrocatalytic HER activity, which contributed negligibly to the performances of the integrated electrodes. Comparing with that of MoS2-NTs, TiO2/MoS2-NTs displayed the more positive onset overpotential of 0.14 V, which favored the mass transfer and subsequently reduced the concentration polarization,47 indicating a good catalytic activity to the product. It is well known that the electrocatalyst with a lower overpotential is typically considered to have a better catalytic activity at the same current density. The TiO2/MoS2-NTs composites only required a overpotential of down to 0.21 V to achieve a cathodic current density of 10 mA cm−2, much lower than that of the MoS2-NTs (0.32 V). Shifting of the overpotential to a small value for TiO2/MoS2-NTs further confirmed the improved electrocatalytic HER activity.
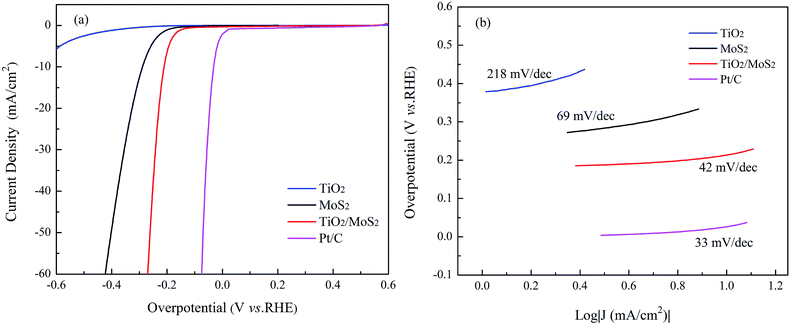 | ||
| Fig. 4 (a) Polarization curves and (b) the corresponding Tafel plots of TiO2, MoS2-NTs and TiO2/MoS2-NTs in 0.5 M H2SO4 solution. | ||
The linear portions of the Tafel plots are fitted to the Tafel equation as shown in Fig. 4b. Clearly, the Tafel slopes of TiO2, MoS2-NTs, TiO2/MoS2-NTs and Pt/C are 218, 69, 42 and 33 mV dec−1, respectively. According to the explanation of Chorkendorff et al.,7,17 the Tafel slope of Volmer, Heyrovsky and Tafel reaction correspond to 116, 38 and 29 mV dec−1, respectively. The Tafel slope of TiO2/MoS2-NTs is much lower than those of TiO2 or MoS2-NTs, indicating it's predominate Volmer–Heyrovsky mechanism33 in which the rate-determining step is the electrochemical desorption of Hads (i.e. Heyrovsky reaction) and superior activity during the HER process. Therefore, the improved HER activities of TiO2/MoS2-NTs mainly results from the strong electronic and chemical coupling between highly stable TiO2 nanoparticles and electroactive MoS2-NTs. Furthermore, TiO2/MoS2-NTs shows a larger exchange current density (j0) value of 32.4 μA cm−2 than MoS2-NTs (18.7 μA cm−2), which also can corroborate the superior HER performance and faster electron transfer kinetics for the TiO2/MoS2-NTs hybrid catalyst. Moreover, we also compared the activity of TiO2/MoS2-NTs with those of other HER catalysts reported in the literature (Table 1). The onset overpotential of TiO2/MoS2-NTs is smaller than those of TiO2/MoS2 composites. The Tafel slope and overpotential to reach a cathodic current density of 10 mA cm−2 of this work exhibit smaller than other six catalysts. The smaller overpotential and Tafel slope imply its excellent electrocatalytic activity. Among them, the exchange current density of TiO2/MoS2-NTs is the largest, showing the highest activity.
The XPS measurements were employed to investigate the surface chemical composition and valence state of prepared samples. The wide-scan XPS spectra (Fig. S3†) revealed that the existence of O, Ti, Mo, and S elements in the TiO2/MoS2-NTs composites, while a trace of C is from the XPS instrument itself. The binding energy of Mo 3d3/2 and Mo 3d5/2 in Fig. 5a are located at 232.4 and 228.8 eV, respectively, indicating that the oxidation state of Mo4+ in the pure MoS2.48,49,52 After introducing TiO2 nanoparticles, the peaks of Mo 3d shifted by about 0.3 eV to the lower energy direction, which can be attributed to the electronic interactions between TiO2 and MoS2-NTs.43,50,55 In addition, the characteristic peak of S 2s also appeared at a binding energy of 225.7 eV in the TiO2/MoS2-NTs composites. As shown in Fig. 5b, the S peaks located at 162.8 and 161.6 eV represent S 2p1/2 and S 2p3/2, respectively, suggesting that S2− existed in the pure MoS2.51,54 For TiO2/MoS2-NTs, the S 2p1/2 and S 2p3/2 peaks are shifted to 162.5 and 161.4 eV. Meanwhile, the S 2p3/2 energy at 163.3 eV in the TiO2/MoS2-NTs composites revealed the existence of bridging S22− or apical S2−, which are more beneficial in the HER performance.10,52,56 According to the literature description,35 the binding energies of Ti 2p1/2 and Ti 2p3/2 peaks in the pure TiO2 locate at 464.3 and 458.5 eV, respectively. While the TiO2/MoS2-NTs composites the Ti 2p1/2 and Ti 2p3/2 peaks are shifted to 464.5 and 458.7 eV in Fig. 5c, higher than the corresponding values of pure TiO2. The shift of peaks indicated possible new bond Ti–O–Mo and the electronic interaction between TiO2 and MoS2.23,53 As shown in Fig. 5d, besides the O 1s peaks at 529.7 eV attributed to the Ti–O–Ti bond, the absorption peaks at 530.9 and 531.5 eV correspond to surface hydroxyl group (Ti–O–H) and adsorbed water, respectively. The O 1s peak at around 530.3 eV is observed, which might be ascribed to the formation of the Ti–O–Mo bonds between MoS2 and TiO2.36,55
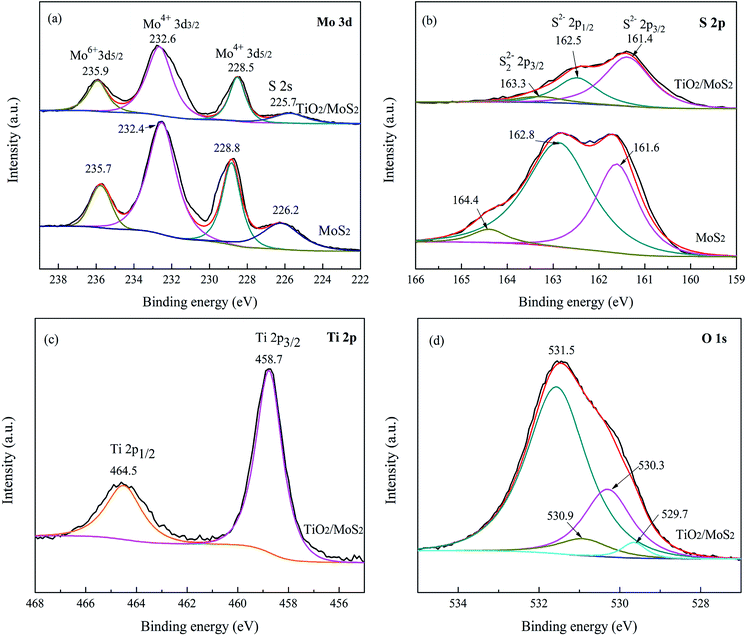 | ||
| Fig. 5 High-resolution XPS spectra of (a) Mo 3d, (b) S 2p for TiO2/MoS2-NTs and MoS2-NTs, (c) Ti 2p and (d) O 1s spectra of TiO2/MoS2-NTs. | ||
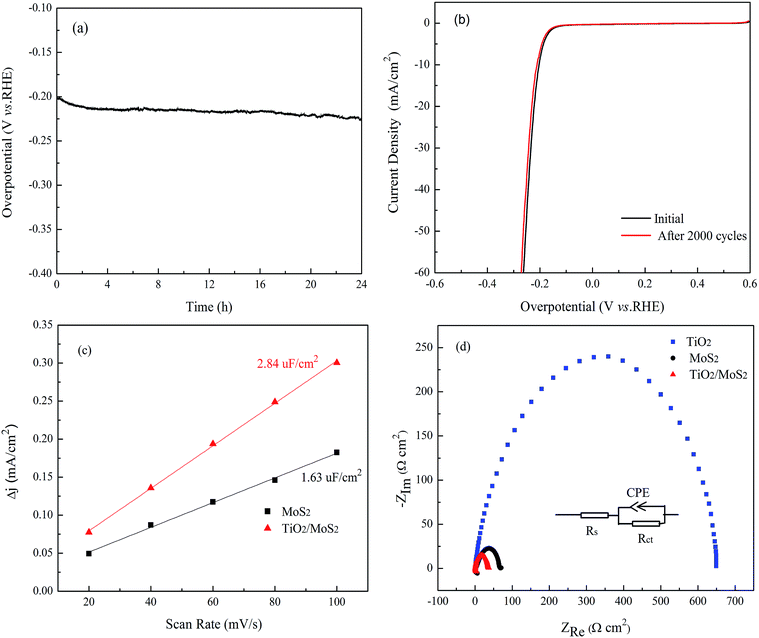
Durability and long-term stability is another significant factor to evaluate the performance of the electrocatalyst. Chronopotentiometry experiments were conducted to investigate the HER durability of the electrocatalysts in 0.5 M H2SO4. As shown in Fig. 6a, in the initial period for the time-dependent curve of TiO2/MoS2-NTs composites, there is a sharp drop in overpotential due to the slow desorption of the adsorbed hydrogen atom on the catalysts. The only slightly fluctuation of the overpotential was observed as time changed. There is a small reduction of 20 mV in the overpotential after 24 h, suggesting the excellent durability of the TiO2/MoS2-NTs catalyst. The striking stability was further proved by the LSV polarization curves before and after processing 2000 CV cycles in the same electrolyte. As shown in Fig. 6b, the negligible degradation of HER activity between the curves measured at the initial cycle and after 2000 CV cycles, indicating the excellent long-term cycling stability of TiO2/MoS2-NTs catalyst.
The higher activity as well as good stability of the TiO2/MoS2-NTs for HER can be attributed to the following reasons. The small size and highly uniform distribution of TiO2 nanoparticles can increase the number of catalytic edge sites that play an important role for HER performance by activating the inert basal planes of MoS2-NTs catalyst. The electrochemical Cdl are measured via CV method (Fig. S6†) to evaluate the density of active sites of various catalysts, which can be estimated from the slopes of the current density vs. scan rate curves.35 As shown in Fig. 6c, TiO2/MoS2-NTs exhibited much larger Cdl of 2.84 μF cm−2 than that of MoS2-NTs (1.63 μF cm−2) within the same potential range, indicating the TiO2 nanoparticles is very important for the high exposure of MoS2-NTs with effective active sites.
The EIS measurement was also used to investigate the charge transfer resistance (Rct) between the surface of the catalyst and the electrolyte. Fig. 6d showed a comparison of Nyquist plots of MoS2-NTs, TiO2 and TiO2/MoS2-NTs. It is well known that a smaller arc radius in Nyquist plots indicates a lower interface resistance. Clearly, TiO2/MoS2-NTs showed dramatically decrease of charge transfer resistance than MoS2-NTs or TiO2, indicating that the load of TiO2 can greatly improve the conductivity of the MoS2-NTs by accelerating the electron transport, which promoted the HER activity of TiO2/MoS2-NTs.
Conclusions
In summary, we synthesized a nanocomposite consisting of MoS2 nanotubes loaded with TiO2 nanoparticles and characterized it well from XRD, Raman, XPS, TEM, and HRTEM analysis. TiO2/MoS2-NTs composite showed a high-efficiency electrocatalytic HER comparable to that of MoS2-NTs, as a prominent alternative for platinum-based electrocatalysts, exhibited remarkable HER activity with a relatively low overpotential of 0.21 V at a cathode current density of 10 mA cm−2 and a small Tafel slope of 42 mV dec−1 as well as excellent long-term stability. It can be attributed to the high exposure of active sites and fast charge transport simultaneously by the loading with TiO2 nanoparticles. Our research confirmed that electronic and chemical coupling effect between the MoS2 and TiO2 can be utilized in the enhancements of electrochemical performance. Moreover, TiO2/MoS2-NTs composite would be extended to a wide range of energy and environmental applications, such as photocatalytic and photoelectrocatalytic hydrogen production.Conflicts of interest
There are no conflicts to declare.Acknowledgements
This work was supported by National Innovation and Entrepreneurship Training Program for Undergraduate (No. 201810212026).Notes and references
- N. Armaroli and V. Balzani, Angew. Chem., Int. Ed., 2007, 46, 52–66 CrossRef CAS PubMed.
- S. Chen, S. S. Thind and A. C. Chen, Electrochem. Commun., 2016, 63, 10–17 CrossRef CAS.
- J. W. Sun, D. K. Zhong and D. R. Gamelin, Energy Environ. Sci., 2010, 3, 1252–1261 RSC.
- X. X. Zou and Y. Zhang, Chem. Soc. Rev., 2015, 44, 5148–5180 RSC.
- S. Y. Tee, K. Y. Win, W. S. Teo, L. D. Koh, S. H. Liu, C. P. Teng and Mi. Y. Han, Adv. Sci., 2017, 4, 1600337 CrossRef PubMed.
- M. C. He, F. P. Kong, G. P. Yin, Z. Lv, X. D. Sun, H. Y. Shi and B. Gao, RSC Adv., 2018, 8, 14369–14376 RSC.
- E. Kemppainen, A. Bodin, B. Sebok, T. Pedersen, B. Seger, B. Mei, D. Bae, P. C. K. Vesborg, J. Halme, O. Hansen, P. D. Lunda and I. Chorkendorff, Energy Environ. Sci., 2015, 8, 2991–2999 RSC.
- S. Q. Lu and Z. B. Zhuang, Sci. China Mater., 2016, 59, 217–238 CrossRef CAS.
- J. R. McKone, S. C. Marinescu, B. S. Brunschwig, J. R. Winkler and H. B. Gray, Chem. Sci., 2014, 5, 865–878 RSC.
- A. Eftekhari, Int. J. Hydrogen Energy, 2017, 42, 11053–11077 CrossRef CAS.
- Y. X. Chen, K. N. Yang, B. Jiang, J. X. Li, M. Q. Zeng and L. Fu, J. Mater. Chem. A, 2017, 5, 8187–8208 RSC.
- C. G. Morales-Guio, L. A. Stern and X. L. Hu, Chem. Soc. Rev., 2014, 43, 6555–6569 RSC.
- J. Bonde, P. G. Moses, T. F. Jaramillo, J. K. Nørskov and I. Chorkendorff, Faraday Discuss., 2009, 140, 219–231 RSC.
- J. F. Xie, J. J. Zhang, S. Li, F. Grote, X. D. Zhang, H. Zhang, R. X. Wang, Y. Lei, B. C. Pan and Y. Xie, J. Am. Chem. Soc., 2013, 135, 17881–17888 CrossRef CAS PubMed.
- J. D. Benck, T. R. Hellstern, J. Kibsgaard, P. Chakthranont and T. F. Jaramillo, ACS Catal., 2014, 4, 3957–3971 CrossRef CAS.
- B. Hinnemann, P. G. Moses, J. Bonde, K. P. Jørgensen, J. H. Nielsen, S. Horch, I. Chorkendorff and J. K. Nørskov, J. Am. Chem. Soc., 2005, 127, 5308–5309 CrossRef CAS PubMed.
- T. F. Jaramillo, K. P. Jorgensen, J. Bonde, J. H. Nielsen, S. Horch and I. Chorkendorff, Science, 2007, 317, 100–102 CrossRef CAS PubMed.
- Q. H. Wang, K. Kalantar-Zadeh, A. Kis, J. N. Coleman and M. S. Strano, Nat. Nanotechnol., 2012, 7, 699–712 CrossRef CAS PubMed.
- J. Kibsgaard, Z. B. Chen, B. N. Reinecke and T. F. Jaramillo, Nat. Mater., 2012, 11, 963–969 CrossRef CAS PubMed.
- Z. Lv, N. Mahmood, M. Tahir, L. Pan, X. W. Zhang and J. J. Zou, Nanoscale, 2016, 8, 18250–18269 RSC.
- H. L. Huang, W. H. Huang, Z. H. Yang, J. Y. Huang, J. D. Lin, W. P. Liu and Y. J. Liu, J. Mater. Chem. A, 2017, 5, 1558–1566 RSC.
- S. Jayabal, G. Saranya, J. Wu, Y. Q. Liu, D. S. Geng and X. B. Meng, J. Mater. Chem. A, 2017, 5, 24540–24563 RSC.
- L. Song, M. J. Zhao, X. X. Li, Z. P. Zhang and L. T. Qu, RSC Adv., 2016, 6, 70740–70746 RSC.
- F. L. Deepak and M. Jose-Yacaman, Isr. J. Chem., 2010, 50, 426–438 CrossRef CAS.
- W. J. Jian, X. L. Cheng, Y. Y. Huang, Y. You, R. Zhou, T. T. Sun, J. Xu and X. Wang, Chem. Eng. J., 2017, 328, 474–483 CrossRef CAS.
- S. F. Zhuo, Y. Xu, W. W. Zhao, J. Zhang and B. Zhang, Angew. Chem., Int. Ed., 2013, 52, 8602–8606 CrossRef CAS PubMed.
- J. Wang, J. L. Liu, H. Yang, Z. Chen, J. Y. Lin and Z. X. Shen, J. Mater. Chem. A, 2016, 4, 7565–7572 RSC.
- J. F. Xie, H. Zhang, S. Li, R. X. Wang, X. Sun, M. Zhou, J. F. Zhou, X. W. D. Lou and Y. Xie, Adv. Mater., 2013, 25, 5807–5813 CrossRef CAS PubMed.
- D. A. Voiry, M. Salehi, R. Silva, T. Fujita, M. W. Chen, T. Asefa, V. B. Shenoy, G. Eda and M. Chhowalla, Nano Lett., 2013, 13, 6222–6227 CrossRef CAS PubMed.
- B. Seo and S. H. Joo, Nano Convergence, 2017, 4, 19 CrossRef PubMed.
- E. Baran, Z. Baz, R. Esen and B. Y. Devrim, Appl. Surf. Sci., 2017, 420, 416–428 CrossRef CAS.
- M. A. Amin, E. M. Ahmed, N. Y. Mostafa, M. M. Alotibi, G. Darabdhara, M. R. Das, J. Wysocka, J. Ryl and S. S. Abd El-Rehim, ACS Appl. Mater. Interfaces, 2016, 8, 23655–23667 CrossRef CAS.
- W. H. Wang, S. Wang, J. G. Lv, M. Zhao, M. Zhang, G. He, C. X. Fang, L. L. Li and Z. Q. Sun, J. Am. Ceram. Soc., 2018, 101, 5469–5476 CrossRef CAS.
- Z. Q. Liu, X. M. Zhang, B. Wang, M. Xia, S. G. Gao, X. Y. Liu, A. Zavabeti, J. Z. Ou, K. Kalantar-zadeh and Y. C. Wang, J. Phys. Chem. C, 2018, 122, 12589–12597 CrossRef CAS.
- Y. Dong, S. Y. Chen, Y. Lu, Y. X. Xiao, J. Hu, S. M. Wu, Z. Deng, G. Tian, G. G. Chang, J. Li, S. Lenaerts, C. Janiak, X. Y. Yang and B. L. Su, Chem. - Asian J., 2018, 13, 1609–1615 CrossRef CAS PubMed.
- B. Ma, P. Y. Guan, Q. Y. Li, M. Zhang and S. Q. Zang, ACS Appl. Mater. Interfaces, 2016, 8, 26794–26800 CrossRef CAS PubMed.
- Y. Z. Shen, X. H. Ren, X. Qi, J. Zhou, Z. Y. Huang and J. X. Zhong, J. Electrochem. Soc., 2016, 163, H1087–H1090 CrossRef CAS.
- R. Z. Zhang, Q. W. Chen, Y. X. Lei and J. P. Zhou, J. Mater. Sci.: Mater. Electron., 2019, 30, 5393–5403 CrossRef CAS.
- M. Zhang, S. Wang, Z. L. Li, C. W. Liu, R. Miao, G. He, M. Zhao, J. Xue, Z. Y. Xia, Y. Q. Wang, Z. Q. Sun and J. G. Lv, RSC Adv., 2019, 9, 3479–3485 RSC.
- J. G. Lv, R. Miao, M. Zhang, G. He, M. Zhao, B. Yu, W. Wang, B. Li and Z. Q. Sun, J. Mater. Sci.: Mater. Electron., 2018, 29, 16282–16288 CrossRef CAS.
- Y. Y. Tian, Y. Song, M. L. Dou, J. Ji and F. Wang, Appl. Surf. Sci., 2018, 433, 197–205 CrossRef CAS.
- J. Liang, C. X. Wang, P. Y. Zhao, Y. R. Wang, L. B. Ma, G. Y. Zhu, Y. Hu, Z. P. Lu, Z. R. Xu, Y. Ma, T. Chen, Z. X. Tie, J. Liu and Z. Jin, ACS Appl. Mater. Interfaces, 2018, 10, 6084–6089 CrossRef CAS PubMed.
- X. L. Song, G. F. Chen, L. X. Guan, H. Zhang and J. G. Tao, Appl. Phys. Express, 2016, 9, 095801 CrossRef.
- M. Nath, A. Govindaraj and C. N. R. Rao, Adv. Mater., 2001, 13, 283–286 CrossRef CAS.
- M. Remskar, A. Mrzel, Z. Skraba, A. Jesih, M. Ceh, J. Demsar, P. Stadelmann, F. Levy and D. Mihailovic, Science, 2001, 292, 479–481 CrossRef CAS PubMed.
- X. F. Liu, Z. P. Xing, Y. Zhang, Z. Z. Li, X. Y. Wu, S. Y. Tan, X. J. Yu, Q. Zhu and W. Zhou, Appl. Catal., B, 2017, 201, 119–127 CrossRef CAS.
- J. Kibsgaard, Z. Chen, B. N. Reinecke and T. F. Jaramillo, Nat. Mater., 2012, 11, 963–969 CrossRef CAS PubMed.
- J. J. Zhang, M. H. Wu, Z. T. Shi, M. Jiang, W. J. Jian, Z. R. Xiao, J. X. Li, C. S. Lee and J. Xun, Small, 2016, 12, 4379–4385 CrossRef CAS PubMed.
- J. Chen, S. L. Li, Q. Xu and K. Tanaka, Chem. Commun., 2002, 16, 1722–1723 RSC.
- Q. Wang, J. Y. Huang, H. T. Sun, Y. H. Ng, K. Q. Zhang and Y. K. Lai, ChemSusChem, 2018, 11, 1708–1721 CrossRef CAS PubMed.
- L. X. Zheng, S. C. Han, H. Liu, P. P. Yu and X. S. Fang, Small, 2016, 12, 1527–1536 CrossRef CAS PubMed.
- C. H. Meng, Z. Y. Liu, T. R. Zhang and J. Zhai, Green Chem., 2015, 17, 2764–2768 RSC.
- W. Wang, Y. Q. Wang, C. P. Li, Y. J. Wu, D. Y. Zhang, K. Q. Hong and Y. M. Sun, Chem. Commun., 2017, 53, 5461–5464 RSC.
- W. N. Ren, W. W. Zhou, H. F. Zhang and C. W. Cheng, ACS Appl. Mater. Interfaces, 2017, 9, 487–495 CrossRef CAS PubMed.
- C. B. Liu, L. L. Wang, Y. H. Tang, S. L. Luo, Y. T. Liu, S. Q. Zhang, Y. X. Zeng and Y. Z. Xu, Appl. Catal., B, 2015, 164, 1–9 CrossRef CAS.
- Y. H. Chang, C. T. Lin, T. Y. Chen, C. L. Hu, Y. H. Lee, W. J. Zhang, K. H. Wei and L. J. Li, Adv. Mater., 2013, 25, 756–760 CrossRef CAS PubMed.
Footnote |
| † Electronic supplementary information (ESI) available: Survey XPS spectrum and SEM image of TiO2/MoS2-NTs, TEM image of MoS2-NTs, LSV polarization curves and corresponding Tafel plots of different catalysts, CV curves at various scan rates of different catalysts. See DOI: 10.1039/c9ra05041h |
| This journal is © The Royal Society of Chemistry 2019 |

