 Open Access Article
Synthesis and electrochemical performances of Na3V2(PO4)2F3/C composites as cathode materials for sodium ion batteries
Mingxue
Wang
a,
Xiaobing
Huang
 *b,
Haiyan
Wang
a,
Tao
Zhou
*a,
Huasheng
Xie
c and
Yurong
Ren
*d
aHunan Provincial Key Laboratory of Efficient and Clean Utilization of Manganese Resources, College of Chemistry and Chemical Engineering, Central South University, Changsha 410083, China. E-mail: zhoutao@csu.edu.cn
bHunan Province Cooperative Innovation Center for the Construction & Development of Dongting Lake Ecological Economic Zone, College of Chemistry and Materials Engineering, Hunan University of Arts and Science, Changde 415000, China. E-mail: hxb220170@126.com; Tel: +86 13762681279
cCangzhou Dahua Group Co., Ltd., Cangzhou 061000, Hebei, China
dSchool of Materials Science and Engineering, Jiangsu Collaborative Innovation Center of Photovoltaic Science and Engineering, Changzhou University, Changzhou 213164, China. E-mail: ryrchem@163.com
First published on 27th September 2019
Abstract
Na3V2(PO4)2F3 (NVPF) with NASCION (Na superionic conductor) is recognized as a potential cathode material owing to its high theoretical capacity. However, the electronic conductivity of NVPF is much lower than its ionic conductivity, which seriously affects the properties of this material. The carbon layer can be used as the conductive medium to enhance the conductivity of NVPF. In this study, we propose a single-step solid-state reaction method based on mechanical activation with pitch as the carbon source to synthesize NVPF/C composites. The crystallographic structure and morphology of all as-prepared samples were investigated by XRD, Raman spectroscopy, BET measurement, thermal analysis, SEM and TEM. Furthermore, the electrochemical performance and kinetic properties were analyzed by CV, galvanostatic charge–discharge and EIS tests. These tests outcomes demonstrated that the NVPF/C-2 composite with a carbon content of 12.14 wt% showed an excellent rate performance and cycle stability. It presented reversible capacities of 103 and 95 mA h g−1 at 0.2 and 10C, respectively, and an outstanding retention of 91.9% after 500 cycles at 5C. These excellent properties of the NVPF/C-2 composite are attributed to its high ion diffusion coefficient and small charge transfer impedance.
1. Introduction
With the realization of the smart grid, the large-scale energy storage system has become a pivotal issue of power grid technology development.1 Among all storage systems, the lithium ion battery is widely employed in electronic devices owing to its high energy density and long cycle life. However, with the application of the large-scale energy storage systems, limited lithium resources will face the bottleneck of shortage.2 Therefore, the urgent challenge is to develop a kind of lithium ion battery substitute with exceptional comprehensive properties.3 Sodium ion batteries are considered as one of the potential batteries for energy storage applications due to their advantages in price and reserves.2 In particular, sodium ion batteries have a similar working principle and mechanism to lithium ion batteries. However, the volume variation in Na ion insertion/extraction is larger than that of Li ion insertion/extraction, which results in a poor cycle and rate performance of the sodium ion batteries. Therefore, research on suitable electrode materials for sodium ion batteries is a pivotal step toward its future applications.With the study of cathode materials for sodium ion batteries, fluorophosphates are brought into focus owing to their high working potential and stable structure.4 Fluorophosphate materials, such as NaVPO4F,5,6 Na2MPO4F (M = Fe and Co),7,8 Na3V2(PO4)2F3,9–11 Na3V2O2(PO4)2F,12,13 have been used as candidates for traditional oxide cathodes. Among all fluorophosphate cathode materials, Na3V2(PO4)2F3 (NVPF) with NASCION (Na superionic conductor) is recognized as a potential cathode material owing to its high theoretical capacity. It possesses a good theoretical capacity of 128 mA h g−1 and a high average working voltage of 3.9 V.14–16 In addition, NVPF also possesses a three-dimensional structure comprising a [V2O8F3] bi-octahedral and [PO4] tetrahedral.15,17 This crystal structure can provide three-dimensional ion transport tunnels that have the ability to quickly insert and extract Na ions.18 In addition, this material has better stability and a higher potential plateau than Na3V2(PO4)3 because of the frame structure formed by the PO43− polyanion and the strength of the F− ion. Although NVPF has many advantages, it also has some serious drawbacks. The electronic conductivity of NVPF is much lower than its ionic conductivity, which seriously affects the properties of the material, particularly at high rates.18,19 Therefore, improving the rate performance of the NVPF material is one of the keys to improving its commercialization.
Nowadays, reducing material particle size,20,21 doping with other ions22,23 and carbon layer coating9,24 are the three main strategies that have been utilized to overcome the drawback of the NVPF material. Among these strategies, coating a conductive carbon layer on the surface of NVPF is one of the effective methods to enhance its conductivity. NVPF/C with carbon sources, such as acetylene black powders,16 citric acid18,25 and oxalic acid,10 have been recently reported, and the electrochemical performances of these materials were successfully improved. It is well-known that the coated carbons obtained from the pyrolysis of the aforesaid carbon sources are usually non-graphitized. In our previous report, a functionalized aromatic pitch has been verified to produce highly graphitized carbon with better electronic conductivity, giving rise to higher electrochemical properties of the electrode material.26 Similar to this strategy, pitch is used as a carbon source to construct NVPF/C composites. It is expected that the fabrication of the NVPF/C composites will result in good electrochemical performance. Among many preparation methods, the single-step solid-state reaction method is economical. In this study, we propose a single-step solid-state reaction method based on mechanical activation with pitch as the carbon source to synthesize NVPF/C composites.
2. Experiment
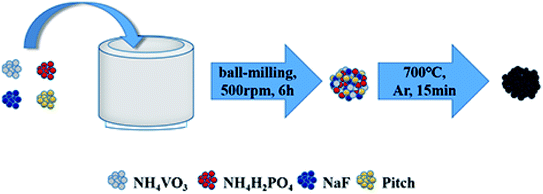
A schematic on the preparation of the NVPF/C composites is shown in Scheme 1, and the detailed procedures are as follows. The samples were prepared via a single-step solid-state reaction method based on mechanical activation with NaF (99.9%, Aladdin), NH4VO3 (99.9%, Aladdin), NH4H2PO4 (99%, Aladdin) and pitch as the raw materials. First, a certain amount of pitch (0.75 g, 1 g or 1.25 g), 0.045 mol NaF, 0.03 mol NH4VO3 and 0.03 mol NH4H2PO4 were dispersed into acetone and sent to a planetary ball-milling at 500 rpm for 6 h. Second, the solvent was then removed from the obtained slurry at 60 °C for 3 h, and the powder was obtained. Finally, the powder was calcined in a microwave tube furnace at 700 °C for 15 min under flowing argon gas to produce black NVPF/C composites. The NVPF/C composites synthesized from 0.75 g, 1 g and 1.25 g of pitch are expressed as NVPF/C-1, NVPF/C-2 and NVPF/C-3, respectively.The crystallographic structure of the sample was investigated by X-ray diffraction (DY1219) in the range of 10–80°. The morphology of the samples was characterized by scanning electron microscopy and transmission electron microscopy. The carbon content of the NVPF/C samples was determined via a thermogravimetric analysis meter at 10 °C min−1 from room temperature to 800 °C. Raman spectroscopy was performed on a Raman spectrometer (Jobin Yvon-Horiba) with Ar-ion laser excitation. The specific surface area was measured by Brunauer–Emmett–Teller measurement (Builder SSA-4200) at −196 °C.
The electrochemical performances of the sample were evaluated using a CR2032 coin cell. The cathode electrode consisted of 80 wt% NVPF/C, 10 wt% Super-P and 10 wt% LA-132 binder, and aluminum foil as the current collector. CR2032 cells were assembled in an argon-filled glove box with sodium pieces as the anode. In addition, the separator was a glass fiber (Whatman GF/C) and the electrolyte was 1 M NaClO4 dissolved in a solvent of EC/DMC/EMC (1![[thin space (1/6-em)]](https://www.rsc.org/images/entities/char_2009.gif) :
:![[thin space (1/6-em)]](https://www.rsc.org/images/entities/char_2009.gif) 1
1![[thin space (1/6-em)]](https://www.rsc.org/images/entities/char_2009.gif) :
:![[thin space (1/6-em)]](https://www.rsc.org/images/entities/char_2009.gif) 1 in volume) and FEC (2 wt%). Galvanostatic charge/discharge cycling tests were performed in the voltage range of 2–4.5 V. The cyclic voltammetry curves were tested on a CHI electrochemical workstation (CHI760E) at 0.2 mV s−1 and 1.5–4.5 V. Electrochemical impedance spectroscopy was performed on an electrochemical workstation from 10−2 Hz to 105 Hz with 5 mV.
1 in volume) and FEC (2 wt%). Galvanostatic charge/discharge cycling tests were performed in the voltage range of 2–4.5 V. The cyclic voltammetry curves were tested on a CHI electrochemical workstation (CHI760E) at 0.2 mV s−1 and 1.5–4.5 V. Electrochemical impedance spectroscopy was performed on an electrochemical workstation from 10−2 Hz to 105 Hz with 5 mV.
3. Results and discussion
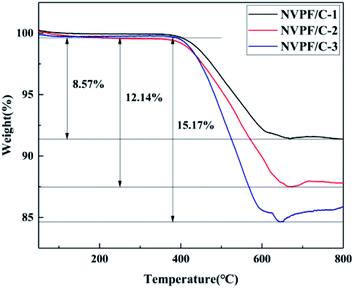
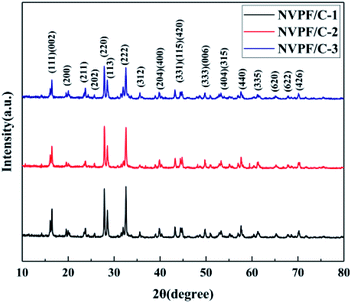
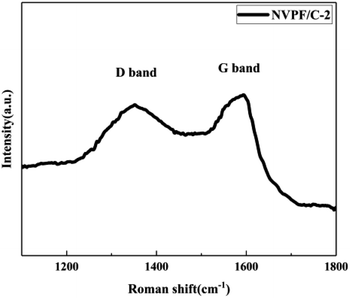
The carbon contents for the three samples were estimated via TG measurement, and the TG curves of the NVPF/C composites are exhibited in Fig. 1. The carbon contents of the three composites were about 8.6, 12.1 and 15.2 wt%. XRD of the three samples was performed, and the patterns are presented in Fig. 2. The diffraction peaks of the three obtained samples are consistent with the JCPDS data (PDF#04-012-2207) and literature,16 demonstrating that the powder is well-crystallized and indexed to the tetragonal symmetry with the P42/mnm space group. No impurity peaks were observed, which suggests that the carbon coating is mainly amorphous.9 In addition, there was no significant difference among the three NVPF/C samples, except for the peak intensity. As the carbon content increases, the peak intensity of the as-prepared materials becomes weaker, which suggests that a much smaller crystallinity of the material is obtained with the increase in the carbon content.To further identify the degree of graphitization in the NVPF/C composites, the presence of amorphous carbon was determined by Raman spectroscopy and the results are shown in Fig. 3. Two prominent peaks at 1352 cm−1 and 1593 cm−1 are assigned to structural defects (disordered carbon) and graphitic structures (crystalline graphitized carbon), respectively.9 As reported, ID/IG is a measurement criterion for the disorder degree or the relative number of defects in the carbon structure.9,27 In light of the results obtained from the Raman spectrum, the ID/IG value of carbon in the NVPF/C-2 composite is calculated to be 0.97. As reported, the ID/IG value of carbon in NVPF@C prepared with citric acid and oxalic acid is 1.084 (ref. 9) and 1.973,10 respectively. The above results show that the less disordered carbon is obtained from the pyrolysis of pitch. Also, the formation of the carbonous framework in the NVPF/C-2 composite helps to improve its electrical conductivity. The electronic conductivity of the NVPF/C composites is presented in Table 1, and an improved electronic conductivity of the NVPF/C composite is observed with the increase in the carbon content.
| Sample | Electronic conductivity (S cm−1) |
|---|---|
| NVPF/C-1 | 1.13 × 10⁻⁴ |
| NVPF/C-2 | 3.48 × 10⁻⁴ |
| NVPF/C-3 | 5.35 × 10⁻⁴ |
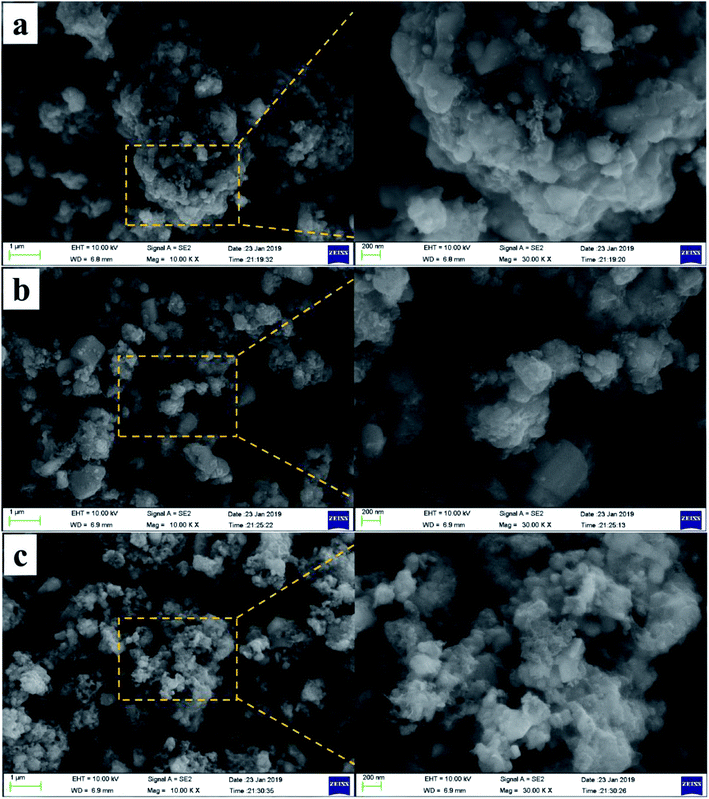
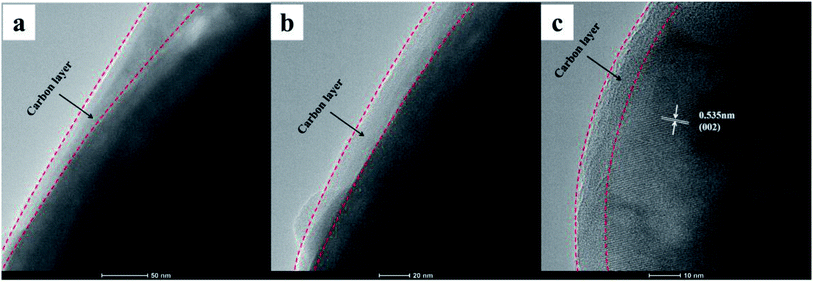
The morphology of the composites was characterized by SEM, and the SEM images of the three NVPF/C samples are represented in Fig. 4. As illustrated in Fig. 4, the particle size of the material became smaller with the increase in the carbon content, suggesting that more carbon coated on the surface of the NVPF particles will be conducive to hindering the growth of the particles. Also, the tendency of the nanoparticle aggregation can be observed in three samples. Fig. 5 exhibits the TEM images of the NVPF/C-2 composite. From the TEM images, the uniform covering layer of carbon is about 16 nm on the NVPF particle surface. As observed from Fig. 5c, there are lattice fringes in the particles with a diameter of about 0.535 nm, which corresponds to the interplanar spacing of the (002) planes.
The specific surface area of the NVPF/C composites was investigated via BET. The nitrogen adsorption and desorption isotherm plots are shown in Fig. 6. The specific surface area of the three composites was about 6.9, 18.2 and 18.3 m2 g−1. The specific surface area tends to increase with the increase in the carbon content and accordingly, the ion diffusion and the electrolyte penetration are promoted.21
 | ||
| Fig. 6 Nitrogen adsorption and desorption isotherm of NVPF/C composites: (a) NVPF/C-1, (b) NVPF/C-2, (c) NVPF/C-3. | ||
For the sake of the carbon coating effect assessment on the electrochemical performance, CV was performed at 0.2 mV s−1 and 1.5–4.5 V, and the results are depicted in Fig. 7. Three pairs of sharp redox peaks of all NVPF/C composites at about 3.46/3.18 V, 3.75/3.69 V, 4.23/4.11 V are observed in the CV curves. In combination with previous references,9 the CV features can be explained as follows: the Na ions at Na(2) with a high chemical potential are less stable than at Na(1), indicating that the extraction/insertion of Na ions will be carried out at an earlier or later stage of charge–discharge. Half of the Na(2) ions will be extracted, and the Na2.5V2(PO4)2F3 configuration will be reorganized to a stable state. The left Na(2) ions are more stable and harder to extract, which results in a higher voltage for the redox peak. Thus, the first two pairs of redox peaks located at 3.46/3.18 and 3.75/3.69 V correspond to the extraction/insertion of the Na(2) ions.10 Similar to the analysis of the reorganization, the distance between the Na(1) ions is increased after the first ion extraction. The extraction of the Na(1) ion at the higher potential produces a third pair of redox peaks located at 4.23/4.11 V. The peak and difference potentials of the NVPF/C composites are presented in Table 2. NVPF/C-2 shows the smallest redox potential difference, indicating that NVPF/C-2 has the least polarization.
| Sample | NVPF-1 | NVPF-2 | NVPF-3 |
|---|---|---|---|
| E A1 (V) | 3.455 | 3.455 | 3.497 |
| E A2 (V) | 3.750 | 3.748 | 3.757 |
| E A3 (V) | 4.235 | 4.225 | 4.236 |
| E C1 (V) | 3.177 | 3.202 | 3.151 |
| E C2 (V) | 3.589 | 3.605 | 3.574 |
| E C3 (V) | 4.125 | 4.117 | 4.090 |
| ΔEA1–C1 (V) | 0.278 | 0.253 | 0.346 |
| ΔEA2–C2 (V) | 0.161 | 0.143 | 0.183 |
| ΔEA3–C3 (V) | 0.110 | 0.108 | 0.146 |
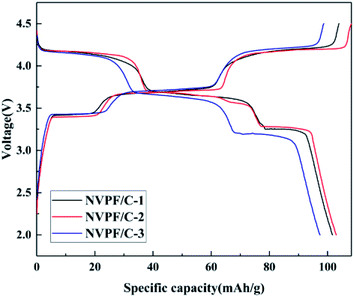
The charge–discharge profiles of the NVPF/C composites at 0.2C are presented in Fig. 8. The initial discharge capacity of NVPF/C-1, NVPF/C-2 and NVPF/C-3 at 0.2C is about 101.7, 130 and 97.6 mA h g−1, respectively. Obviously, NVPF/C-2 shows a higher specific capacity among the three NVPF/C composites. The charge–discharge curves possess three separate reduction plateaus at about 4.2, 3.7 and 3.4 V, corresponding to the characteristic V4+/V3+ redox couple.28 Consistent with the conclusion from the cyclic voltammetry results, three pairs of peaks were produced owing to the division of the Na(2) ion extraction/insertion into two steps.17 Obviously, the voltage gap between the charging and discharging plateaus of the NVPF/C-2 electrode is narrower than those of NVPF/C-1 and NVPF/C-3, which indicates that it has the faster diffusion rate for Na+ and enhanced redox kinetics.9
The cycle and rate performance of the NVPF/C composites were studied using CR2032 coin cells. As shown in Fig. 9a, the NVPF/C-2 delivered a discharge capacity of 103, 101.5, 99.8, 98.2, 96 and 95 mA h g−1 at 0.2, 0.5, 1, 2, 5 and 10C, respectively. The electric polarization of the battery enhanced with the increase in the current density. In spite of this, the charge and discharge plateaus can be clearly distinguished. From Fig. 9b, the specific capacity of the three samples almost recovered to the same capacity of the first ten cycles when the current returned to 0.2C, which indicates that the NVPF/C composites have excellent reversibility. In addition, the rate performance of NVPF/C-2 is superior to that of NVPF/C-1 and NVPF/C-3, which is attributed to the following reasons: the electronic conductivity of the NVPF/C composite increases as the carbon content increases.17 Furthermore, a larger specific surface area is beneficial to the ion diffusion, which gives rise to the performance of NVPF/C-2 being better than that of NVPF/C-1. However, serious nanoparticle aggregation can be observed in samples with a carbon content that is too high, which hinders the diffusion of Na ions. In addition, too much carbon will hinder the penetration of the electrolyte solution and the diffusion of Na+ in the carbon layers,29 which results in a sharp degradation in the performance of NVPF/C-3.
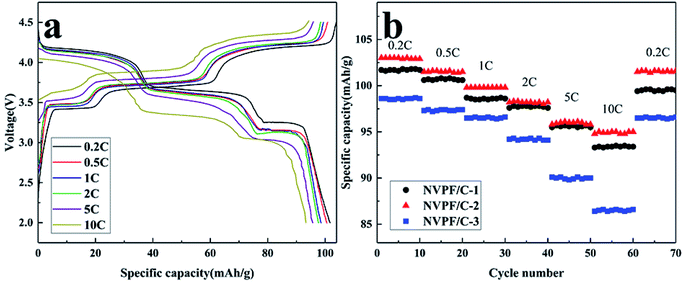 | ||
| Fig. 9 (a) Charge–discharge profiles of the NVPF/C-2 composite at various current densities; (b) rate performances of the NVPF/C composites. | ||
To investigate the capacity retention properties of the NVPF/C composites, the cycle performance was studied at 5C (Fig. 10). As presented in Fig. 10a, NVPF/C-2 delivered a discharge capacity of 96, 95, 93.9, 92.3, 90.3 and 88.2 mA h g−1 after 1, 100, 200, 300, 400 and 500 cycles at 5C, respectively. The repeatability of different cycles also shows that NVPF/C-2 has good structural stability. The cycle performance of the NVPF/C composites at 5C is presented in Fig. 10b. The first cycle capacity of the three samples at 5C is about 93.7, 96 and 88 mA h g−1. After 500 cycles, the capacity retention is about 90.1%, 91.9% and 88.1% for the three samples. The results above indicate that the NVPF/C-2 sample showed a better capacity retention than the NVPF/C-1 and NVPF/C-3 samples.
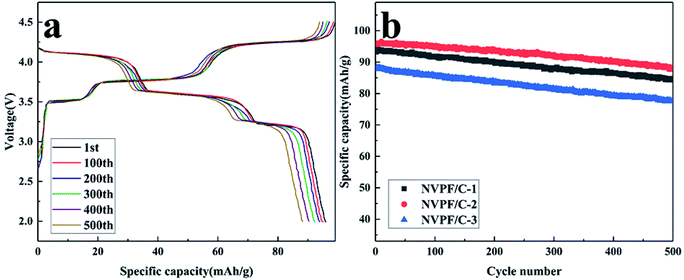 | ||
| Fig. 10 (a) Charge–discharge profiles of the NVPF/C-2 composite at various cycle numbers; (b) cycling performance of the NVPF/C composites at 5C. | ||
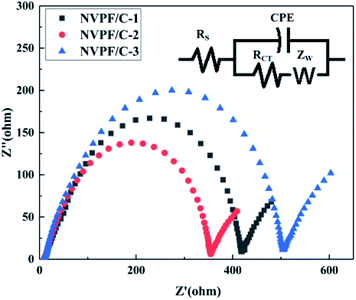
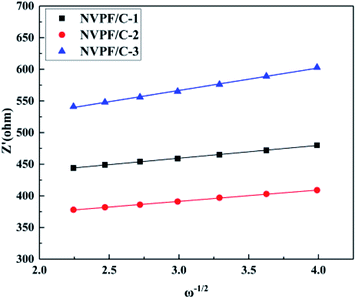
To further illustrate the improved properties of the moderately carbon-coated samples, the kinetic properties of the composites were investigated by EIS analysis, which was measured after 10 cycles. Nyquist plots and the equivalent circuit diagram fitted by the ZSimpWin software are presented in Fig. 11. The intercept in low frequency indicates an internal resistance (RS) involving resistance of the electrolyte and electrode.30 The dimension of the semicircle represents the transfer resistance (RCT) between the electrolyte and the electrode.2ZW represents the Warburg impedance of the sodium ion diffusion within the electrode.29 The diffusion coefficient is calculated using the following equations:
| D = R2T2/2A2n4F4C2σ2 |
| Z′ = RS + RCT + σω−1/2 |
| Sample | R S (Ω cm−2) | R CT (Ω cm−2) | σ (Ω cm2 s−1/2) | D (cm2 s−1) |
|---|---|---|---|---|
| NVPF/C-1 | 8.59 | 409.41 | 20.34 | 2.13 × 10⁻¹² |
| NVPF/C-2 | 8.48 | 345.52 | 17.98 | 2.71 × 10⁻¹² |
| NVPF/C-3 | 8.73 | 495.27 | 35.60 | 6.94 × 10⁻¹³ |
4. Conclusion
An NVPF/C cathode material with pitch as a carbon source was synthesized via a solid-state method at an optimum temperature of 700 °C, and the electrochemical performance and kinetic properties were investigated. These test outcomes demonstrated that the NVPF/C-2 composite with a carbon content of 12.14 wt% showed an excellent rate performance and cycle stability. NVPF/C presented a capacity of 103 and 95 mA h g−1 at 0.2 and 10C, respectively, and had an outstanding retention of 91.9% after 500 cycles at 5C. These excellent properties of the NVPF/C-2 composite are attributed to the high ion diffusion coefficient and small charge transfer impedance. Therefore, the preparation of NVPF/C with pitch has good prospects for Na-ion rechargeable batteries.Conflicts of interest
There are no conflicts of interest to declare.Acknowledgements
This project was financially supported by the National Nature Science Foundation of China (No. 21771062, 21576030 and U1607127), the Research Fund of Hunan Provincial Education Department (18A366), the project supported by the Hunan Provincial Science and Technology Plan, China (No. 2016TP1007), the Opening Project of Material Corrosion and Protection Key Laboratory of Sichuan Province of China (No. 2018CL15).References
- T. Liu, Y. Zhang, Z. Jiang, X. Zeng, J. Ji, Z. Li, X. Gao, M. Sun, Z. Lin, M. Ling, J. Zheng and C. Liang, Exploring competitive features of stationary sodium ion batteries for electrochemical energy storage, Energy Environ. Sci., 2019, 12, 1512–1533 RSC.
- W. Zheng, R. Gao, T. Zhou and X. Huang, Enhanced electrochemical performance of Na3V2(PO4)3 with Ni2+ doping by a spray drying-assisted process for sodium ion batteries, Solid State Ionics, 2018, 324, 183–190 CrossRef CAS.
- N. V. Kosova, D. O. Rezepova, S. A. Petrov and A. B. Slobodyuk, Electrochemical and Chemical Na+/Li+ Ion Exchange in Na-Based Cathode Materials: Na1.56Fe1.22P2O7 and Na3V2(PO4)2F3, J. Electrochem. Soc., 2017, 1, A6192–A6200 CrossRef.
- G. Hu, P. Chen, Z. Liu, Y. Cao, Z. Zhang, Z. Peng and D. Ke, Synthesis and electrochemical properties of xLiFePO4 (1 − x)Na3V2(PO4)2F3/C composite for lithium-ion batteries, J. Alloys Compd., 2017, 696, 177–184 CrossRef CAS.
- M. Law and P. Balaya, NaVPO4F with high cycling stability as a promising cathode for sodium-ion battery, Energy Storage Materials, 2018, 10, 102–113 CrossRef.
- C. Chang, Y. Li, W. He, G. Li, W. Guo, P. Zhu, M. Yao and J. Feng, NaVPO4F prepared under air as a cathode material for sodium-ion batteries, Mater. Lett., 2017, 209, 82–85 CrossRef CAS.
- L. Sharma, K. Nakamoto, R. Sakamoto, S. Okada and P. Barpanda, Na2FePO4F Fluorophosphate as Positive Insertion Material for Aqueous Sodium-Ion Batteries, ChemElectroChem, 2019, 6, 444–449 CrossRef CAS.
- K. Kubota, K. Yokoh, N. Yabuuchi and S. Komaba, Na2CoPO4F as a High-voltage Electrode Material for Na-ion Batteries, Electrochemistry, 2014, 82, 909–911 CrossRef CAS.
- C. Shen, H. Long, G. Wang, W. Lu, L. Shao and K. Xie, Na3V2(PO4)2F3@C dispersed within carbon nanotube frameworks as a high tap density cathode for high-performance sodium-ion batteries, J. Mater. Chem. A, 2018, 6, 6007–6014 RSC.
- D. Ma, L. Zhang, T. Li, C. Liu, G. Liang, Y. Zhou and X. Yang, Enhanced electrochemical performance of carbon and aluminum oxide co-coated Na3V2(PO4)2F3 cathode material for sodium ion batteries, Electrochim. Acta, 2018, 283, 1441–1449 CrossRef CAS.
- L. Li, Y. Xu, X. Sun, S. He and L. Li, High capacity-favorable tap density cathode material based on three-dimensional carbonous framework supported Na3V2(PO4)2F3 nanoparticles, Chem. Eng. J., 2018, 331, 712–719 CrossRef CAS.
- B. Shen, Y. You, Y. Niu, Y. Li, C. Dai, L. Hu, B. Guo, J. Jiang, S. Bao and M. Xu, Improving the Performance of Hard Carbon//Na3V2O2(PO4)2F Sodium-Ion Full Cells by Utilizing the Adsorption Process of Hard Carbon, ACS Appl. Mater. Interfaces, 2018, 10, 16581–16587 CrossRef CAS.
- Y. Yin, F. Xiong, C. Pei, Y. Xu, Q. An, S. Tan, Z. Zhuang, J. Sheng, Q. Li and L. Mai, Robust three-dimensional graphene skeleton encapsulated Na3V2O2(PO4)2F nanoparticles as a high-rate and long-life cathode of sodium-ion batteries, Nano Energy, 2017, 41, 452–459 CrossRef CAS.
- R. Gover, A. Bryan, P. Burns and J. Barker, The electrochemical insertion properties of sodium vanadium fluorophosphate, Na3V2(PO4)2F3, Solid State Ionics, 2006, 177, 1495–1500 CrossRef CAS.
- N. V. Kosova and D. O. Rezepova, Insertion compounds prepared via mechanochemically assisted solid state way for advanced hybrid-ion batteries, Mater. Today: Proc., 2017, 4, 4496–4501 Search PubMed.
- P. Serras, V. Palomares, A. Goñi, I. Gil De Muro, P. Kubiak, L. Lezama and T. Rojo, High voltage cathode materials for Na-ion batteries of general formula Na3V2O2x(PO4)2F3−2x, J. Mater. Chem., 2012, 22, 22301 RSC.
- W. Song and S. Liu, A sodium vanadium three-fluorophosphate cathode for rechargeable batteries synthesized by carbothermal reduction, Solid State Sci., 2013, 15, 1–6 CrossRef CAS.
- J. Zhao, X. Yang, Y. Yao, Y. Gao, Y. Sui, B. Zou, H. Ehrenberg, G. Chen and F. Du, Moving to Aqueous Binder: A Valid Approach to Achieving High-Rate Capability and Long-Term Durability for Sodium-Ion Battery, Adv. Sci., 2018, 5, 1700768 CrossRef.
- P. R. Kumar, Y. H. Jung and D. K. Kim, Influence of carbon polymorphism towards improved sodium storage properties of Na3V2O2x(PO4)2F3−2x, J. Solid State Electrochem., 2017, 21, 223–232 CrossRef CAS.
- Y. Yao, L. Zhang, Y. Gao, G. Chen, C. Wang and F. Du, Assembly of Na3V2(PO4)2F@C nanoparticles in reduced graphene oxide enabling superior Na+ storage for symmetric sodium batteries, RSC Adv., 2018, 8, 2958–2962 RSC.
- Q. Liu, X. Meng, Z. Wei, D. Wang, Y. Gao, Y. Wei, F. Du and G. Chen, Core/Double-Shell Structured Na3V2(PO4)2F3@C Nanocomposite as the High Power and Long Lifespan Cathode for Sodium-Ion Batteries, ACS Appl. Mater. Interfaces, 2016, 8, 31709–31715 CrossRef CAS.
- H. Yi, M. Ling, W. Xu, X. Li, Q. Zheng and H. Zhang, VSC-doping and VSU-doping of Na3V2−xTix(PO4)2F3 compounds for sodium ion battery cathodes: Analysis of electrochemical performance and kinetic properties, Nano Energy, 2018, 47, 340–352 CrossRef CAS.
- W. Liu, H. Yi, Q. Zheng, X. Li and H. Zhang, Y-Doped Na3V2(PO4)2F3 compounds for sodium ion battery cathodes: electrochemical performance and analysis of kinetic properties, J. Mater. Chem. A, 2017, 5, 1928–1935 Search PubMed.
- L. Deng, G. Sun, K. Goh, L. Zheng, F. Yu, X. Sui, L. Zhao and Z. Wang, Facile one-step carbothermal reduction synthesis of Na3V2(PO4)2F3/C serving as cathode for sodium ion batteries, Electrochim. Acta, 2019, 298, 459–467 CrossRef CAS.
- T. Jiang, G. Chen, A. Li, C. Wang and Y. Wei, Sol-gel preparation and electrochemical properties of Na3V2(PO4)2F3/C composite cathode material for lithium ion batteries, J. Alloys Compd., 2009, 478, 604–607 CrossRef CAS.
- X. Huang, X. Li, H. Wang, Z. Pan, M. Qu and Y. Zuolong, Synthesis and electrochemical performance of Li2FeSiO4/C as cathode material for lithium batteries, Solid State Ionics, 2010, 181, 1451–1455 CrossRef CAS.
- C. An, Y. Yuan, B. Zhang, L. Tang, B. Xiao, Z. He, J. Zheng and J. Lu, Graphene Wrapped FeSe2 Nano-Microspheres with High Pseudocapacitive Contribution for Enhanced Na–Ion Storage, Adv. Energy Mater., 2019, 9, 1900356 CrossRef.
- W. Song, X. Ji, J. Chen, Z. Wu, Y. Zhu, K. Ye, H. Hou, M. Jing and C. E. Banks, Mechanistic investigation of ion migration in Na3V2(PO4)2F3 hybrid-ion batteries, Phys. Chem. Chem. Phys., 2015, 17, 159–165 RSC.
- W. Zheng, X. Huang, Y. Ren, H. Wang, S. Zhou, Y. Chen, X. Ding and T. Zhou, Porous spherical Na3V2(PO4)3/C composites synthesized via a spray drying-assisted process with high-rate performance as cathode materials for sodium-ion batteries, Solid State Ionics, 2017, 308, 161–166 CrossRef CAS.
- S. Zheng, D. Liu, L. Tao, X. Fan, K. Liu, G. Liang, A. Dou, M. Su, Y. Liu and D. Chu, Electrochemistry and redox characterization of rock-salt-type lithium metal oxides Li1+z/3Ni1/2−z/2Ti1/2+z/6O2 for Li-ion batteries, J. Alloys Compd., 2019, 773, 1–10 CrossRef CAS.
- H. Xiao, X. Huang, Y. Ren, H. Wang, J. Ding, S. Zhou, X. Ding and Y. Chen, Enhanced sodium ion storage performance of Na3V2(PO4)3 with N-doped carbon by folic acid as carbon-nitrogen source, J. Alloys Compd., 2018, 732, 454–459 CrossRef CAS.
| This journal is © The Royal Society of Chemistry 2019 |

