 Open Access Article
Sulfonated component-incorporated quaternized poly(phthalazinone ether ketone) membranes with improved ion selectivity, stability and water transport resistance in a vanadium redox flow battery
Yuning Chen ,
Shouhai Zhang
 *,
Qian Liu and
Xigao Jian
State Key Laboratory of Fine Chemicals, School of Chemical Engineering, Dalian University of Technology, High Performance Polymer Engineering Research Center, Dalian, 116024, China. E-mail: zhangshh@dlut.edu.cn
First published on 20th August 2019
Abstract
Novel poly(phthalazinone ether ketone)-based amphoteric ion exchange membranes with improved ion selectivity, stability and water transport resistance were prepared for vanadium redox flow battery (VRB) applications. The preparation method ensured the absence of electrostatic interaction. A small amount of sulfonated poly(phthalazinone ether ketone) (SPPEK) with different ion exchange capacity (IEC) values was mixed with brominated poly(phthalazinone ether ketone) (BPPEK) to prepare base membranes with the solution casting method, and they were aminated in trimethylamine to obtain the resulting membranes (Q/S-x, x represents the IEC value of SPPEK). Compared with the AEM counterpart (QBPPEK) prepared from the amination of the BPPEK membrane, Q/S-1.37 showed lower swelling ratio and area resistance (R). The R value of Q/S-1.37 (0.58 Ω cm2) was close to that of Nafion115. The VO2+ and V3+ permeability values of Q/S-x were 96.7–97.6% and 98.5–99.2% less than those of Nafion115, respectively, demonstrating the excellent ion selectivity of Q/S-x. Compared with Nafion115 and QBPPEK, Q/S-1.37 displayed 90.0% and 92.1% decrease in the static water transport volume and 93.2% and 66.7% decrease in the cycling transport rate, respectively, revealing good water transport resistance. Compared with Nafion115, Q/S-1.37 exhibited an increase of 1.0–5.7% in the coulombic efficiency (CE) and an increase of 2.5–8.7% in the energy efficiency (EE) at 20–200 mA cm−2. Q/S-x showed better chemical stability in VO2+ solutions than QBPPEK. VRB with Q/S-1.37 could be steadily operated for 400 h without sudden capacity and efficiency drop, while VRB with QBPPEK could hold for only around 250 h. Q/S-1.37 retained higher CE, EE and capacity retention than Nafion115, displaying good long-term stability. Thus, the Q/S-x are promising for use in commercial VRBs.
1. Introduction
A vanadium redox flow battery (VRB) is a type of energy storage device patented by M. Skyllas-Kazacos et al.1,2 Based on the redox reaction of vanadium ions with different valences, VRBs ensure the elimination of electrolyte contamination.3,4 Due to the features of cost competitiveness, long lifetime, fast response speed, etc., VRBs have attracted considerable attention from researchers.4–7 Recently, the VRB system has been considered to have potential to be used in the storage of intermittent energy.8,9 Ion exchange membranes (IEMs), one of the crucial ingredients in VRBs, are required to separate active vanadium species in two electrodes and ensure charge balance.4,10,11 The features of ideal IEMs used in VRBs include cost competitiveness, low area resistance, good vanadium ion resistance, high chemical stability and water transport resistance.4,7,12 The Nafion series of Dupont, a type of commercial cation exchange membrane (CEM), exhibit low area resistance and excellent chemical stability in the VRB system.13,14 However, the drawbacks of serious vanadium ion crossover and increased cost hinder further commercial applications in VRB operations, and the former always leads to capacity decay and electrolyte flooding.4,11 The improved VRB comprehensive performance was achieved by employing modified Nafion membranes, but these membranes still suffered from the disadvantage of high costs.15–18Currently, some aromatic polymers are being actively explored to prepare CEMs and anion exchange membranes (AEMs) for VRBs.12,19–31 Generally, CEMs with anionic groups (most often sulfonic groups) possess desirable proton conductivity but suffer from serious vanadium ion crossover. On the contrary, AEMs with cationic groups, including quaternary ammonium, imidazolium and pyridinium groups, can effectively constrict vanadium ion contamination and self-discharge due to the Donnan exclusion effect. However, AEMs in VRBs suffer from undesirable conductivity. Amphoteric ion exchange membranes (AIEMs) are encouraged to realize a competitive VRB performance with the aid of cationic and anionic groups. For AIEM preparation, researchers have conducted substantial efforts. Qiu et al. explored a number of AIEMs by grafting styrene and dimethylaminoethyl methacrylate into the substrate materials: PVDF and ETFE.32,33 Anionic and cationic groups were incorporated by sulfonation and protonation processes, respectively. The resulting ETFE-based AIEM displayed comparable conductivity and much lower vanadium ion permeability over Nafion117, with which VRBs could be operated for 40 cycles.32 Lee et al. explored AIEMs based on a micro-porous polyethylene (PE) substrate. Sulfonic acid and quaternary ammonium groups were incorporated through the photo-polymerization of PE, vinyl sulfonic acid and (vinylbenzyl)trimethylammonium chloride under UV radiation. Compared with Nafion117, the resulting AIEM exhibited 92.3% decrease in vanadium ion permeability.34 Layer-by-layer self-assembly was also employed to fabricate AIEMs.35,36 The performance of the resulting AIEMs depended on the count of bilayers for negatively and positively charged polymers. Cationic and anionic group-functionalized polymers were synthesized for AIEM preparation.37–39 For example, Liao et al. synthesized a fluoro-methyl sulfonated poly(arylene ether ketone)-bearing benzimidazole moiety to prepare AIEMs, which displayed 3.6% increase in coulombic efficiency (CE) and comparable voltage efficiency (VE) over Nafion117.37 These AIEMs displayed a competitive VRB performance, but the preparation methods were multistep and complex.
Blending is a simple and attractive way to modify membranes by combining the excellent quality of components and overcoming the disadvantages of some components.7 It has been developed to prepare composite membranes for VRBs through polymer blending or nanofiller incorporation.40–45 Some labs have explored AIEMs by mixing basic and acidic polymers. The AIEMs prepared from sulfonated poly(ether ether ketone) (SPEEK) and polymers with a benzimidazole moiety displayed excellent vanadium ion resistance.46,47 Acid–base pairs always appeared in this direct blending, which may result in the formation of precipitates or nonuniform structures, leading to the performance degradation of the resulting membranes.48,49 Furthermore, acid–base interactions can reduce the swelling ratio and occupy some conductive groups, hindering the improvement in conductivity. Cao et al. blended sulfonated polyimide with functionalized graphene oxide containing both sulfonic and quaternary ammonium groups to prepare AIEMs, which exhibited 9% increase in energy efficiency (EE) over Nafion117.50 Liu et al. reported that SPEEK and quaternized poly(ether imide) could be mixed to prepare AIEMs.51 The resulting AIEMs exhibited better vanadium ion resistance than SPEEK and Nafion117 and maximum EE of 88.45% in VRBs. He's group explored a number of AIEMs obtained from SPEEK and imidazolium-based PSF, which possessed close area resistance and lower vanadium permeability compared with Nafion212.52,53 In these studies, the electrostatic interactions of cationic and anionic groups may lead to the poor compatibility of components and polymer precipitation in the casting solution. Furthermore, the resulting non-uniform membrane structure deteriorated the properties of VRBs.
In this work, we reported novel AIEMs based on poly(phthalazinone ether ketone). Our lab has explored a number of AEMs based on poly(phthalazinone ether)s with quaternary ammonium or pyridinium groups, which exhibited much lower vanadium ion permeability than the Nafion counterpart.20,23,29 However, further improvement in ion conductivity is necessary. The sulfonated poly(phthalazinone ether ketone)-based CEMs with increased ion exchange capacity (IEC) showed lower area resistance than Nafion115, while the corresponding ion selectivity could be improved.54 AIEMs based on poly(phthalazinone ether ketone) have the potential to combine the advantages of previous CEMs and AEMs, thus realizing a competitive VRB performance. Recently, brominated poly(phthalazinone ether ketone) (BPPEK) and sulfonated poly(phthalazinone ether ketone) (SPPEK) with the ion exchange capacity (IEC) values of 0.70 and 1.37 mmol g−1, respectively, were used for the preparation of blend-based membranes with 30% SPPEK loading. Then, Na-substituted blend-based membranes were successively quaternized to obtain the resulting membranes (Q/S-x), where x represents the IEC value of SPPEK (IECs). Compared with the previous preparation methods of radiation grafting, layer-by-layer self-assembly and polymerization, this AIEM fabrication process is simple and easy to realize. During this preparation process, sulfonic acid and quaternary ammonium groups were separately incorporated into Q/S-x through a blending and amination process. This could avoid the poor compatibility of components due to electrostatic interactions in the case of directing blending, thus ensuring compact and uniform morphology. The hydrophilic SPPEK component in Q/S-x was conducive for improving conductivity. Furthermore, based on the fact that the BPPEK component obviously swelled, while the Na-substituted SPPEK component remained nearly invariable during the amination process, the SPPEK component could restrict membrane swelling in the amination process and make the structure of Q/S-x dense, thus improving the dimensional stability and duration of VRB operation. The water uptake, swelling ratio, area resistance, mechanical property, chemical stability and long-term VRB performance of Q/S-x were determined in detail and compared with those of Nafion115 and the AEM counterpart (QBPPEK) prepared from the amination of BPPEK membrane. The low swelling ratio and quaternary ammonium groups allowed Q/S-x to achieve competitive vanadium ion resistance. The vanadium species in VRBs display distinct permeability due to the difference in ion radius and valence.55,56 In addition, according to previous reports, CEMs and AEMs exhibit different sequence of the permeability of vanadium ions with varied valences.15,54,57 This indicated the distinct effect of the cation and anion exchange groups on the permeability of different vanadium species. It was speculated that the permeability of individual vanadium ions was tuneable in Q/S-x by changing the ionic group content. A consequent effect on the water transport in VRBs was observed, which was partially derived from the hydration of the diffusing vanadium ions.11,58–67 Water transport causes numerous issues including electrolyte imbalance, vanadium salt precipitation and capacity decay, ultimately leading to the failure of the VRB operation.11,58–67 Moreover, water transport resistance needs to be considered as an assessment for membrane candidates. As reported, anionic groups drive the water transport to the positive electrode due to the hydration of V3+/V2+, while cationic groups benefit the water transfer to the negative electrode under the hydration of VO2+/VO2+.58 Therefore, by encountering water transfer in the opposite direction, the Q/S-x materials are promising to possess good water transfer resistance. In this work, the V3+ and VO2+ permeability and water transport properties of Q/S-x and QBPPEK were compared and investigated, which has been rarely reported in previous works.
2. Experimental
2.1 Materials
4-(3,5-Dimethyl-4-hydroxyphenyl)(2H)-phthalazin-1-one (DMDHPZ, 99.0%), 4(4-hydroxyphenyl)(2H)-phthalazin-1-one (DHPZ, 99.0%) and 4,4′-difluorobenzophenone (DFB, 99.0%) were purchased from Dalian Polymer New Material Co. Ltd., China. Trimethylamine (TMA, 33 wt%), N-methyl-2-pyrrolidinone (NMP, 99.0%), hydrochloric acid (HCl, 36%), N-bromosuccinimide (NBS, 98.0%), 1,1,2,2-tetrachloroethane (99.0%), and concentrated sulfuric acid (H2SO4, 95–98%) were used without further purification, and other reagents were of analytical grade.2.2 Preparation of polymers and Q/S-x membranes
According to a previously reported study, DMDHPZ, DHPZ and DFB with the mole ratio of 9![[thin space (1/6-em)]](https://www.rsc.org/images/entities/char_2009.gif) :
:![[thin space (1/6-em)]](https://www.rsc.org/images/entities/char_2009.gif) 1
1![[thin space (1/6-em)]](https://www.rsc.org/images/entities/char_2009.gif) :
:![[thin space (1/6-em)]](https://www.rsc.org/images/entities/char_2009.gif) 10 were employed to synthesize poly(ether ketone) containing 3,5-dimethyl phthalazinone moieties (DMPPEK) via a condensation polymerization process (Fig. 1a).23 Similarly, poly(phthalazinone ether ketone) (PPEK) was prepared from DHPZ and DFB in an equimolar ratio. Brominated poly(phthalazinone ether ketone) (BPPEK) with the degree of substitution (DS) of 95% was prepared from DMPPEK dissolved in 1,1,2,2-tetrachloroethane with NBS as the bromination agent.23 The mole ratio of NBS and methyl in DMPPEK was set at 0.7
10 were employed to synthesize poly(ether ketone) containing 3,5-dimethyl phthalazinone moieties (DMPPEK) via a condensation polymerization process (Fig. 1a).23 Similarly, poly(phthalazinone ether ketone) (PPEK) was prepared from DHPZ and DFB in an equimolar ratio. Brominated poly(phthalazinone ether ketone) (BPPEK) with the degree of substitution (DS) of 95% was prepared from DMPPEK dissolved in 1,1,2,2-tetrachloroethane with NBS as the bromination agent.23 The mole ratio of NBS and methyl in DMPPEK was set at 0.7![[thin space (1/6-em)]](https://www.rsc.org/images/entities/char_2009.gif) :
:![[thin space (1/6-em)]](https://www.rsc.org/images/entities/char_2009.gif) 1. Sulfonated poly(phthalazinone ether ketone) (SPPEK) materials with the ion exchange capacities (IECs) of 0.70 and 1.37 mmol g−1 were prepared through the sulfonation of PPEK by varying the reaction temperature and time.68 Concentrated sulfuric acid and fuming sulfuric acid were employed as solvent and sulfonating agent, respectively. The preparation process of Q/S-x is shown in Fig. 1b. By using the solution casting method, blend-based membranes were obtained from 13 wt% solutions of BPPEK and SPPEK dissolved in NMP, and the mass ratio of BPPEK to SPPEK was fixed at 7/3. Blend-based membranes on slick glass plates were evaporated at 60 °C for 4 h. To avert the reaction of TMA and sulfonic acid groups during the following quaternary amination process, blend-based membranes were exposed to an NaCl solution at an ambient temperature to achieve complete substitution. Then, Na-substituted blend-based membranes were directly placed in a TMA solution for two days at 40 °C to introduce the quaternary ammonium groups. Residual TMA was rinsed off with 5 wt% HCl to obtain the resulting membranes (Q/S-x), where x is the IEC of SPPEK (IECs). Pristine counterparts were prepared from BPPEK and SPPEK, and the resulting membranes were denoted as QBPPEK and SPPEK-x.
1. Sulfonated poly(phthalazinone ether ketone) (SPPEK) materials with the ion exchange capacities (IECs) of 0.70 and 1.37 mmol g−1 were prepared through the sulfonation of PPEK by varying the reaction temperature and time.68 Concentrated sulfuric acid and fuming sulfuric acid were employed as solvent and sulfonating agent, respectively. The preparation process of Q/S-x is shown in Fig. 1b. By using the solution casting method, blend-based membranes were obtained from 13 wt% solutions of BPPEK and SPPEK dissolved in NMP, and the mass ratio of BPPEK to SPPEK was fixed at 7/3. Blend-based membranes on slick glass plates were evaporated at 60 °C for 4 h. To avert the reaction of TMA and sulfonic acid groups during the following quaternary amination process, blend-based membranes were exposed to an NaCl solution at an ambient temperature to achieve complete substitution. Then, Na-substituted blend-based membranes were directly placed in a TMA solution for two days at 40 °C to introduce the quaternary ammonium groups. Residual TMA was rinsed off with 5 wt% HCl to obtain the resulting membranes (Q/S-x), where x is the IEC of SPPEK (IECs). Pristine counterparts were prepared from BPPEK and SPPEK, and the resulting membranes were denoted as QBPPEK and SPPEK-x.
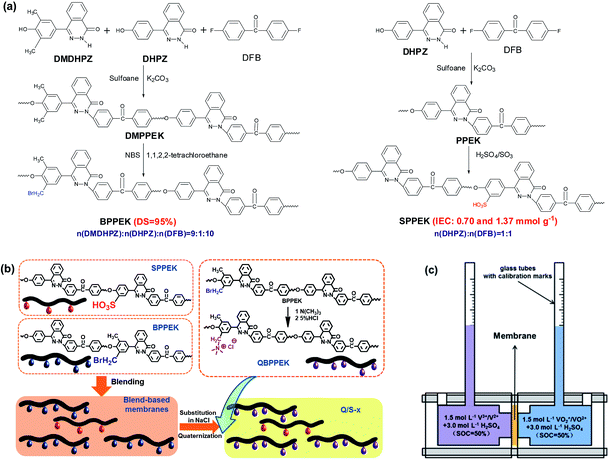 | ||
| Fig. 1 (a) Synthesis of BPPEK and SPPEK. (b) The schematic diagram of Q/S-x preparation process. (c) The cell for static water transport test. | ||
2.3 Characterization of membranes
The Fourier transform infrared (FTIR) analysis of membranes was conducted by an FTIR spectrometer (Nicolet 6700). The microstructure and element mapping of membrane samples were detected by scanning electron microscopy (SEM, FEI Quanta 450).The cation and anion exchange capacities (IECc and IECa) of Q/S-x were investigated using the titration method at room temperature. For IECa gauging, original Q/S-x (in chloride form) was preferentially immersed in NaNO3 for two days. The resulting solutions were titrated by AgNO3 using K2CrO4 as an indicator, and then the volume of AgNO3 solution was recorded.
Weighted dry Q/S-x samples (in hydrogen form) were incubated in NaCl for 72 h. IECc was determined by titrating the soaking solution with NaOH using phenolphthalein as an indicator. The volume of the consumed NaOH was then recorded.
Before the test of water uptake (WU), the Q/S-x samples in initial conditions were saturated in deionized water for one day. The weight of wet Q/S-x (mw) was immediately gauged after being rubbed using an absorbent paper to remove the surface water. The weight of dry Q/S-x (md) heated in vacuum (at 60 °C for 48 h) was measured, and WU was calculated using the following equation:
 | (1) |
As an index to evaluate dimensional stability, the swelling ratios (SRs) of Q/S-x in water and VOSO4 solution were investigated, which were named as SR(H2O) and SR(VOSO4), respectively. First, the lengths of dry Q/S-x (ld) after placing in vacuum of 60 °C for two days were gauged. Then, the lengths of wet Q/S-x (lw) after soaking in deionized water and 1.5 mol L−1 VOSO4/3.0 mol L−1 H2SO4 for one day at room temperature were detected. SR was obtained using the following equation:
 | (2) |
Following a previously reported method, area resistance (R) measurement of Q/S-x was implemented in a self-made electrical cell including two compartments containing 2.0 mol L−1 VOSO4/3.0 mol L−1 H2SO4.23 A membrane equilibrated with experimental solutions was immobilized by two half-cells with the active area (S). Moreover, r1 (the resistance of the equipment without a membrane) and r2 (the resistance of the equipment with a membrane) were tested by electrochemical impedance spectroscopy (EIS) and were employed to calculate R using the following equation:
| R = (r2 − r1) × S | (3) |
According to a previously reported procedure,23 a diffusion apparatus with two half-cells was employed to gauge vanadium ion permeability of membranes, which contained 1.0 mol L−1 VO2+ or V3+/2.5 mol L−1 H2SO4 and 1.0 mol L−1 MgSO4/2.5 mol L−1 H2SO4, respectively. MgSO4 solutions for the gauging process functioned to minimize osmotic pressure and balance ionic strength. VO2+ and V3+ concentrations in the MgSO4 side were determined using a UV-visible spectrophotometer at 765 and 605 nm. The mass transfer coefficient (Ks) of VO2+ and V3+ was calculated using the following equation:
 | (4) |
![[thin space (1/6-em)]](https://www.rsc.org/images/entities/char_2009.gif) B0 is the original absorbance of VO2+ or V3+ solution, abs
B0 is the original absorbance of VO2+ or V3+ solution, abs![[thin space (1/6-em)]](https://www.rsc.org/images/entities/char_2009.gif) A and VA represent the absorbance and volume of MgSO4, respectively, A is the active area, and t refers to the time interval of taking samples from the MgSO4 side.
A and VA represent the absorbance and volume of MgSO4, respectively, A is the active area, and t refers to the time interval of taking samples from the MgSO4 side.
The static water transport testing of membranes followed a previously reported procedure.58 As shown in Fig. 1b, the water transport volume was evaluated through the calibration marks of glass tubes in a diffusion cell. One half-cell was filled with 1.5 mol L−1 VO2+/VO2+ in 3.0 mol L−1 H2SO4 at the state of charge (SOC) of 50% and the other contained 1.5 mol L−1 V3+/V2+ in 3.0 mol L−1 H2SO4 at the same SOC. The initial volume in each half-cell was 45 mL, and the effective area of membrane samples was 24.8 cm2.
2.4 VRB performance
Following a previously reported procedure,23 a VRB system housed by frames was constructed to conduct charge/discharge tests, in which a membrane was sandwiched by carbon felts and graphite current collectors. We circularly pumped 33 mL of 1.5 mol L−1 VO2+/VO2+ in 3.0 mol L−1 H2SO4 and 33 mL of 1.5 mol L−1 V3+/V2+ in 3.0 mol L−1 H2SO4 into two electrodes. The test was implemented by the CT-3008-5V/3A battery testing system (Neware in Shenzhen) with terminal voltages of 1.7 V and 0.8 V. The active area of the membrane samples was 5 cm2. The CE, VE and EE of membranes were obtained according to a previous report.23 The single cell and cycling test of all membrane samples was carried out three times.2.5 Chemical stability
As reported in previous studies, the chemical stability of Q/S-x was evaluated by dipping in VO2+ solutions. Q/S-x was immersed in 1.5 mol L−1 VO2+/3.0 mol L−1 H2SO4 for 60 days at 25 °C.66,69 The weight loss and properties of soaked Q/S-x were gauged. Weight loss was obtained through the following equation:
 | (5) |
During the immersion procedure in 0.1 mol L−1 VO2+/3.0 mol L−1 H2SO4, VO2+ (yellow) would be reduced to VO2+ (blue) by membranes. The colour and VO2+ concentration of solutions were recorded after 56 days.
3. Results and discussion
3.1 Characterization of membranes
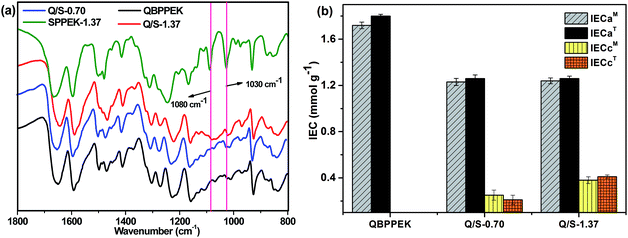
As displayed in the FTIR spectra (Fig. 2a), compared with QBPPEK, Q/S-1.37 exhibited characteristic absorption peaks at around 1030 and 1080 cm−1, which were ascribed to the symmetric stretching of O![[double bond, length as m-dash]](https://www.rsc.org/images/entities/char_e001.gif) S
S![[double bond, length as m-dash]](https://www.rsc.org/images/entities/char_e001.gif) O and stretching of O
O and stretching of O![[double bond, length as m-dash]](https://www.rsc.org/images/entities/char_e001.gif) S, respectively. This suggested the incorporation of sulfonic acid groups into Q/S-1.37. Moreover, the absence of the peak at 1080 cm−1 for Q/S-0.70 may be because the content of sulfonic acid groups is low.
S, respectively. This suggested the incorporation of sulfonic acid groups into Q/S-1.37. Moreover, the absence of the peak at 1080 cm−1 for Q/S-0.70 may be because the content of sulfonic acid groups is low.
The IEC results shown in Fig. 2b confirmed that Q/S-1.37 and Q/S-0.70 possessed both anion and cation exchange groups, and QBPPEK contained only anion exchange groups. Both Q/S-1.37 and Q/S-0.70 exhibited similar IECa values, while Q/S-1.37 exhibited a higher IECc value. In addition, the theoretical IEC (IECT) values of Q/S-x almost coincided with the measured IEC (IECM) ones. IECaT was obtained under the hypothesis that all bromomethyl groups react during the quaternary amination process, and IECcT was defined as IECs divided by the SPPEK mass content in Q/S-x.
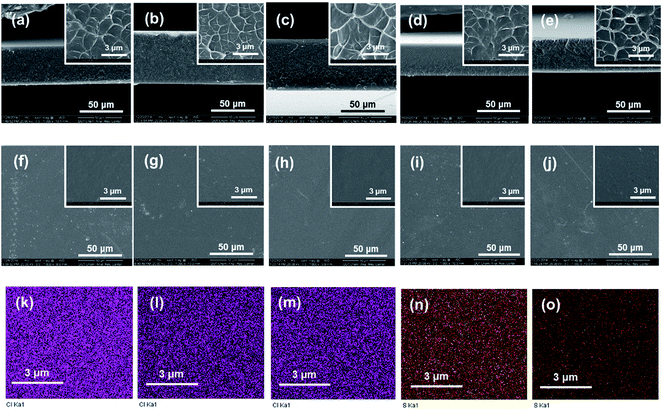
From both the low- and high-resolution SEM images displayed in Fig. 3, it can be observed that the cross-section of Q/S-x is rough, while the surface microstructure is smooth. Q/S-x displayed a similar microstructure to those of pristine QBPPEK, SPPEK-0.70 and SPPEK-1.37. The compact and uniform morphology of Q/S-x revealed good compatibility between two components and the absence of electrostatic interactions during the preparation process.
Fig. 3k–o display the element mapping of Q/S-x based on energy dispersive X-ray (EDX) analysis. The uniform distribution of sulfur and chlorine corresponding to the sulfonic acid and quaternary ammonium groups revealed good compatibility between the two components and the absence of electrostatic interactions. In addition, the detected sulfur in Q/S-x indicated the incorporation of sulfonic acid groups. Q/S-0.70 and Q/S-1.37 exhibited similar chlorine contents, while Q/S-1.37 displayed a higher content of sulfur, which agreed well with the IEC results. Both the IEC and EDX results suggested a lower quaternary ammonium group content in Q/S-x compared to that in QBPPEK.
3.2 Basic properties of Q/S-x
The WU, SR(H2O) and SR(VOSO4) results of QBPPEK, SPPEK-x and Q/S-x are presented in Fig. 4. Compared with QBPPEK, Q/S-0.70 exhibited lower WU, SR(H2O) and SR(VOSO4). This is because the introduced SPPEK (IEC = 0.70 mmol g−1) in Q/S-0.70 showed poor hydrophilicity, as indicated by the lower WU and SR values of SPPEK-0.70 compared to those of QBPPEK. Analogously, it was concluded that the SPPEK component in Q/S-1.37 showed better hydrophilicity than the QBPPEK component. Generally, the incorporation of sulfonated polymers benefits the improvement in hydrophilicity. However, the WU, SR(H2O) and SR(VOSO4) values of Q/S-1.37 (29.2%, 6.8% and 6.0%, respectively) were lower than those of QBPPEK (34.0%, 9.7% and 8.9%, respectively). The length differences of membranes before and after the amination process were detected (Fig. 4). The length changes in QBPPEK, Na-substituted SPPEK-0.70 and SPPEK-1.37 during the amination process were 6.8%, 0.2% and 0.2%, respectively. The result suggested that the BPPEK component obviously swelled, while the Na-substituted SPPEK component remained nearly invariable during the quaternary amination process. Q/S-1.37 displayed a lower length change (2.1%) than QBPPEK during amination. Compared to the observations for QBPPEK, both the smaller amount of the BPPEK component and the higher content of the Na-substituted SPPEK component in Q/S-1.37 were not conducive for swelling during amination, leading to a dense microstructure. Although highly hydrophilic sulfonic acid groups existed in Q/S-1.37, the compact and dense structure restrained WU and SR. Compared with Nafion115, Q/S-1.37 with increased WU displayed lower SR, thus revealing good dimensional stability.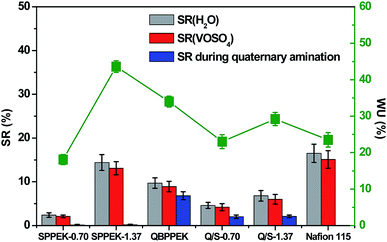 | ||
| Fig. 4 The WU, SR(H2O), SR(VOSO4) and length change during amination process (sulfonic acid groups were substituted by sodium before amination). | ||
Fig. 5a–c present the area resistance of Q/S-x. The area resistance of a membrane is influenced by proton conduction, which is related to many factors such as the type of ionic groups, IEC, WU and SR. The possible proton transfer process in Q/S-x is presented in Fig. 5d. It was observed that proton conduction was controlled by the vehicle mechanism and Grotthuss mechanism. In Q/S-x, the introduced sulfonic acid groups benefited proton conduction via the Grotthuss mechanism, decreasing the area resistance.71,72 However, the decreased WU and SR caused by SPPEK incorporation suppressed proton conduction induced by water-assisted vehicle mechanism, hindering the reduction in area resistance.71,72 In Q/S-0.70, sulfonic acid groups displayed a small content, and the contribution to proton conduction via the Grotthuss mechanism was too small to offset conduction reduction caused by decreased WU and SR. Therefore, as presented in Fig. 5, the R value of Q/S-0.70 (1.02 Ω cm2) was higher than that of QBPPEK (0.65 Ω cm2). In the case of Q/S-1.37, due to the desirable amount of sulfonic acid groups, the improvement in proton conduction controlled by the Grotthuss mechanism dominated, effectively reducing the area resistance. Therefore, Q/S-1.37 showed lower R (0.58 Ω cm2) than QBPPEK, which indicated that the incorporation of SPPEK with desirable IECs was effective in reducing R of Q/S-x. The R value of Q/S-1.37 was close to the value of Nafion115 (0.45 Ω cm2), demonstrating the good ion conductivity of Q/S-1.37.
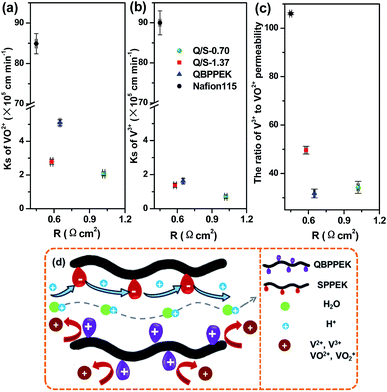 | ||
| Fig. 5 VO2+ permeability (a), V3+ permeability (b) and the ratio of V3+ to VO2+ permeability (c) versus area resistance; (d) the diagram of possible ion transport process in Q/S-x. | ||
The crossover of vanadium ions with varied valences across a membrane can generate the self-discharge of VRBs, which needs to be restricted. Generally, the permeability coefficient of vanadium ions (Ks) is employed to assess the vanadium ion resistance of a membrane. As shown in Fig. 5a and b, the VO2+ and V3+ permeability of membranes followed the order QBPPEK > Q/S-1.37 > Q/S-0.70, coinciding with the aforementioned SR results. This is because a dense structure restrains the crossover of vanadium ions. Despite sulfonic acid groups, Q/S-x had lower vanadium ion permeability than QBPPEK. In CEMs, the electrostatic attraction of the electronegative groups promoted vanadium ion diffusion, which was restrained in AEMs because of the electrostatic repulsion of the positively charged groups. Both the attraction and repulsion have greater effects on the transport of V3+ than that of VO2+ due to the higher charge number of V3+.54,55 Therefore, in Nafion115 (CEM), the V3+ permeability was higher than the VO2+ permeability and in QBPPEK (AEM), the V3+ permeability was lower. The corresponding ratios of the V3+ permeability to the VO2+ permeability for QBPPEK, Q/S-0.70 and Q/S-1.37 were 31.8%, 34.0% and 49.6% (Fig. 5c). This suggested that the discrepancy of the VO2+ and V3+ permeability could be regulated by incorporating SPPEK and the SPPEK component promoted V3+ diffusion. The VO2+ and V3+ permeability values of Q/S-x were 96.7–97.6% and 98.5–99.2% less than those of Nafion115, respectively. Q/S-x exhibited good resistance to vanadium permeability due to the Donnan exclusion effect, as shown in Fig. 5d.
Fig. 5a and b present vanadium ion permeability as a function of area resistance. An ideal membrane for VRBs should exist in the lower left hand corner of the figure. From the figure, it can be concluded that Q/S-1.37 provided superior ion selectivity over Nafion115.
3.3 Water transport performance
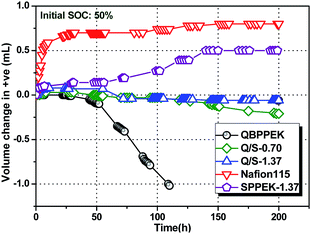
Water transport influences VRB operation as one half-cell becomes diluted and the other side becomes concentrated, leading to vanadium salt precipitation and capacity decay.11,58–67 Simultaneously, extra working procedures and high costs are needed for rebalancing electrolytes. Therefore, one requirement of IEMs for VRBs is to deter excessive net water transport. According to previous reports, the hydration of transporting ions can impact water transfer.58–60 Therefore, the diffusion rate of vanadium ions and the number of the corresponding bound water molecules influence the net water transport.Fig. 6 displays the static water transport volume of membranes at 50% SOC. The static water transport in the case of Nafion115 and SPPEK-1.37 was directed to the positive half-cell (+ve), and this coincided with previous results.58–60,64 This is mainly due to the hydration of V2+/V3+.58–60,64 As described, electronegative groups are more conducive for V2+/V3+ permeability than VO2+/VO2+ permeability due to higher charge numbers of V2+/V3+. Furthermore, the number of water molecules bound to V2+/V3+ is higher than that for VO2+/VO2+.70 The water transfer direction of QBPPEK was towards the negative half-cell (−ve), agreeing well with previously reported results.58,60,62 The electropositive groups exhibited a greater suppression effect on the transport of V2+/V3+ than on the transport of VO2+/VO2+. Regardless of the increased bound water content for V2+/V3+, the hydration of VO2+/VO2+ directed the water transport to −ve in QBPPEK. The effects of sulfonic acid and quaternary ammonium groups on the water transport direction were opposite and would offset each other. Sulfonic acid groups intensified the water transport toward +ve. Therefore, for QBPPEK, Q/S-0.70 and Q/S-1.37, the volumes of water transferring to +ve were 0 mL, 0.03 mL and 0.08 mL, while those to −ve were 1.02 mL, 0.21 mL and 0.06 mL, respectively. Q/S-1.37 showed the static water transport volume of 0.08 mL, which was 90.0% less than that of Nafion115. This is due to the adverse effect of the cation and anion exchange groups on the water transport direction and low vanadium permeability in Q/S-1.37. Compared with QBPPEK and SPPEK-1.37, Q/S-1.37 displayed decrease of 92.1% and 84.0%, respectively, in the water transport volume, revealing good water transport resistance.
3.4 VRB performance
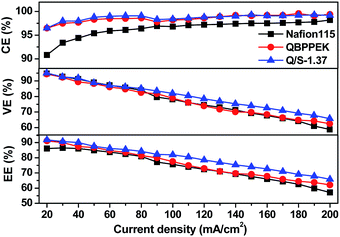
As presented in Fig. 7, the CE values of Nafion115, QBPPEK and Q/S-1.37 increase on enhancing the current density. This is because the increased current density ensures quick charge–discharge cycles, restraining vanadium ion diffusion. QBPPEK and Q/S-1.37 with lower vanadium permeability exhibited higher CE than Nafion 115. The VE values of Nafion115, QBPPEK and Q/S-1.37 decreased as the current density increased. Higher current density intensifies cell polarization, leading to the reduction in VE. Compared with QBPPEK, Q/S-1.37 showed higher VE, confirming that the incorporation of SPPEK was conducive for improving conductivity. In addition, Q/S-1.37 displayed higher VE than Nafion115, and the VE gap widened with the increase in current. The EE values of membranes reduced as the current density increased. Compared with Nafion115, Q/S-1.37 exhibited an increase of 1.0–5.7% in CE and an increase of 2.5–8.7% in EE at different current densities, thus revealing a good VRB performance.3.5 Chemical stability of membranes
The ability to resist oxidative VO2+ solutions is important for membranes applied in VRB constructions, which is evaluated through an immersion test in VO2+ solutions.56,57 As displayed in Table 1, the soaked membranes exhibit lower IEC values in comparison with the original ones, indicating the degradation of ion exchange groups during the immersion process. The IEC values of QBPPEK, SPPEK-0.70 and SPPEK-1.37 after the immersion test decreased to 0.21, 0.04 and 0.04 mmol g−1, respectively. This suggested better chemical stability of SPPEK in VO2+ solutions, which was also proven by the fact that the weight loss of QBPPEK (7.3%) was higher than those of SPPEK-1.37 and SPPEK-0.70 (2.8% and 3.5%, respectively). As shown in Table 1, among the membranes, Nafion115 exhibits the lowest mass loss of 2.1%, revealing the good chemical stability in VO2+. The weight loss of Q/S-1.37 (5.4%) was lower than that of QBPPEK, which revealed better chemical stability in the VO2+ solution. The result is caused by the good chemical stability of the SPPEK component and the low SR induced by SPPEK incorporation, which hinder the absorption of VO2+ and improve chemical stability.| Membrane | Weight loss (%) | Before | After being immersed for 60 days | CE (%) | VE (%) | EE (%) | ||
|---|---|---|---|---|---|---|---|---|
| IECc (mmol g−1) | IECa (mmol g−1) | IECc (mmol g−1) | IECa (mmol g−1) | |||||
| QBPPEK | 7.3 ± 0.3 | — | 1.72 ± 0.03 | — | 1.51 ± 0.01 | — | — | — |
| Q/S-0.70 | 4.1 ± 0.4 | 0.25 ± 0.02 | 1.23 ± 0.03 | 0.22 ± 0.02 | 1.13 ± 0.02 | 97.7 ± 0.5 | 87.4 ± 1.3 | 85.4 ± 0.9 |
| Q/S-1.37 | 5.4 ± 0.2 | 0.32 ± 0.03 | 1.14 ± 0.03 | 0.27 ± 0.03 | 1.01 ± 0.02 | 97.2 ± 1.0 | 90.9 ± 0.9 | 88.4 ± 1.1 |
| SPPEK-1.37 | 2.8 ± 0.2 | 1.29 ± 0.01 | — | 1.25 ± 0.02 | — | 98.6 ± 0.7 | 85.8 ± 1.3 | 84.4 ± 1.2 |
| SPPEK-0.70 | 3.5 ± 0.3 | 0.68 ± 0.03 | — | 0.64 ± 0.03 | — | — | — | — |
| Nafion115 | 2.1 ± 0.2 | 0.89 ± 0.02 | — | 0.87 ± 0.02 | — | 94.0 ± 0.9 | 90.5 ± 1.2 | 85.1 ± 1.1 |
The VRB performance of the membranes after being soaked in 1.5 mol L−1 VO2+ was detected (Table 1) (current density: 40 mA cm−2). SPPEK-0.70 with low IECc showed poor ion conductivity and could not be assembled in VRBs. After the ex situ degradation test, QBPPEK could not bear the compression of other components in the battery device, while Q/S-x and SPPEK-1.37 could still be fabricated in VRBs. Furthermore, Q/S-1.37 showed 3.3% increase in EE than Nafion115. Compared with the efficiencies for original Q/S-1.37 (CE: 98.0%, VE: 91.8%, EE: 90.0%), those of the soaked membrane showed no significant change. These results demonstrated that Q/S-1.37 exhibited good stability in VO2+.
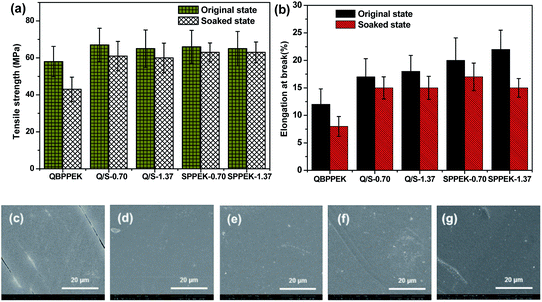
As presented in Fig. 8a and b, SPPEK-1.37 and SPPEK-0.70 exhibit higher tensile strength and elongation at break than QBPPEK, thus revealing better mechanical properties. The tensile strengths of Q/S-0.70 and Q/S-1.37 were 67 and 65 MPa, and the elongation at break values were 17% and 18%, respectively. All these values were higher than those of QBPPEK (58 MPa and 12%). This is because Q/S-x contain a SPPEK component with good mechanical properties and exhibit better dimensional stability than QBPPEK. In addition, the result demonstrated the good compatibility of the two components in Q/S-x. It can also be observed in Fig. 8a and b that the mechanical strength of the membranes decreases during the immersion test in a VO2+ solution and Q/S-x exhibit lower decline degree compared to QBPPEK. This proved the better chemical stability of Q/S-x in VO2+ solutions than QBPPEK. After immersion in 1.5 mol L−1 VO2+ solutions, Q/S-x and SPPEK-x showed intact surface morphology (Fig. 8d–g), while cracks can be seen in the surface SEM image of QBPPEK (Fig. 8c). All the above results revealed that the introduction of the SPPEK component benefited the improvement in the mechanical properties and chemical stability of Q/S-x.
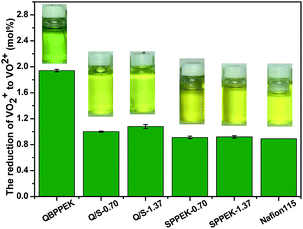
The membranes were exposed to 0.1 mol L−1 VO2+. The VO2+ content and solution states after 56 days are shown in Fig. 9. During membrane degradation, VO2+ was reduced to VO2+. The better chemical stability of the SPPEK component was demonstrated by the fact that SPPEK-1.37 and SPPEK-0.70 exhibited solutions with yellower colour and an almost halved VO2+ content compared with QBPPEK. In addition, the dense structure induced by the incorporation of the SPPEK component resisted the absorption of VO2+ into Q/S-x. Therefore, the incorporation of the SPPEK component effectively improved the chemical stability of Q/S-x in VO2+ solutions. Q/S-1.37 and Q/S-0.70 exhibited much lower VO2+ contents (1.08 mol% and 1.00 mol%, respectively) than QBPPEK (1.94 mol%), which were close to the value of Nafion115 (0.89 mol%).
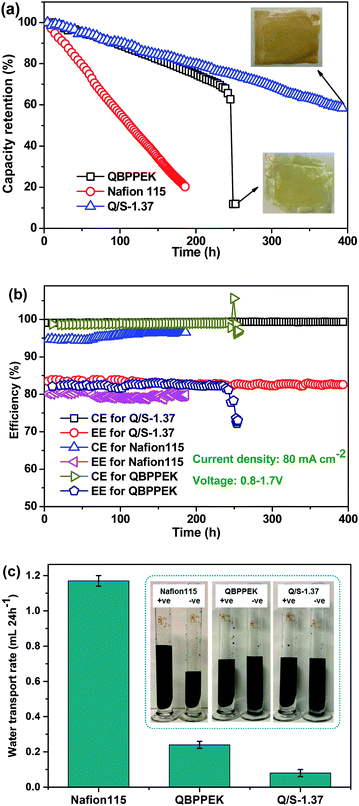
The cycling performance of QBPPEK, Q/S-1.37 and Nafion115 is shown in Fig. 10. The capacity retention of Q/S-1.37 and Nafion115 gradually declined, while QBPPEK showed a sudden drop from 63% to 15% after 245 h (Fig. 10a). The images of QBPPEK and Q/S-1.37 after the cycling test are also shown in Fig. 10a. Except some dents caused by the carbon felts and frames of VRBs, Q/S-1.37 showed intact morphology after 400 h, while QBPPEK cracked after 245 h. This may be because QBPPEK with poor mechanical properties and chemical stability could not bear the strong compression of other components and the flushing of flowing electrolytes in the VRB system. The capacity of VRB with Nafion115 rapidly reduced to 20% after 185 h and was too low to continue testing. Due to lower vanadium permeability, QBPPEK and Q/S-1.37 exhibited much higher capacity retention than Nafion115. After 185 h cycling, Q/S-1.37 showed the capacity retention of 81.3%, which was four times that of Nafion115 (20.3%). Q/S-1.37 possessed the CE and EE values of around 99% and 83%, respectively, which were higher than those of Nafion115 (around 96% and 80%). Q/S-1.37 showed stable efficiencies during the 400 h test period, while QBPPEK displayed a sudden efficiency drop after 245 h. This demonstrated that the SPPEK incorporation could easily improve the duration and stability of Q/S-x for a long-term VRB operation. Moreover, this was achieved by improving the chemical, mechanical and dimensional stabilities in Q/S-x. The abovementioned results were confirmed by repeated experiments. The maximum errors of efficiency and operation time were less than 2% and 10 h, respectively. The water transport rates of the membranes and solution states after the cycling test are presented in Fig. 10c. Q/S-1.37 showed the water transport rate of 0.08 mL (24 h−1), which was 93.2% and 66.7% less than the values of Nafion115 and QBPPEK (1.17 mL (24 h−1) and 0.24 mL (24 h−1)), respectively. The adverse effect of the sulfonic acid and quaternary ammonium groups on the water transport direction and the low vanadium permeability in Q/S-x benefited the reduction of electrolyte imbalance. As presented in the solution states after the cycling test, Nafion115 and QBPPEK showed more obvious electrolyte imbalance than Q/S-1.37. These results revealed that Q/S-x could easily reduce the cycling water transport volume. In addition, it was detected that the cycling water transport direction for Nafion115 was from −ve to +ve, while for QBPPEK and Q/S-x, the direction was opposite.
There have been very few studies on the water transport across AIEMs. Table 2 lists the electrolyte imbalance values of Q/S-1.37 and other AIEMs during the VRB cycling test. Q/S-1.37 exhibited the imbalance of 8%, which was lower than the values of QBPPEK and Nafion115 (16% and 55%, respectively), thus revealing good water transport resistance. Compared with the imbalance values of EFTF-g-Poly(VP) and SPI50 membranes (12% and 44%, respectively), the value of Q/S-1.37 was lower. However, different experimental conditions in various labs should be considered.
The VRB performance of Q/S-x was compared with that of various AIEMs reported in the current literatures.32,34,37,39,46–48,50–53,74–79 At both low and high currents, Q/S-1.37 exhibited increased CE (>96.0%), thus revealing good vanadium ion resistance. Despite varied experimental conditions in different labs, the VE and EE values of Q/S-1.37 at both low and high currents remained at a relatively high level. With the aid of anionic and cationic groups, Q/S-x achieved a good VRB performance under various current densities. Current density has an effect on charge–discharge time and vanadium ion crossover, and it was hard to compare the long-term stability of various AIEMs at different currents. Since the cycling test was conducted under the same current, the ImPSf/SPEEK and SPEEK/PPO-TTA-15% membranes were selected and compared with Q/S-1.37.48,52 The capacity retention during the cycling test could be employed to evaluate stability. Q/S-1.37 exhibited the capacity retention of 72.3% at 50 cycles, which was higher than the values for ImPSf/SPEEK (69.0%) and SPEEK/PPO-TTA-15% (48.0%). Q/S-1.37 exhibited good stability in VRBs.
4. Conclusions
A facile method was employed to prepare novel poly(phthalazinone ether ketone)-based AIEMs (Q/S-x) for VRB applications, thus avoiding electrostatic interactions. Based on the independent introduction of sulfonic acid and quaternary ammonium groups, no precipitates were formed during membrane preparation and Q/S-x exhibited uniform and compact morphology. The SPPEK incorporation restricted the swelling of membranes during the amination process and made the structure of Q/S-x dense, leading to lower SR and better dimensional stability than QBPPEK and Nafion115. Compared with QBPPEK, Q/S-1.37 exhibited lower R, which was close to the value of Nafion115. Q/S-x showed lower VO2+ and V3+ permeability compared to QBPPEK and Nafion115. The discrepancy of the VO2+ and V3+ permeability in Q/S-x could be regulated. The ratio of the V3+ permeability to the VO2+ permeability improved from 31.8% (for QBPPEK) to 49.6% (for Q/S-1.37). Based on the low vanadium permeability and the adverse effect of the cation and anion exchange groups on water transport, good water transport resistance was observed for Q/S-x. Q/S-1.37 displayed higher CE and VE than QBPPEK and Nafion115. The ex situ degradation test in VO2+ solutions revealed that the SPPEK incorporation in Q/S-x improved chemical stability. The VRB with Q/S-1.37 could be steadily operated for 400 h and retained higher CE, EE and capacity retention than that with Nafion115. Thus, Q/S-x with improved ion selectivity, stability and water transfer resistance has a potential for use in commercial VRBs.Conflicts of interest
There are no conflicts to declare.Acknowledgements
This work was supported by the National Natural Science Foundation of China (No. 21276037), LiaoNing Revitalization Talents Program (No. XLYC1802073) and the Fundamental Research Funds for the Central Universities (No. DUT19ZD404).References
- M. Skyllas-Kazacos, M. Rychcik, R. G. Robins, A. G. Fane and M. A. Green, J. Electrochem. Soc., 1986, 133, 1057–1058 CrossRef CAS.
- M. Skyllas-Kazacos, M. H. Chakrabarti, S. A. Hajimolana, F. S. Mjalli and M. Saleem, J. Electrochem. Soc., 2011, 158, R55–R79 CrossRef CAS.
- Y. Shi, C. Eze, B. Y. Xiong, W. D. He, H. Zhang, T. M. Lim, A. Ukil and J. Y. Zhao, Appl. Energy, 2019, 238, 202–224 CrossRef CAS.
- X. F. Li, H. M. Zhang, Z. S. Mai, H. Z. Zhang and I. Vankelecom, Energy Environ. Sci., 2011, 4, 1147–1160 RSC.
- W. J. Lu, Z. Z. Yuan, Y. Y. Zhao, H. Z. Zhang, H. M. Zhang and X. F. Li, Chem. Soc. Rev., 2017, 46, 2199–2236 RSC.
- G. L. Soloveichik, Chem. Rev., 2015, 155, 11533–11558 CrossRef PubMed.
- J. R. Ran, L. Wu, Y. B. He, Z. J. Yang, Y. M. Wang, C. X. Jiang, L. Ge, E. Bakangura and T. W. Xu, J. Membr. Sci., 2017, 522, 267–291 CrossRef CAS.
- L. Zeng, T. S. Zhao, L. Wei, H. R. Jiang and M. C. Wu, Appl. Energy, 2019, 233–234, 622–643 CrossRef CAS.
- Z. Z. Yuan, Y. Q. Duan, Z. H. Zhang, X. F. Li, H. M. Zhang and I. Vankelecom, Energy Environ. Sci., 2016, 9, 441–447 RSC.
- W. J. Lu, X. F. Li and H. M. Zhang, Phys. Chem. Chem. Phys., 2018, 20, 23–35 RSC.
- B. Schwenzer, J. L. Zhang, S. Kim, L. Y. Li, J. Liu and Z. G. Yang, ChemSusChem, 2011, 4, 1388–1406 CrossRef CAS PubMed.
- Z. S. Mai, H. M. Zhang, X. F. Li, C. Bi and H. Dai, J. Power Sources, 2011, 196, 482–487 CrossRef CAS.
- D. Reed, E. Thomsen, W. Wang, Z. M. Nie, B. Li, X. L. Wei, B. Koeppel and V. Sprenkle, J. Power Sources, 2015, 285, 425–430 CrossRef CAS.
- B. Jiang, L. T. Wu, L. H. Yu, X. P. Qiu and J. Y. Xi, J. Membr. Sci., 2016, 510, 18–26 CrossRef CAS.
- J. Y. Xi, Z. H. Wu, X. P. Qiu and L. Q. Chen, J. Power Sources, 2007, 166, 531–536 CrossRef CAS.
- L. H. Yu, F. Lin, L. Xu and J. Y. Xi, RSC Adv., 2016, 6, 3756–3764 RSC.
- J. C. Dai, Y. C. Dong, C. Yu, Y. X. Liu and X. G. Teng, J. Membr. Sci., 2018, 554, 324–330 CrossRef CAS.
- M. A. Aziz and S. Shanmugam, J. Power Sources, 2017, 377, 36–44 CrossRef.
- S. W. Choi, T. H. Kim, S. W. Jo, J. Y. Lee, S. H. Cha and Y. T. Hong, Electrochim. Acta, 2018, 259, 427–439 CrossRef CAS.
- S. H. Zhang, B. G. Zhang, G. F. Zhao and X. G. Jian, J. Mater. Chem. A, 2014, 2, 3083–3091 RSC.
- S. Kim, J. L. Yan, B. Schwenzer, J. L. Zhang, L. Y. Li, J. Liu, Z. G. Yang and M. A. Hickner, Electrochem. Commun., 2010, 12, 1650–1653 CrossRef CAS.
- S. C. Min, H. Y. Jeong, H. Y. Shin, S. H. Hong, T. H. Kim, S. G. Oh, J. Y. Lee and Y. T. Hong, J. Power Sources, 2017, 363, 78–86 CrossRef.
- S. H. Zhang, B. G. Zhang, D. B. Xing and X. G. Jian, J. Mater. Chem. A, 2013, 1, 12246–12254 RSC.
- B. G. Zhang, Q. Wang, S. S. Guan, Z. H. Weng, E. L. Zhang, G. S. Wang, Z. G. Zhang, J. W. Hu and S. H. Zhang, J. Power Sources, 2018, 399, 18–25 CrossRef CAS.
- D. S. Zhang, X. M. Yan, G. H. He, L. Zhang, X. H. Liu, F. X. Zhang, M. M. Hu, Y. Dai and S. S. Peng, J. Mater. Chem. A, 2015, 3, 16948–16952 RSC.
- B. G. Zhang, S. H. Zhang, Z. H. Weng, G. S. Wang, E. L. Zhang, P. Yu, X. M. Chen and X. W. Wang, J. Power Sources, 2016, 325, 801–807 CrossRef CAS.
- S. Yun, J. Parrondo and V. Ramani, J. Mater. Chem. A, 2014, 2, 6605–6615 RSC.
- M. S. Cha, S. W. Jo, S. H. Han, S. H. Hong, S. So, T. H. Kim, S. G. Oh, Y. T. Hong and J. Y. Lee, J. Power Sources, 2019, 413, 158–166 CrossRef CAS.
- S. H. Zhang, C. X. Yin, D. B. Xing, D. L. Yang and X. G. Jian, J. Membr. Sci., 2010, 363, 243–249 CrossRef CAS.
- D. Y. Chen, S. Kim, L. Y. Li, G. Yang and M. A. Hickner, RSC Adv., 2012, 2, 8087–8094 RSC.
- D. Lu, L. L. Wen, F. Nie and L. X. Xue, RSC Adv., 2016, 6, 6029–6037 RSC.
- J. Y. Qiu, M. L. Zhai, J. H. Chen, Y. Wang, J. Peng, L. Xu, J. Q. Li and G. S. Wei, J. Membr. Sci., 2009, 342, 215–220 CrossRef CAS.
- J. Y. Qiu, J. Z. Zhang, J. H. Chen, J. Peng, L. Xu, M. L. Zhai, J. Q. Li and G. S. Wei, J. Membr. Sci., 2009, 334, 9–15 CrossRef CAS.
- M. S. Lee, H. G. Kang, J. D. Jeon, Y. W. Choi and Y. G. Yoon, RSC Adv., 2016, 6, 63023–63029 RSC.
- S. S. Sha'rani, E. Abouzari-Lotf, M. M. Nasef, A. Ahmad, T. M. Ting and R. R. Ali, J. Power Sources, 2019, 413, 182–190 CrossRef.
- Y. F. Wang, S. J. Wang, M. Xiao, D. M. Han, M. A. Hickner and Y. Z. Meng, RSC Adv., 2013, 3, 15467–15474 RSC.
- J. B. Liao, M. Z. Lu, Y. Q. Chu and J. L. Wang, J. Power Sources, 2015, 282, 241–247 CrossRef CAS.
- Y. F. Wang, S. J. Wang, M. Xiao, S. Q. Song, D. M. Han, M. A. Hickner and Y. Z. Meng, Int. J. Hydrogen Energy, 2014, 39, 16123–16131 CrossRef CAS.
- X. M. Yan, C. M. Zhang, Z. W. Dong, B. W. Jiang, Y. Dai, X. M. Wu and G. H. He, ACS Appl. Mater. Interfaces, 2018, 10, 32247–32255 CrossRef CAS PubMed.
- S. Liu, L. H. Wang, Y. Ding, B. Q. Liu, X. T. Han and Y. L. Song, Electrochim. Acta, 2014, 130, 90–96 CrossRef CAS.
- Y. X. Zhang, H. X. Wang, W. K. Yu, J. L. Shi and H. F. Shi, J. Membr. Sci., 2018, 564, 916–925 CrossRef CAS.
- L. Q. Kong, L. Y. Zheng, R. T. Niu, H. X. Wang and H. F. Shi, RSC Adv., 2016, 6, 100262–100270 RSC.
- J. Li, Q. Zhang, S. S. Peng, D. S. Zhang, X. M. Yan, X. M. Wu, X. Gong, Q. Wang and G. H. He, J. Membr. Sci., 2019, 583, 93–102 CrossRef CAS.
- M. Jung, W. Lee, C. H. Noh, A. Konovalova, G. S. Yi, S. W. Kim, Y. C. Kwon and D. Henkensmeier, J. Membr. Sci., 2019, 580, 110–116 CrossRef CAS.
- W. J. Dai, Y. Shen, Z. H. Li, L. H. Yu, J. Y. Xi and X. P. Qiu, J. Mater. Chem. A, 2014, 2, 12423–12432 RSC.
- X. S. Zhao, Y. Z. Fu, W. Li and A. Manthiram, RSC Adv., 2012, 2, 5554–5556 RSC.
- D. J. Chen, X. L. Chen, L. F. Ding and X. F. Li, J. Membr. Sci., 2018, 553, 25–31 CrossRef CAS.
- H. Q. Zhang, X. M. Yan, L. Gao, L. Hu, X. H. Ruan, W. J. Zheng and G. H. He, ACS Appl. Mater. Interfaces, 2019, 11, 5003–5014 CrossRef CAS PubMed.
- W. Cui, J. Kerres and G. Eigenberger, J. Membr. Sci., 1998, 14, 145–154 CAS.
- L. Cao, L. Kong, L. Q. Kong, X. X. Zhang and H. F. Shi, J. Power Sources, 2015, 299, 255–264 CrossRef CAS.
- S. Liu, L. H. Wang, D. Li, B. Q. Liu, J. J. Wang and Y. L. Song, J. Mater. Chem. A, 2015, 3, 17590–17597 RSC.
- X. M. Yan, C. M. Zhang, Y. Dai, W. J. Zheng, X. H. Ruan and G. H. He, J. Membr. Sci., 2017, 544, 98–107 CrossRef CAS.
- R. J. Gan, Y. J. Ma, S. S. Li, F. X. Zhang and G. H. He, J. Energy Chem., 2017, 27, 1189–1197 CrossRef.
- L. Y. Chen, S. H. Zhang, Y. N. Chen and X. G. Jian, J. Power Sources, 2017, 355, 23–30 CrossRef CAS.
- Y. A. Gandomi YA, D. S. Aaron and M. M. Mench, Electrochim. Acta, 2016, 218, 174–190 CrossRef.
- S. J. Seo, B. C. Kim, K. W. Sung, E. J. Shim, J.-D. Jeon, K.-H. Shin, S.-H. Shin, S.-H. Yun, J.-Y. Lee and S.-H. Moon, J. Membr. Sci., 2013, 428, 17–23 CrossRef CAS.
- B. G. Zhang, S. H. Zhang, D. B. Xing, R. L. Han, C. X. Yin and X. G. Jian, J. Power Sources, 2012, 217, 296–302 CrossRef CAS.
- T. Mohammadi, S. C. Chieng and M. Skyllas-Kazacos, J. Membr. Sci., 1997, 133, 151–159 CrossRef CAS.
- T. Sukkar and M. Skyllas Kazacos, J. Membr. Sci., 2003, 222, 235–247 CrossRef CAS.
- C. X. Sun, J. Chen, H. M. Zhang, X. Han and Q. T. Luo, J. Power Sources, 2010, 195, 890–897 CrossRef CAS.
- A. Parasuraman, T. M. Lim, C. Menictas and M. Skyllas-Kazacos, Electrochim. Acta, 2013, 101, 27–40 CrossRef CAS.
- T. Mohammadi and M. Skyllas-Kazacos, J. Power Sources, 1996, 63, 179–186 CrossRef CAS.
- M. Skyllas-Kazacos, J. Power Sources, 2003, 124, 299–302 CrossRef CAS.
- T. Mohammadi and M. Skyllas-Kazacos, J. Membr. Sci., 1995, 107, 35–45 CrossRef CAS.
- K. Oh, M. Moazzam, G. Gwak and H. Ju, Electrochim. Acta, 2019, 297, 101–111 CrossRef CAS.
- T. Sukkar and M. Skyllas-Kazacos, J. Appl. Electrochem., 2004, 34, 137–145 CrossRef CAS.
- A. Z. Weber, M. M. Mench, J. P. Meyers, P. N. Ross, J. T. Gostick and Q. H. Liu, J. Appl. Electrochem., 2011, 41, 1137–1164 CrossRef CAS.
- Y. Gao, G. P. Robertson, M. D. Guiver and X. G. Jian, J. Polym. Sci., Part A: Polym. Chem., 2003, 41, 497–507 CrossRef CAS.
- T. Mohammadi and M. Skyllas-Kazacos, J. Appl. Electrochem., 1997, 27, 153–160 CrossRef CAS.
- M. Skyllas-Kazacos, L. Y. Cao, M. Kazacos, N. Kausar and A. Mousa, ChemSusChem, 2016, 9, 1521–1543 CrossRef CAS PubMed.
- H. Wu, X. H. Shen, T. Xu, W. Q. Hou and Z. Y. Jiang, J. Power Sources, 2012, 213, 83–92 CrossRef CAS.
- B. Smitha, S. Sridhar and A. A. Khan, Macromolecules, 2004, 37, 2233–2239 CrossRef CAS.
- O. Nibel, T. Rojek, T. J. Schmidt and L. Gubler, ChemSusChem, 2017, 10, 2767–2777 CrossRef CAS PubMed.
- L. Wang, L. H. Yu, D. Mu, L. W. Yu, L. Wang and J. Y. Xi, J. Membr. Sci., 2018, 552, 167–176 CrossRef CAS.
- Y. Li, X. C. Lin, L. Wu, C. X. Jiang, M. M. Hossain and T. W. Xu, J. Membr. Sci., 2015, 483, 60–69 CrossRef CAS.
- L. M. Ding, X. P. Song, L. H. Wang and Z. P. Zhao, J. Membr. Sci., 2019, 578, 126–135 CrossRef CAS.
- E. Bülbül, V. Atanasov, M. Mehlhorn, M. Bürger, A. Chromik, T. Häring and J. Kerres, J. Membr. Sci., 2019, 570–571, 194–203 CrossRef.
- J. Y. Xi, Z. H. Wu, X. G. Teng, Y. T. Zhao, L. Q. Chen and X. P Qiu, J. Mater. Chem., 2008, 18, 1232–1238 RSC.
- A. Chromik, A. R. D. Santos, T. Turek, U. Kunz, T. Häring and J. Kerres, J. Membr. Sci., 2015, 476, 148–155 CrossRef CAS.
| This journal is © The Royal Society of Chemistry 2019 |

