 Open Access Article
Two AIEE-active α-cyanostilbene derivatives containing BF2 unit for detecting explosive picric acid in aqueous medium†
Shengmei Guoa,
Jianting Panab,
Jianyan Huanga,
Lin Kong a and
Jiaxiang Yang
 *a
*a
aCollege of Chemistry & Chemical Engineering, Anhui University, Anhui Province Key Laboratory of Chemistry for Inorganic/Organic Hybrid Functional Materials, Hefei 230601, P. R. China. E-mail: jxyang@ahu.edu.cn
bAnhui Province Institute of Product Quality Supervision & Inspection, Hefei 230051, P. R. China
First published on 20th August 2019
Abstract
Two novel α-cyanostilbene derivatives bearing triphenylamine and BF2 groups are synthesized (named TPE-B and TPE-BN). The fluorescent emissions of compounds TPE-B and TPE-BN are hypochromatically shifted and bathochromically shifted, respectively, with increasing polarity of the solvents, suggesting that the two compounds have characteristic polarity-dependent solvatochromic effects. Furthermore, they show obvious aggregation-induced emission enhancement (AIEE) phenomenon in THF/water mixture solutions. Meanwhile, compounds TPE-B and TPE-BN emit orange and yellow fluorescence in their solid states, respectively. Most significantly, in aqueous medium, compounds TPE-B and TPE-BN can selectively and sensitively detect picric acid (PA) among a number of nitroaromatic compounds, and their limits of detection (LOD) are calculated as 1.26 × 10⁻⁶ M and 1.51 × 10⁻⁶ M, respectively. The recognition mechanism for PA can be attributed to the photo-induced electron transfer (PET) process and this is supported by density functional theory (DFT) calculation. This research provides two novel compounds for the rational design of AIEE-active materials for sensing systems.
1. Introduction
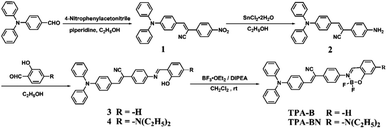
During the past decade, aesthetic organic fluorophores with aggregation induced emission (AIE) or aggregation-induced enhanced emission (AIEE) properties have received intense attention by virtue of their extensive applications as imaging agents and sensors, components of light-emitting diodes, and data recording and storage, among others.1–8 Developing functional AIE/AIEE materials can provide several advantages over conventional materials, such as their high quantum yields, controlled self-assembly effects, photostabilities, controllable emission colour, and flexible post-functionalization such as tetraphenylethene, α-cyanostilbene, silole, diphenyldibenzofulvene, organoboron, phosphindole oxide, pyrazine, phenothiazine derivatives, etc9–13. The twisted molecular conformations of organic fluorophores can emit strong fluorescence in the aggregated state by suppressing a dense face-to-face packing and immense π–π stacking interaction. Also, in the aggregated state, the molecules interlock themselves which restricts the intramolecular rotation (RIR) and vibration (RIV) and relaxes through radiative pathways.14–21 Therefore, it is of great significance to design and understand the relationships between structure and property for their further applications.22–24For the purpose of obtaining eminent organic molecules with strong fluorescence in aggregated states, the molecular design according to organic fluorophores is critical for adjusting their photophysical properties. Triphenylamine (TPA) is strong electron-donating structural units with good luminescence properties, high thermal, photostability, good absorptivity, and high absolutely quantum yields.25–27 Furthermore, an organoboron compound allowing trigonal-planar geometry, endows high extinction coefficients and high absolutely fluorescence quantum yields.28–31,55 The combination of α-cyanostilbene modified with triphenylamine and BF2 groups were used to design AIEE-active compounds TPE-B and TPE-BN (Scheme 1).32–34 In the present investigation, it was found that picric acid (PA) is a powerful explosive as TNT, only a few available PA sensing reports in aqueous medium. Meanwhile, PA is a seriously environmental pollutant, which consequently causes damage of human health and aquatic systems.35–39 We expect two compounds to exhibit brilliant PA detection in aqueous medium.
Based on the above considerations, two α-cyanostilbene derivatives (named TPE-B and TPE-BN) were synthesized via facile reaction. The UV-vis absorption spectra and fluorescence spectra of compounds TPE-B and TPE-BN were systematically investigated in different polar solvents. Meanwhile, the aggregates emission behaviors of compounds were studied in THF/water mixture solution. In addition, the recognition properties of TPA-B and TPA-BN to PA were studied and the corresponding sensor mechanism was analyzed by density functional theory (DFT) calculations.
2. Experimental section
2.1 Materials and instruments
The chemicals and solvents were purchased from a commercial supplier and used directly without any further refinement. The 1H and 13C NMR spectra were identified by a Bruker Avance 400 MHz spectrometer with tetramethylsilane as the internal standard. FT-IR spectra were obtained by Nicolet 380 spectrometer (4000–400 cm−1, KBr pellets). UV-vis absorption spectra were measured using a TU-1901 spectrometer and the fluorescence spectra were collected by Hitachi FL-7000 spectrofluorimeter from Hitachi High Technologies Corporation (Tokyo, Japan). Photo images were obtained using a digital camera (Nikon D7000).2.2 Synthesis
The synthetic routes of compounds TPE-B and TPE-BN are shown in Scheme 1.![[thin space (1/6-em)]](https://www.rsc.org/images/entities/char_2009.gif) :
:![[thin space (1/6-em)]](https://www.rsc.org/images/entities/char_2009.gif) ethyl acetate = 2
ethyl acetate = 2![[thin space (1/6-em)]](https://www.rsc.org/images/entities/char_2009.gif) :
:![[thin space (1/6-em)]](https://www.rsc.org/images/entities/char_2009.gif) 1). The final product was dried in vacuum and collected as orange powder 2 (180 mg, 0.46 mmol, yield: 76%). 1H NMR (DMSO-d6, 400 MHz) δ (ppm): 5.57 (s, 2H), 6.55 (d, J = 8.0 Hz, 1H), 6.63 (d, J = 8.4 Hz, 1H), 6.73 (d, J = 7.9 Hz, 1H), 6.96 (d, J = 8.3 Hz, 2H), 7.03–7.08 (m, 2H), 7.10–7.19 (m, 5H), 7.35–7.40 (m, 4H), 7.57 (s, 1H), 7.76 (d, J = 8.4 Hz, 2H). 13C NMR (DMSO-d6, 100 MHz) δ (ppm): 107.71, 113.90, 118.78, 120.84, 121.25, 124.15, 125.09, 126.45, 127.40, 129.73, 129.95, 136.21, 146.31, 148.35, 149.67. MALDI-TOF calcd for C27H21N3, 387.170, found, 387.947.
1). The final product was dried in vacuum and collected as orange powder 2 (180 mg, 0.46 mmol, yield: 76%). 1H NMR (DMSO-d6, 400 MHz) δ (ppm): 5.57 (s, 2H), 6.55 (d, J = 8.0 Hz, 1H), 6.63 (d, J = 8.4 Hz, 1H), 6.73 (d, J = 7.9 Hz, 1H), 6.96 (d, J = 8.3 Hz, 2H), 7.03–7.08 (m, 2H), 7.10–7.19 (m, 5H), 7.35–7.40 (m, 4H), 7.57 (s, 1H), 7.76 (d, J = 8.4 Hz, 2H). 13C NMR (DMSO-d6, 100 MHz) δ (ppm): 107.71, 113.90, 118.78, 120.84, 121.25, 124.15, 125.09, 126.45, 127.40, 129.73, 129.95, 136.21, 146.31, 148.35, 149.67. MALDI-TOF calcd for C27H21N3, 387.170, found, 387.947.Red powder 3 (530 mg, 1.08 mmol, yield: 72%). FT-IR (cm−1, KBr) v: 3423, 2211, 1618, 1581, 1535, 1332, 1285, 1196, 1178, 902, 829, 753, 696, 621, 535, 511. 1H NMR (CDCl3, 400 MHz) δ (ppm): 6.94–6.98 (m, 2H), 7.04 (d, J = 9.2 Hz, 2H), 7.19–7.23 (m, 7H), 7.38–7.47 (m, 5H), 7.62 (d, J = 7.6 Hz, 1H), 7.79–7.87 (m, 4H), 7.92 (d, J = 9.2 Hz, 2H), 8.99 (s, 1H), 13.06 (s, 1H). 13C NMR (CDCl3, 100 MHz) δ (ppm): 106.78, 117.31, 118.63, 119.19, 120.74, 121.80, 124.45, 125.44, 125.74, 126.25, 126.67, 129.57, 130.71, 132.44, 133.43, 133.62, 141.38, 146.52, 148.41, 150.03, 161.22, 162.78. MALDI-TOF calcd for C34H25N3O, 491.200, found, 491.671.
Red powder 4 (590 mg, 1.04 mmol, yield: 69%). FT-IR (cm−1, KBr) v: 3430, 2965, 2924, 2210, 1633, 1558, 1520, 1375, 1193, 1177.69, 1133, 1076, 874, 972, 845, 751, 727. 1H NMR (CDCl3, 400 MHz) δ (ppm): 1.18–1.22 (m, 6H), 3.45–3.50 (m, 4H), 6.15 (s, 1H), 6.37 (d, J = 8.7 Hz, 2H), 7.03 (d, J = 8.8 Hz, 2H), 7.16–7.20 (m, 6H), 7.31 (d, J = 8.8 Hz, 2H), 7.37–7.43 (m, 5H), 7.77 (d, J = 8.6 Hz, 3H), 7.91 (d, J = 8.3 Hz, 2H), 8.70 (s, 1H), 13.40 (s, 1H). 13C NMR (CDCl3, 100 MHz) δ (ppm): 12.73, 44.65, 97.78, 104.05, 107.36, 109.16, 118.74, 120.98, 121.35, 124.34, 125.68, 126.15, 126.62, 129.56, 130.59, 132.69, 133.78, 133.99, 140.62, 146.67, 149.85, 152.12, 160.49, 164.21. MALDI-TOF calcd for C38H34N3O, 562.273, found, 562.995.
Orange red powder TPA-B (400 mg, 0.75 mmol, yield: 75%). FT-IR (cm−1, KBr) v: 3056, 2923, 2853, 2217, 1627, 1583, 1556, 1534, 1459, 1389, 1331, 1329, 1270, 1216, 1179, 1153, 1047, 758, 698, 530, 512. 1H NMR (CDCl3, 400 MHz) δ (ppm): 5.53 (s, 3H), 6.83 (d, J = 7.5 Hz, 1H), 7.03–7.18 (m, 8H), 7.29–7.35 (m, 3H), 7.48 (s, 1H), 7.53 (t, J = 7.4 Hz, 1H), 7.59 (s, 1H), 7.63 (d, J = 7.9 Hz, 1H), 7.69 (t, J = 8.0 Hz, 1H), 7.76–7.81 (m, 3H), 8.48 (s, 1H). 13C NMR (CDCl3, 100 MHz) δ (ppm): 105.76, 118.35, 120.53, 120.61, 124.12, 124.42, 124.66, 125.54, 125.76, 125.90, 126.83, 129.47, 129.54, 129.63, 130.22, 131.02, 132.26, 136.09, 139.58, 143.02, 146.42, 150.50. MALDI-TOF calcd for C34H24BF2N3O, 538.202, found, 538.595.
Yellow powder TPA-BN (410 mg, 0.66 mmol, yield: 66%). FT-IR (cm−1, KBr) v: 3035, 2975, 2929, 2204, 1626, 1589, 1509, 1459, 1352, 1313, 1297, 1278, 1241, 1217, 1192, 1145, 1075, 1030, 971, 961, 898, 842, 750, 729, 529. 1H NMR (CDCl3, 400 MHz) δ (ppm): 1.23–1.27 (m, 6H), 3.49–3.44 (m, 4H), 6.25 (s, 1H), 6.38 (d, J = 9.2 Hz, 1H), 6.82 (d, J = 8.6 Hz, 1H), 7.04–7.17 (m, 9H), 7.28–7.34 (m, 4H), 7.43 (s, 1H), 7.51 (s, 1H), 7.56 (d, J = 8.4 Hz, 1H), 7.23 (s, 1H), 7.69 (d, J = 8.5 Hz, 1H), 7.79 (d, J = 8.6 Hz, 1H), 8.06 (s, 1H).
13C NMR (CDCl3, 100 MHz) δ (ppm): 12.69, 45.24, 98.03, 106.40, 106.97, 107.17, 118.58, 120.75, 123.49, 124,51, 125.79, 126.22, 126.57, 129.62, 130.86, 134.17, 134.20, 142.03, 143.11, 146.55, 150.16, 156.48, 157.52, 161.96. MALDI-TOF calcd for C38H33BF2N4O, 609.271, found, 609.830.
3. Results and discussion
3.1 Solvatochromic effect
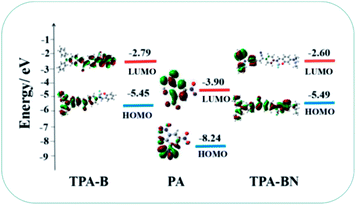
The UV-vis absorption and photoluminescence (PL) spectra of compounds TPA-B and TPA-BN were measured in various polar solvents and demonstrated in Fig. S1† and Fig. 1, respectively, and the corresponding photophysical data were summarized in Table 1. All the spectroscopic studies were performed at room temperature and the concentration of the solutions were 1.0 × 10⁻⁵ mol L−1. The UV-vis absorption spectra of TPA-BN showed two characteristic absorption bands at 297 nm and 420 nm in various polarity solvents, respectively. The absorption peak at 297 nm is ascribed to the π–π* transition in TPA moiety corresponding to locally excited (LE) state,27,40,41 while the latter peak at 420 nm denotes intramolecular charge transfer (ICT) process. The UV-vis absorption of TPA-B has a similar peak shapes. And the emission wavelengths of two compounds revealed larger shift with increasing polarity. For compound TPA-B, the emission peak was hypochromatic-shifted from 541 nm in benzene to 530 nm in ethanol, indicated that TPA-B molecule possibly had a larger polarity in the ground state than in the excited state. However, the fluorescent emission peak of compound TPA-BN was bathochromic-shifted from 516 nm in benzene to 540 nm in DMF, indicated that TPA-BN molecule might have a larger polarity in the excited state than in the ground state.42–44 Meanwhile, the evident shift of emission peaks manifested the existence of ICT process. The slopes of the fitting line in Lippert–Mataga plots (Fig. S2†), which were −646.5 and 2887.8, respectively, indicated that the compound TPA-BN introduced into the electron-donating group significantly possessed the solvatochromic effects. And, Fig. 5 shows that the TPA group has a larger density in the highest occupied frontier molecular orbital (HOMO) of TPA-B molecular. As the electron density of the lowest unoccupied molecular orbital (LUMO) of the TPA unit decreases, the other moieties achieve larger electron density. For TPA-BN, the HOMO and LUMO were mostly distributed over the molecular and TPA groups, respectively, which further manifested that the ICT process might occur in TPA-B and TPA-BN.60 It was indicated that two compounds were characteristic of polarity-dependent solvatochromic effects.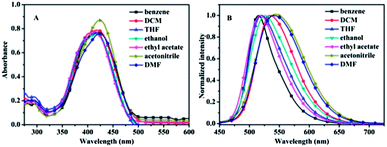 | ||
| Fig. 1 UV-vis absorption spectra (A) and PL spectra (B) of the compound TPA-BN in different solvent. | ||
| Compounds | Solvents | λabsa | εmaxb | λflc | Δνd | Φe (%) |
|---|---|---|---|---|---|---|
| a Absorption peak position in nm (1 × 10⁻⁵ mol L−1).b Maximum molar absorbance in 104 mol−1 L cm−1.c Peak position of fluorescent (1.0 × 10⁻⁵ mol L−1), excited at the absorption maximum.d Stokes shift in cm−1.e Quantum yields determined (RhB as the standard). | ||||||
| TPA-B | Benzene | 419 | 4.59 | 541 | 5382 | 8.8 |
| DCM | 427 | 7.10 | 538 | 4832 | 1.0 | |
| Ethyl acetate | 420 | 6.64 | 570 | 6262 | 2.3 | |
| THF | 420 | 6.76 | 531 | 4977 | 1.5 | |
| Ethanol | 408 | 6.06 | 530 | 5642 | 1.2 | |
| Acetonitrile | 420 | 7.19 | 535 | 5118 | 0.1 | |
| DMF | 423 | 7.07 | 540 | 5122 | 0.1 | |
| TPA-BN | Benzene | 423 | 7.78 | 516 | 4260 | 9.1 |
| DCM | 418 | 7.93 | 533 | 5161 | 6.1 | |
| Ethyl acetate | 415 | 7.81 | 519 | 4828 | 8.8 | |
| THF | 416 | 7.75 | 520 | 4807 | 4.2 | |
| Ethanol | 414 | 7.59 | 526 | 5143 | 6.9 | |
| Acetonitrile | 422 | 8.76 | 542 | 5246 | 1.2 | |
| DMF | 425 | 7.66 | 540 | 5010 | 3.1 | |
3.2 Aggregation-induced emission enhancement (AIEE) property
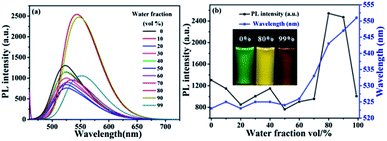
Aiming to investigate the AIEE characteristics of TPA-B and TPA-BN, their UV-vis absorption spectra and PL spectra with different water fraction were performed. The concentrations were kept at 1.0 × 10⁻⁵ mol L−1. For UV-vis absorption spectra of compound TPA-BN (Fig. S3b†), with the increasing water fraction, the solubility of the compound gradually decreased and the molecules gradually shifted from the monomolecular state to the aggregation state, forming the molecular aggregated particles. The level-off tails attributed to Mie scattering were responsible for the aggregated forms in the UV-vis absorption spectra.45–50 A similar change trend was also observed from the UV-vis absorption spectra of TPA-B with the change of water contents. For compounds TPA-B and TPA-BN, dynamic light scattering (DLS) experiment displays the formation of aggregates (the hydrodynamic diameter of 267.2 nm and 390.2 nm, respectively). For PL spectra (Fig. 2), in pure THF solution, compound TPA-BN emitted weak yellow-green fluorescence. Compound TPA-BN started gradually aggregate with the increasing water fraction, the PL intensity showed a remarkable enhancement accompanied with a bathochromic-shift of fluorescent emission peak. This emission behavior may be accounted for the restriction of intramolecular rotation (RIR) and forms of J-aggregation,51 which blocks the channel of non-radiative decay in the aggregates. Furthermore, when the water fraction is higher than 80%, the PL intensities gradually decreased, because the settlement of large aggregated particles resulted in a lower fluorescence intensity. Moreover, we found that the PL spectra of the compound TPA-B (Fig. S4†) displayed a similar behavior. The PL intensity of the compounds TPA-B and TPA-BN in the aggregated state were obviously stronger than that of the THF solution, the PL intensities were 1.6 and 2.0 fold, respectively. It was easily concluded that compounds TPA-B and TPA-BN were typical AIEE-active molecules.Furthermore, PL spectra of compounds TPA-B and TPA-BN were investigated to explore the difference of solid emission. As was shown in Fig. 3, TPA-B exhibited orange emission, whereas TPA-BN containing an additional electron-donating group has a obvious influence on hypsochromic shift of fluorescent peaks, emitting yellow fluorescence. The solid state fluorescent quantum yields of TPA-B and TPA-BN were measured as 13.5% and 19.4%, respectively in the solid state. The possible fluorescence emission discrepancy was caused by the role of intermolecular arrangement and stacking in solid state. Thus, the introduction of additional electron-donating group could effectively affect their fluorescence emission behavior and result in different spectral shifts and absolute quantum yields.
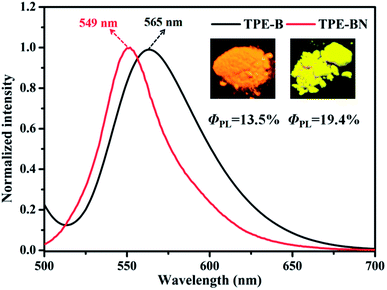 | ||
| Fig. 3 Normalized PL spectra of two solids. Inset: the corresponding fluorescence images of TPA-B and TPA-BN under illumination. | ||
3.3 The detection for picric acid
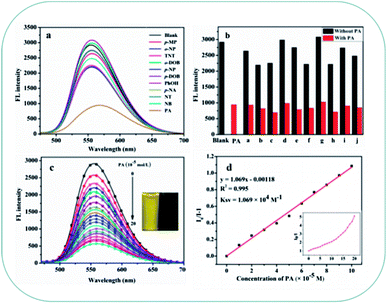
Based on brilliant AIEE behavior of compounds TPA-B and TPA-BN in mixtures of THF/H2O. We next explore whether compounds TPA-B and TPA-BN can detect common nitroaromatic compounds (p-methyl phenol (p-MP), o-nitrophenol (o-NP), 2,4,6-trinitrotoluene (TNT), m-dihydroxybenzene (m-DOB), p-nitrophenol (p-NP), p-dihydroxybenzene (p-DOB), phenol (PhOH), p-nitroaniline (p-NA), nitrotoluene (NT), nitrobenzene (NB), 2,4,6-trinitrophenol (PA)) in aqueous medium, the PL spectra were measured with addition of 10 equivalents nitroaromatic compounds. As shown in Fig. 4a and S6a,† compared with other analytes, it was clearly observed that the positive interactions of TPA-B and TPA-BN with PA showed significant fluorescent quenching effect. Experimental results exhibited that other nitroaromatics exhibited relatively little effect on emission quenching compared with that of PA, suggesting the selective sensing behaviors of TPA-B and TPA-BN towards PA. Furthermore, it is worth noting that further additions of 10 equivalents PA into other nitroaromatic systems leads to remarkable quenching efficiency of fluorescence intensity (Fig. 4b and S6b†), means that other compounds have negligible effect on the detection of PA by TPA-B and TPA-BN. According to the above results, compounds TPA-B and TPA-BN are regarded as promising candidates for PA detection in aqueous medium.The key to performing better practical application, the experiment was carried out to better explore the sensitivity of compounds TPA-B and TPA-BN towards PA in aqueous medium. As shown in Fig. 4c and Fig. S6c,† the fluorescent quenching efficiencies of TPA-B and TPA-BN were 82.7% and 81.6% in the presence of 10 equivalents PA, respectively. In order to evaluate the quenching efficiency of TPA-B and TPA-BN in response to the PA in solution, a quenching process can be analyzed by Stern–Volmer equation,52 the equation was as follow:
| I0/I = Ksv[A] + 1 |
Density functional theory (DFT) calculation was used to investigate possible PA sensing mechanism. As shown in Fig. 5, the LUMO level (−2.79 eV) of TPA-B is higher than that of PA (−3.90 eV), which suggested when excited TPA-B was exposed to PA, the excited electron was transferred from the LUMO of fluorophores to that of the electron-deficient PA. The radiative electronic transition was blocked due to the electron transfer from the chromophore to PA, resulting in fluorescence quenching. Moreover, the other driving force is the energy difference between the LUMO of the fluorophore and the LUMO of analytes.61–65 The LUMO orbital energy typically indicates how easily an electron can be transferred from excited fluorophore to the electron-deficient analytes. As the LUMO orbital energies of PA and TNT calculated by DFT is −3.90 eV and −3.33 eV, respectively. As expected, because of its small LUMO value, the PET driving force of PA is larger than that of TNT. This may partly explain the sensitivity and selectivity of TPA-B for PA detection. Similarly, for TPA-BN, the LUMO energy level of PA is between the LUMO energy level and the HOMO energy level of TPA-BN, indicating that the fluorescence quenching of TPA-BN with PA may suggest that the possibility of electron transfer from the LUMO of the chemosensor to the lower LUMO of PA. Based on the above results, the main driving force was attributed to the photo-induced electron transfer (PET) process, resulting in fluorescence quenching. Meanwhile, as was showed in the Fig. S8,† the UV-vis absorption spectra of PA and the PL spectra of TPA-B and TPA-BN were recorded and presented to examine whether fluorescence resonance energy transfer (FRET) occurs in detection process. The absorption spectrum of PA has no overlap with the PL spectra of the two chemosensors, indicating that FRET was neglectable in the quenching process. Therefore, the PET process may be main reason for recognition mechanism between the chemosensors and PA.
4. Conclusions
In conclusion, two novel α-cyanostilbene derivatives (TPA-B and TPA-BN) containing triphenylamine and BF2 units are synthesized and characterized that displayed obvious solvatochromic effect. Their ICT behaviors are certified by DFT analysis on molecular orbitals. Meanwhile, the incorporation of α-cyanostilbene unit in the backbone endows molecules an obvious AIEE behaviour in THF–water mixture solvent. Compounds showed excellent fluorescence emission in the solid state with high absolute quantum yield. Most impressing, TPA-B and TPA-BN were used as highly selectively and sensitively chemosensor to detect PA in aqueous medium and the LODs were calculated as 1.26 × 10⁻⁶ M and 1.51 × 10⁻⁶ M, respectively. The efficient sensing mechanism of two chemosensors in the presence of PA contributed to the PET process, verified by DFT calculations on molecular orbitals. This research provides two novel compounds for the rational design of AIEE-active materials for sensing application in aqueous medium.Conflicts of interest
We declare that we do not have any commercial or associative interest that represents a conflict of interest in connection with the work submitted.Acknowledgements
This work was supported by the National Natural Science Foundation of China (51673001, 51432001), the Educational Commission of Anhui Province of China (KJ2014ZD02).References
- V. Mahendran, K. Pasumpon, S. Thimmarayaperumal, P. Thilagar and S. Shanmugam, Tetraphenylethene-2-pyrone conjugate: aggregation-induced emission study and explosives sensor, J. Org. Chem., 2016, 81, 3597–3602 CrossRef CAS PubMed.
- J. D. Luo, Z. L. Xie, J. W. Y. Lam, L. Cheng, H. Y. Chen, C. F. Qiu, H. S. Kwok, X. W. Zhan, Y. Q. Liu, D. B. Zhu and B. Z. Tang, Aggregation-induced emission of 1-methyl-1,2,3,4,5-pentaphenylsilole, Chem. Commun., 2001, 1740–1741 RSC.
- K. Li, Y. Zhang, B. Qiao, F. R. Tao, T. D. Li, Y. Q. Ding, F. M. Raymo and Y. Z. Cui, Facile fabrication of AIE/AIEE-active fluorescent nanoparticles based on barbituric for cell imaging Applications, RSC Adv., 2017, 7, 30229–30241 RSC.
- H. W. Ma, C. Y. He, X. L. Li, O. Ablikim, S. T. Zhang and M. Zhang, A fluorescent probe for TNP detection in aqueous solution based on joint properties of intramolecular charge transfer and aggregation-induced enhanced emission, Sens. Actuators, B, 2016, 230, 746–752 CrossRef CAS.
- Z. J. Ning, Z. Chen, Q. Zhang, Y. L. Yan and S. X. Qian, et al., Aggregation-induced emission(AIE)-active starburst triarylamine fluorophores as potential non-doped red emitters for organic light-emitting diodes and Cl2 gas chemodosimeter, Adv. Funct. Mater., 2007, 17, 3799–3807 CrossRef CAS.
- B. H. Yu, D. Y. Liu, Y. Wang, T. Zhang, Y. M. Zhang and M. J. Lia, A solid-state emissive and solvatofluorochromic fluorophore and its application in high-contrast, fast, and repeatable thermochromic blends, Dyes Pigm., 2019, 163, 412–419 CrossRef CAS.
- S. Gupta and M. D. Milton, Design and synthesis of novel V-shaped AIEE active quinoxalines for acidochromic applications, Dyes Pigm., 2019, 165, 474–487 CrossRef CAS.
- B. K. An, S. K. Kwon, S. D. Jung and S. Y. Park, Enhanced emission and its switching in fluorescent organic nanoparticles, J. Am. Chem. Soc., 2002, 124, 14410–14415 CrossRef CAS PubMed.
- S. Kandel, V. Sathish, L. Mathivathanan, A. N. Morozov, A. M. Mebel and R. G. Raptis, Aggregation induced emission enhancement (AIEE) of tripodal pyrazole derivatives for sensing of nitroaromatics and vapor phase detection of picric acid, New J. Chem., 2019, 43, 7251–7258 RSC.
- C. X. Niu, Y. You, L. Zhao, D. C. He, N. Na and O. Y. Jin, Solvatochromism, reversible chromism and self-assembly effects of heteroatom-assisted aggregation-induced enhanced emission (AIEE) compounds, Chem. –Eur. J., 2015, 21, 13983–13990 CrossRef CAS PubMed.
- X. F. Mei, G. X. Wen, J. W. Wang, H. M. Yao, Y. Zhao, Z. H. Lin and Q. D. Ling, A K-shaped donor-π-acceptor-π-donor molecule with AIEE and CIEE activity and sequential logic gate behaviour, J. Mater. Chem. C, 2015, 3, 7267–7271 RSC.
- J. Mei, N. L. C. Leung, R. T. K. Kwok, J. W. Y. Lam and B. Z. Tang, Aggregation-induced emission: together we shine, united we soar!, Chem. Rev., 2015, 115, 11718–11940 CrossRef CAS PubMed.
- T. B. Rajua, P. Gopikrishn, J. V. Vaghasiyac, S. S. Sonic and P. K. Iyer, The solvatochromism and aggregation-induce enhanced emission of triphenylamine substituted styrene derivatives and its application in dye sensitized solar cells, J. Photochem. Photobiol., A, 2019, 376, 12–21 CrossRef.
- Y. Okazawa, K. Kondo, M. Akita and M. Yoshizawa, Polyaromatic nanocapsules displaying aggregation-induced enhanced emissions in water, J. Am. Chem. Soc., 2015, 137, 98–101 CrossRef CAS PubMed.
- F. Hu, S. D. Xu and B. Liu, Photosensitizers with aggregation-induced emission: materials and biomedical applications, Adv. Mater., 2018, 30, 1801350–1801379 CrossRef PubMed.
- X. Z. Yan, M. Wang, T. R. Cook, M. M. Zhang, M. L. Saha, Z. X. Zhou, X. P. Li, F. H. Huang and P. J. Stang, Light-emitting superstructures with anion effect: coordination driven self-assembly of pure tetraphenylethylene metallacycles and metallacages, J. Am. Chem. Soc., 2016, 138, 4580–4588 CrossRef CAS PubMed.
- Z. J. Zhao, J. W. Y. Lamb and B. Z. Tang, Tetraphenylethene: a versatile AIE building block for the construction of efficient luminescent materials for organic light-emitting diodes, J. Mater. Chem., 2012, 22, 23726–23740 RSC.
- M. Shyamal, P. Mazumdar, S. Maity, S. Samanta, G. P. Sahoo and A. Misra, Highly selective turn-on fluorogenic chemosensor for robust quantification of Zn(II) based on aggregation induced emission enhancement feature, ACS Sens., 2016, 1, 739–747 CrossRef CAS.
- J. Chen, C. C. W. Law, J. W. Y. Lam, Y. Dong, S. M. F. Lo, I. D. Williams, D. Zhu and B. Z. Tang, Synthesis, light emission, nanoaggregation, and restricted intramolecular rotation of 1,1-substituted 2,3,4,5-tetraphenylsiloles, Chem. Mater., 2003, 15, 1535–1546 CrossRef CAS.
- P. Gopikrishna, N. Meher and P. K. Iyer, Functional 1,8-naphthalimide AIE/AIEEgens: recent advances and prospects, ACS Appl. Mater. Interfaces, 2018, 10, 12081–12111 CrossRef CAS PubMed.
- C. Y. K. Chan, Z. J. Zhao, J. W. Y. Lam, J. Z. Liu and S. Chen, et al., Efficient light emitters in the solid state: synthesis, aggregation-Induced emission, electroluminescence, and sensory properties of luminogens with benzene cores and multiple triarylvinyl peripherals, Adv. Funct. Mater., 2012, 22, 378–389 CrossRef CAS.
- F. Marquardt, C. Stöcker, R. Gartzen, E. Heine, H. Keul and M. Möller, Novel antibacterial polyglycidols: relationship between structure and properties, Polymers, 2018, 10, 96–116 CrossRef PubMed.
- G. L. Xu, Q. Wang, J. C. Fang, Y. F. Xu, J. T. Li, L. Huang and S. G. Sun, Tuning the structure and property of nanostructured cathode materials of lithium ion and lithium sulfur batteries, J. Mater. Chem. A, 2014, 2, 19941–19962 RSC.
- Z. Y. Yang, H. M. Zhang, G. B. Pan and L. J. Wan, Effect of the bridge alkylene chain on adlayer structure and property of functional oligothiophenes studied with scanning tunneling microscopy and spectroscopy, ACS Nano, 2008, 24743–24749 Search PubMed.
- M. Chen, H. Nie, B. Song, L. Z. Li and J. Z. Sun, et al., Triphenylamine-functionalized tetraphenylpyrazine: facile preparation and multifaceted functionalities, J. Mater. Chem. C, 2016, 4, 2901–2908 RSC.
- Q. Y. Chen, L. Kong, Y. P. Tian, X. Y. Xu, L. M. Yang, G. B. Zhang, W. B. Jia and J. X. Yang, The self-aggregation of fluorophore-triphenylamine nanostructures with tunable luminescent properties: the effect of acidity and rare earth ions, RSC Adv., 2014, 4, 18981–18988 RSC.
- M. M. Zhang, W. Yang, T. F. Gong, W. Q. Zhou and R. Y. Xue, Tunable AIEE fluorescence constructed from a triphenylamine luminogen containing quinoline application in a reversible and tunable pH sensor, Phys. Chem. Chem. Phys., 2017, 19, 21672–21682 RSC.
- F. B. Liu, Z. C. Ding, J. Liu and L. X. Wang, An organoboron compound with a wide absorption spectrum for solar cell applications, Chem. Commun., 2017, 53, 12213–12216 RSC.
- D. T. Yang, S. K. Mellerup, J.-B. Peng, X. Wang, Q. S. Li and S. Wang, Substituent directed phototransformations of BN-heterocycles: elimination vs isomerization via selective B-C bond cleavage, J. Am. Chem. Soc., 2016, 138, 11513–11516 CrossRef CAS PubMed.
- V. M. Hertz, M. Bolte, H. W. Lerner and M. Wagner, Boron-containing polycyclic aromatic hydrocarbons: facile synthesis of stable, redox-active luminophores, Angew. Chem., Int. Ed., 2015, 54, 8800–8804 CrossRef CAS PubMed.
- A. K. Vasu, M. Radhakrishna and S. Kanvah, Self-assembly tuning of α-cyanostilbene fluorogens: aggregates to nanostructures, J. Phys. Chem. C, 2017, 121, 22478–22486 CrossRef CAS.
- J. Q. Liao, M. Yang, Z. Liu and H. L. Zhang, Fast photoinduced deformation of hydrogenbonded supramolecular polymers containing α-cyanostilbene derivative, J. Mater. Chem. A, 2019, 7, 2002–2008 RSC.
- W. B. Jia, P. Yang, J. J. Li, Z. M. Yin and L. Kong, et al., Synthesis and characterization of a novel cyanostilbene derivative and its initiated polymers: aggregation-induced emission enhancement behaviors and light-emitting diode applications, Polym. Chem., 2014, 5, 2282–2292 RSC.
- Y. Q. Xu, B. H. Li, W. W. Li, J. Zhao, S. G. Sun and Y. Pang, ‘ICT-not-quenching’ near infrared ratiometric fluorescent detection of picric acid in aqueous media, Chem. Commun., 2013, 49, 4764–4766 RSC.
- T. M. Geng, Z. M. Zhua, X. Wang, H. Y. Xia, Y. Wang and D. K. Li, Poly{tris[4-(2-thienyl)phenyl]amine} fluorescent conjugated microporous polymer for selectively sensing picric acid, Sens. Actuators, B, 2017, 244, 334–343 CrossRef CAS.
- K. Li, R. H. Yu, C. M. Shi and F. R. Tao, et al., Electrospun nanofibrous membrane based on AIE-active compound for detecting picric acid in aqueous solution, Sens. Actuators, B, 2018, 262, 637–645 CrossRef CAS.
- B. Joarder, A. V. Desai, P. Samanta, S. Mukherjee and S. K. Ghosh, Selective and sensitive aqueous-phase detection of 2,4,6-trinitrophenol (TNP) by an amine-functionalized metal-organic framework, Chem. –Eur. J., 2015, 21, 965–969 CrossRef CAS PubMed.
- A. Biswas, D. Giri, D. Das, A. De, S. K. Patra and R. Samanta, A mild rhodium catalyzed direct synthesis of quinolones from pyridones: application in the detection of nitroaromatics, J. Org. Chem., 2017, 20(82), 10989–10996 CrossRef PubMed.
- S. Shanmugaraju, D. Umadevi, A. J. Savyasachi, K. Byrne, M. Ruether, W. Schmitt, G. W. Watson and T. Gunnlaugsson, Reversible adsorption and storage of secondary explosives from water using a Troger's base-functionalised polymer, J. Mater. Chem. A, 2017, 5, 25014–25024 RSC.
- J. W. Sun, J. Y. Baek, K. H. Kim, C. K. Moon and J. H. Lee, et al., Thermally activated delayed fluorescence from azasiline based intramolecular charge-transfer emitter (DTPDDA) and a highly efficient blue light emitting diode, Chem. Mater., 2015, 27, 6675–6681 CrossRef CAS.
- J. Ohshita, K. Yamamoto, D. Tanaka, M. Nakashima, Y. Kunugi, M. Ohashi and H. Nakano, Preparation and photocurrent generation of silicon nanosheets with aromatic substituents on the surface, J. Phys. Chem. C, 2016, 120, 10991–10996 CrossRef CAS.
- C. V. Maridevarmath, L. Naik, V. S. Negalurmath, M. Basanagouda and G. H. Malimath, Synthesis, characterization and photophysical studies on novel benzofuran-3-acetic acid hydrazide derivatives by solvatochromic and computational methods, J. Mol. Struct., 2019, 1188, 142–152 CrossRef CAS.
- L. Liu, Y. Y. Zhang, J. Zhou, J. H. Yang and C. Zhong, et al., Design of a quinazolinone-based environment-sensitive fluorescent dye: solvatochromic fluorescence and application for one-photon and two-photon bioimaging, Dyes Pigm., 2019, 165, 58–64 CrossRef CAS.
- P. Wen, Z. X. Gao, R. Zhang, A. R. Li and F. Zhang, et al., A-π-D-π-A carbazole derivatives with remarkable solvatochromism and mechanoresponsive luminescence turn-on, J. Mater. Chem. C, 2017, 5, 6136–6143 RSC.
- X. D. Liu, A. Li, W. Q. Xu, Z. Y. Ma and X. R. Jia, An ESIPT-based fluorescent switch with AIEE, solvatochromism, mechanochromism and photochromism, Mater. Chem. Front., 2019, 3, 620–625 RSC.
- P. Zhang, D. D. Li, Y. Li and J. H. Yu, Solvatochromic AIE luminogens as supersensitive water detectors in organic solvents and highly efficient cyanide chemosensors in water, Chem. Sci., 2014, 5, 2710–2716 RSC.
- M. K. Danquah, S. Wang, Q. Y. Wang, B. Wang and L. D. Wilson, A porous b-cyclodextrin-based terpolymer fluorescence sensor for in situ trinitrophenol detection, RSC Adv., 2019, 9, 8073–8080 RSC.
- D. Y. Li, X. Y. Zhao, W. Qin, H. Q. Zhang, Y. Fei and L. W. Liu, et al., Toxicity assessment and long-term three-photon fluorescence imaging of bright aggregation-induced emission nanodots in zebrafish, Nano Res., 2016, 7, 1921–1933 CrossRef.
- W. Z. Yuan, Y. Y. Gong, S. M. Chen, X. Y. Shen, W. Y. Lam and P. Lu, et al., Efficient solid emitters with aggregation-induced emission and intramolecular charge transfer characteristics: molecular design, synthesis, photophysical behaviors, and OLED application, Chem. Mater., 2012, 24, 1518–1528 CrossRef CAS.
- P. Y. Gu, C. J. Lu, Z. J. Hu, N. J. Li, T. T. Zhao and Q. F. Xu, et al., The AIEE effect and two-photon absorption (TPA) enhancement induced by polymerization: synthesis of a monomer with ICT and AIE effects and its homopolymer by ATRP and a study of their photophysical properties, J. Mater. Chem. C, 2013, 1(14), 2599–2606 RSC.
- T. E. Kaiser, V. Stepanenko and F. Wurthner, Fluorescent J-aggregates of core-substituted perylene bisimides: studies on structure-property relationship, nucleation-elongation mechanism, and sergeants-and-soldiers principle, J. Am. Chem. Soc., 2009, 131, 6719–6732 CrossRef CAS PubMed.
- S. Shanmugaraju, C. Dabadie, K. Byrne and A. J. Savyasachi, et al., A supramolecular Troger's base derived coordination zinc polymer for fluorescent sensing of phenolic-nitroaromatics explosives in water, Chem. Sci., 2017, 8, 1535–1546 RSC.
- J. Schoo, D. S. Lakshmi, E. Suresh and P. S. Subremanian, Selective and sensitive detection of picric acid in aqueous, sol-gel and solid support media by Ln(III) probes, Sens. Actuators, B, 2017, 250, 215–223 CrossRef.
- M. Ahmed, S. Hameed, A. Ihsan and M. M. Naseer, Fluorescent thiazol-substituted pyrazoline nanoparticles for sensitive and highly selective sensing of explosive 2,4,6-trinitrophenol in aqueous medium, Sens. Actuators, B, 2017, 248, 57–62 CrossRef CAS.
- R. Yoshii, K. Tanaka and Y. Chujo, Conjugated polymers based on tautomeric units: regulation of main-chain conjugation and expression of aggregation induced emission property via boron-complexation, Macromolecules, 2014, 47, 2268–2278 CrossRef CAS.
- H. C. Ma, Z. W. Zhang, Y. Y. Jin, L. J. Zha, C. X. Qi, H. Y. Cao, Z. M. Yang, Z. W. Yang and Z. Q. Lei, Triphenylamine-decorated BODIPY fluorescent probe for trace detection of picric acid, RSC Adv., 2015, 5, 87157–87167 RSC.
- K. Dhanunjayarao, V. Mukundam and K. Venkatasubbaiah, Tetracoordinate imidazole-based boron complexes for the selective detection of picric acid, Inorg. Chem., 2016, 55, 11153–11159 CrossRef CAS PubMed.
- S. S. Babu and S. Shanmugam, One-pot synthesis of boron diketonate complexes: photophysical properties and sensor for picric acid, J. Mater. Chem. C, 2017, 5, 4788–4796 RSC.
- S. Madhu, A. Bandela and M. Ravikanth, BODIPY based fluorescent chemodosimeter for explosive picric acid in aqueous media and rapid detection in the solid state, RSC Adv., 2014, 4, 7120–7123 RSC.
- P. C. Xue, B. Q. Yao, J. B. Sun, Z. Q. Zhang, K. C. Li, B. J. Liu and R. Lu, Crystallization-induced emission of styrylbenzoxazole derivate with response to proton, Dyes Pigm., 2015, 112, 255–261 CrossRef CAS.
- K. Li, R. H. Yu, C. M. Shi, F. R. Tao, T. D. Li and Y. Z. Cui, Electrospun nanofibrous membrane based on AIE-active compound for detecting picric acid in aqueous solution, Sens. Actuators, B, 2018, 262, 637–645 CrossRef CAS.
- X. C. Sun, X. Y. Ma, C. V. Kumar and Y. Lei, Protein-based sensitive, selective and rapid fluorescence detection of picric acid in aqueous media, Anal. Methods, 2014, 6, 8464–8468 RSC.
- A. S. Tanwar, S. Hussain, A. H. Malik, M. A. Afroz and P. K. Iyer, Inner filter effect based selective detection of nitroexplosive-picric acid in aqueous solution and solid support using conjugated polymer, ACS Sens., 2016, 1, 1070–1077 CrossRef CAS.
- V. Bhalla, A. Gupta, M. Kumar, D. S. S. Rao and S. K. Prasad, Self-assembled pentacenequinone derivative for trace detection of picric acid, ACS Appl. Mater. Interfaces, 2013, 5, 672–679 CrossRef CAS PubMed.
- A. H. Malik, S. Hussain, A. Kalita and P. K. Iyer, Conjugated polymer nanoparticles for the amplified detection of nitro-explosive picric acid on multiple platforms, ACS Appl. Mater. Interfaces, 2015, 7, 26968–26976 CrossRef CAS PubMed.
Footnote |
| † Electronic supplementary information (ESI) available: Photophysical properties; the Sterne–Volmer plots; UV-vis spectra in THF/H2O mixtures. PL emission spectra changes of TPA-B in THF/H2O mixtures; photophysical properties of PA detection for compound TPA-BN; normalized absorption spectrum of PA and the fluorescence spectra of TPE-B and TPE-BN. See DOI: 10.1039/c9ra05116c |
| This journal is © The Royal Society of Chemistry 2019 |

