 Open Access Article
Doping Pd/SiO2 with Na+: changing the reductive etherification of C![[double bond, length as m-dash]](https://www.rsc.org/images/entities/h2_char_e001.gif) O to furan ring hydrogenation of furfural in ethanol†
O to furan ring hydrogenation of furfural in ethanol†
Yinshuang Long,
Yun Wang,
Haihong Wu ,
Teng Xue,
Peng Wu
 and
Yejun Guan
 *
*
Shanghai Key Laboratory of Green Chemistry and Chemical Processes, School of Chemistry & Molecular Engineering, East Normal University of China, North Zhongshan Road 3663, Shanghai, China. E-mail: yjguan@chem.ecnu.edu.cn
First published on 13th August 2019
Abstract
The production of biofuels and chemicals by hydrogenation of furfural has attracted much attention recently. Herein the effect of Na+ doping on the catalytic performance of Pd/SiO2 in hydrogenation and reductive-etherification of furfural in ethanol was systematically studied. Two Pd/SiO2 catalysts with and without the modification by Na+ were prepared by impregnation and calcination. Their catalytic properties were compared for the hydrogenation of furfural and furfural diethyl acetal under mild conditions. The silanol groups on Pd/SiO2 catalysed the acetalization of furfural and alcohol and the resulted acetal underwent hydrogenolysis on Pd nanoparticles (NPs) with an average particle size of 8 nm, leading to a moderate yield (∼58%) of furfuryl ethyl ether. Doping Na+ on Pd/SiO2 led to the diminishing of silanol groups as well as strong interaction between Na+ and Pd NPs. No acetalization occurred on Na+ modified Pd/SiO2 due to the exchange of H+ of Si–OH with Na+, thus the reductive etherification of C![[double bond, length as m-dash]](https://www.rsc.org/images/entities/char_e001.gif) O group in furfural was completely inhibited. Meanwhile the hydrogenation of furan-ring over Na+ coordinated Pd NPs could proceed with very high selectivity (>90%) forming tetrahydrofurfural in high yield. Kinetics study on the hydrogenation of furfural diethyl acetal over Pd/SiO2 and Na+ doped Pd/SiO2 suggested that the Na+ greatly impeded the hydrogenolysis of C–O–C bond of acetal, while the hydrogenation of the furan ring took place selectively.
O group in furfural was completely inhibited. Meanwhile the hydrogenation of furan-ring over Na+ coordinated Pd NPs could proceed with very high selectivity (>90%) forming tetrahydrofurfural in high yield. Kinetics study on the hydrogenation of furfural diethyl acetal over Pd/SiO2 and Na+ doped Pd/SiO2 suggested that the Na+ greatly impeded the hydrogenolysis of C–O–C bond of acetal, while the hydrogenation of the furan ring took place selectively.
Introduction
The production of high-value chemicals and/or transportation fuels from lignocellulosic biomass has attracted wide interest in the past decades.1 One of the most selective chemical conversions of biomass is based on the transformation of platform compounds via hydrogen-involving reactions aiming at tailoring the oxygen content to fulfil the requirement of practical application.2 For example, biomass-derived etheric oxygenates have been proposed to be effective gasoline-additives, which can decrease the vehicle exhaust pollution by enhancing the combustion of fuels.3 Among the proposed bio-ethers, furfuryl alcohol (FA) derived ethers have attracted much attention. Conventionally, the furfuryl ethers are prepared by acid catalyzed etherification between FA and the other alcohols.4 However, this route has a major drawback in that the decomposition of ethers readily takes place under the reaction conditions.5 Therefore, mild reaction conditions have been put forward to increase the furfuryl ether yield.6,7 For instance, lower the etherification temperature of FA to 40 °C by adding trimethyl orthoformate (TMOF) or triethyl orthoformate (TEOF) as a sacrificial reagent has been found to be an efficient method.6 Alternatively, ether formation by reductive etherification starting with furfural (FAL) can also take place under mild conditions.7 We have recently found that the choice of support is very crucial for the reductive etherification of furfural over supported Pd catalysts and 0.7 wt% Pd/C catalyst was found to be the best one.7d By contrast, conflicting results have been reported in the case of Pd/SiO2 catalyst. In our previous study, the Pd/SiO2 catalyst reduced by NaBH4 showed very low selectivity toward the reductive-etherification.7d Other studies on FAL hydrogenation over Pd/SiO2 also showed that Pd NPs on SiO2 were very selective toward the hydrogenation of furan ring.8 On the other hand, some reports have found that Pd/SiO2 was an excellent catalyst for the reductive etherification of C![[double bond, length as m-dash]](https://www.rsc.org/images/entities/char_e001.gif) O bond in aldehydes like cyclohexanone and etc.9 We speculate that the introduction of Na during the catalyst preparation may have a profound role in this process. Moreover, in a recent study by Wu and coworkers, the presence of Na also significantly altered the reductive etherification activity of I–Pd/Al2O3 catalyst.7c Thus a deep understanding on how catalyst preparation, reaction conditions and metal structures affect the catalytic performance of Pd/SiO2 catalyst in FAL hydrogenation is highly desirable, whereas few studies have been carried out in this regard.10 In this study, we have found that the Na+ introduced in the preparation of Pd/SiO2 indeed plays a vital role in controlling the reaction pathways of furfural hydrogenation. The results suggest that Pd/SiO2 without Na+ is active and selective for reductive etherification, whereas Pd/SiO2 containing Na+ selectively catalyses the hydrogenation of furan ring. Moreover, this effect also applies to K+,9c pointing to a general role of alkaline cations in this process. These results shed new insights on the structure–activity relationship of Pd/SiO2 catalyst in FAL hydrogenation process.
O bond in aldehydes like cyclohexanone and etc.9 We speculate that the introduction of Na during the catalyst preparation may have a profound role in this process. Moreover, in a recent study by Wu and coworkers, the presence of Na also significantly altered the reductive etherification activity of I–Pd/Al2O3 catalyst.7c Thus a deep understanding on how catalyst preparation, reaction conditions and metal structures affect the catalytic performance of Pd/SiO2 catalyst in FAL hydrogenation is highly desirable, whereas few studies have been carried out in this regard.10 In this study, we have found that the Na+ introduced in the preparation of Pd/SiO2 indeed plays a vital role in controlling the reaction pathways of furfural hydrogenation. The results suggest that Pd/SiO2 without Na+ is active and selective for reductive etherification, whereas Pd/SiO2 containing Na+ selectively catalyses the hydrogenation of furan ring. Moreover, this effect also applies to K+,9c pointing to a general role of alkaline cations in this process. These results shed new insights on the structure–activity relationship of Pd/SiO2 catalyst in FAL hydrogenation process.
Results and discussion
Catalyst characterisation
The Pd loading of Pd/SiO2 and Pd–Na/SiO2 was determined to be 2.2 wt% and 2.0 wt% by ICP-AES, respectively. The textural properties of both catalysts are listed in Table S1.† The chemical structure of catalysts was characterized by XRD, XPS, H2-TPR and CO-IR. The XRD patterns of two catalysts (Fig. 1A) suggested that the oxidic PdO phase was mainly present on fresh Pd/SiO2 and Pd–Na/SiO2 catalysts. The particle size of PdO was calculated from the full width at half maximum (FWHM) of 33.8° due to PdO (101) diffraction by using Debye–Scherrer equation. The Pd nanoparticle size of Pd/SiO2 and Pd–Na/SiO2 is about 15 and 7.2 nm, respectively. The oxidic nature of Pd can be also confirmed by XPS spectra (Fig. 1B). The Pd 3d5/2 peak of Pd/SiO2 appeared at 336.7 eV, corresponding to Pd2+ of bulk PdO. The Pd 3d5/2 of Pd–Na/SiO2 appeared at 338.4 eV. This phenomenon has been observed previously on Pd/NaZSM-5 and the higher binding energy was proposed to be related to PdO2 species.11 The presence of Na+ on Pd–Na/SiO2 catalyst was confirmed by XPS (Fig. S1†) and the atomic ratio of Na/Pd was determined to be about 1.7. These PdO phases were readily reduced upon exposure to H2 at room temperature according to the TPR profiles (Fig. 1C), in which the formation of PdH was clearly noticed according to the negative peak in TPR profiles of both catalysts. The Pd 3d5/2 peak for reduced Pd/SiO2 and Pd–Na/SiO2 shifted to 335.1 and 335.6 eV, respectively.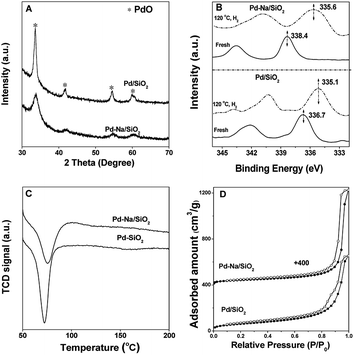 | ||
| Fig. 1 The (A) XRD patterns, (B) XPS spectra, (C) H2-TPR profiles and (D) N2 adsorption–desorption isotherms of 2.2 wt% Pd/SiO2 and 2.0 wt% Pd–Na/SiO2 catalysts. | ||
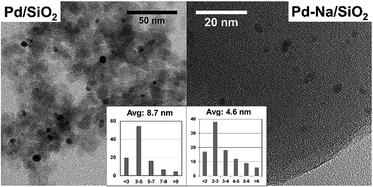
The particle size of reduced catalysts was further studied by TEM (Fig. 2). The Pd/SiO2 catalyst contains Pd NPs with an average diameter about 8.7 nm. Small particles with average size about 4.6 nm were obtained for Pd–Na/SiO2. The particle sizes of both catalysts estimated by TEM are smaller than that determined by XRD. Nonetheless, both techniques showed that the modification with Na+ may inhibit the sintering of PdO particles in calcination. The dispersion of Pd NPs on Pd/SiO2 and Pd–Na/SiO2 was estimated to be 5.9% and 7.4% according to CO chemisorption, respectively.
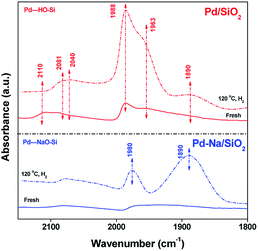
The electronic structure of Pd NPs before and after Na+ modification was studied by CO adsorption IR. Fig. 3 shows the FTIR spectra of adsorbed CO on Pd catalysts. For fresh Pd/SiO2 catalysts. Very weak bands at 2110, 2090, 1988, 1963 cm−1 due to the adsorbed CO were observed. These peaks are likely assigned to CO adsorbed on atop or bridge PdOx.12 After pretreated in H2 at 120 °C, the intensity of bands at 1988 and 1963 cm−1 attributed to the CO adsorbed on bridge sites of metallic Pd surface was increased remarkably, meaning that most PdO species were reduced. For fresh Pd–Na/SiO2, bands centered at 2078 and 1964 cm−1 with very lower intensity were observed, meaning that PdOx was also the dominating species on calcined Pd–Na/SiO2 catalyst. After reduction by H2 at 120 °C, the peaks due to CO adsorbed on bridged sites of Pd metal appeared at 1980 and 1890 cm−1. It should be noted that the value of I1890/I1980 was much higher when Na+ was introduced, which has been previously assigned to the interaction of Pd–CO–Na+.12a,13 These characterization results suggest that the electronic property of Pd NPs or the structure of exposed Pd atoms has been significantly changed by addition of Na+.
Furfural hydrogenation over Pd/SiO2 and Pd–Na/SiO2
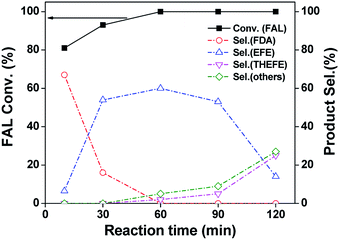
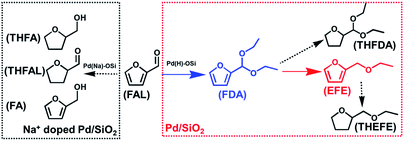
As an initial test, we investigated the catalytic performance of furfural hydrogenation over Pd/SiO2 catalyst and the results regarding to FAL conversion and products distribution at different reaction time are shown in Fig. 4. One can see that 81% FAL was converted in the first 10 min at 120 °C, with furfuryl diethyl acetal (FDA) being the predominant product. The other compound was ethyl furfuryl ether (EFE). After reaction for 30 min, the FDA selectivity dropped to 16% whereas the selectivity of EFE increased to 54%. The EFE selectivity reached 60% after reaction for 60 min. Further prolonging the reaction time to 120 min resulted in dramatic decrease of EFE selectivity to 14% in 2 h. The byproducts were mainly those compounds formed by the decomposition or over-hydrogenation of EFE under the reaction conditions. The overall reaction network is shown in Scheme 1. This result demonstrated that Pd/SiO2 prepared by impregnation is active and selective for EFE synthesis and short reaction period is preferred to insure a high yield of EFE. We investigated the effects of temperature and hydrogen pressure on the EFE yield by keeping the reaction time at 1 h and the results are shown in Table S2.† One can see that the total yield of FA and tetrahydrofurfuryl alcohol (THFA) was almost the same (about 16–20%) at 80–120 °C under hydrogen pressure below 0.5 MPa, meaning that the hydrogenation of furan ring was not affected by reaction temperature. By contrast, the EFE yield was much higher at 100 and 120 °C (50–58%) than that at 80 °C (32%). The low EFE yield at 80 °C is likely due to the low activity of hydrogenolysis of FDA, suggesting that the hydrogenolysis step is temperature-dependent.Fig. 5 shows the conversion and product selectivity for hydrogenation of FAL over Pd–Na/SiO2 as a function of reaction time at 120 °C and 0.3 MPa H2. After reaction for 10 min, the FAL conversion was about 32% and the products consisted of THFAL (74%), FA (13%) and THFA (13%). These products were all produced by hydrogenation of furan ring or C![[double bond, length as m-dash]](https://www.rsc.org/images/entities/char_e001.gif) O bond, with hydrogenation of furan-ring being the predominant reaction (87%). The furfural conversion increased steadily with the increase of reaction time. Full conversion of furfural was achieved within 90 min. The product distribution did not change with reaction time. We also explored the furfural hydrogenation activity of Pd/SiO2 and Pd–Na/SiO2 in isopropanol and the results are shown in Fig. S2.† For Pd/SiO2, the formation of ether, acetal, FA and THFA were all observed in the first 10 min. Interestingly, the selectivity toward ether and acetal was 34% and 30%, respectively, meaning that the acetalization and reductive etherification proceed simultaneously from the beginning. This behaviour differs to the above results observed in ethanol, wherein a consecutive-process was found. We consider that the structure of isopropanol plays an important role in this process, which may be not favourable to the acetalization because of steric effect. The direct formation of ether in isopropanol has also been reported previously over several Pd catalysts.7c,7e With the prolonging of the reaction time, the furfural conversion and ether selectivity reached 92% and 61%, respectively. This result further illustrates the application of Pd/SiO2 in ether formation. In the case of Pd–Na/SiO2, only hydrogenation pathway was noticed regardless of solvent used. Moreover, the hydrogenation activity in isopropanol is relative lower in comparison with that in ethanol. We surmise that the hydrogen dissociation ability of Pd surface might be lowered in isopropanol.
O bond, with hydrogenation of furan-ring being the predominant reaction (87%). The furfural conversion increased steadily with the increase of reaction time. Full conversion of furfural was achieved within 90 min. The product distribution did not change with reaction time. We also explored the furfural hydrogenation activity of Pd/SiO2 and Pd–Na/SiO2 in isopropanol and the results are shown in Fig. S2.† For Pd/SiO2, the formation of ether, acetal, FA and THFA were all observed in the first 10 min. Interestingly, the selectivity toward ether and acetal was 34% and 30%, respectively, meaning that the acetalization and reductive etherification proceed simultaneously from the beginning. This behaviour differs to the above results observed in ethanol, wherein a consecutive-process was found. We consider that the structure of isopropanol plays an important role in this process, which may be not favourable to the acetalization because of steric effect. The direct formation of ether in isopropanol has also been reported previously over several Pd catalysts.7c,7e With the prolonging of the reaction time, the furfural conversion and ether selectivity reached 92% and 61%, respectively. This result further illustrates the application of Pd/SiO2 in ether formation. In the case of Pd–Na/SiO2, only hydrogenation pathway was noticed regardless of solvent used. Moreover, the hydrogenation activity in isopropanol is relative lower in comparison with that in ethanol. We surmise that the hydrogen dissociation ability of Pd surface might be lowered in isopropanol.
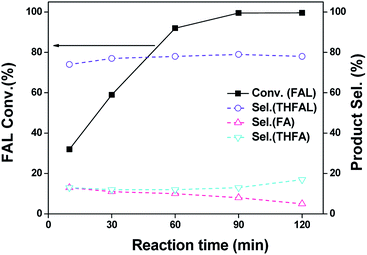 | ||
| Fig. 5 Furfural hydrogenation activity as a function of reaction time over Pd–Na/SiO2 in ethanol. Reaction conditions: 10 mL of 0.24 M FAL ethanol solution; 120 °C; 0.3 MPa H2; 100 mg catalyst. | ||
Effect of Na+ doping on the acetalization reaction
This study clearly shows that Pd–Na/SiO2 showed distinct behavior to Pd/SiO2. For Pd/SiO2 catalyst, FDA was formed as the predominant product in the first 10 min, meaning that acetalization of furfural with ethanol proceeded fast over Pd/SiO2 surface, whereas the acetalization could not take place over Pd–Na/SiO2 catalyst. Stimulated by this finding, we have compared the acetalization activity of Pd/SiO2 and Pd–Na/SiO2 and the results shown in Table S2† suggested that the acetalization could take place smoothly over Pd/SiO2. SiO2 gave 51% furfural conversion (Table S3†) after reaction for 30 min. After loading Pd, the Pd/SiO2 showed furfural conversion of 44% under the identical reaction conditions. No acetalization was observed for Pd–Na/SiO2 catalyst. Previous studies have shown that the acetalization could be catalyzed by Brønsted acid sites on zeolites including USY, beta and H-mordenite.14 We believe that the weak acidity of silanol groups on SiO2 was active for acetalization and its activity was not affected by Pd deposition. Once the SiO2 was treated with NaOH solution, the exchange of Si–OH and Na+ would lead to the formation of Si–ONa species, which explains the loss of acetalization activity of SiO2–Na and Pd–Na/SiO2. This result is consistent with the finding that Na-mordenite was nearly inert toward acetalization.14 Since the production of EFE is strongly associated to the formation of FDA in the reductive-etherification process, it is expected that no EFE could be produced during the furfural hydrogenation over Pd–Na/SiO2. Similarly, no EFE formation was observed for Pd–K/SiO2 catalyst where K+ instead of Na+ is introduced (Fig. S3†), pointing to the general role of alkaline cations.Effect of Na+ doping on the hydrogenolysis of FDA
Another unsolved issue is that whether the presence of Na+ affects the hydrogenation or hydrogenolysis of FDA over Pd NPs, which is the second step of reductive-etherification process. To clarify this point, we have compared the hydrogenation performance of Pd/SiO2 and Pd–Na/SiO2 by using FDA as substrate. Table 1 shows the FDA conversion and product distribution over Pd/SiO2 catalyst under different reaction conditions. We first tested the activity at 120 °C and 0.3 MPa, which is the optimum reaction condition for EFE synthesis in this study. One can see that total conversion of FDA was obtained within 10 min when 100 mg catalyst was used. The products were mainly composed of THFDA (38%) and THEFE (23%). The product distribution did not change upon further reaction for another 20 min. Then we decreased the catalyst amount to 20 mg and the FAL conversion was 95% after 10 min reaction. The products included THFDA (52%), THEFE (25%) and EFE (10%). Further decrease of the reaction temperature to 80 °C and the catalyst amount to 10 mg gave FDA conversion of 32% after 10 min reaction, with THFDA being the dominating product (sel. 79%). The total selectivity of EFE and THEFE were 17% in 10 min. Further prolonging the reaction time to 30 min led to 84% conversion of FDA without any change in product distribution.| Entry | Time (min) | Conv.d (%) | Products sel.e (%) | ||||
|---|---|---|---|---|---|---|---|
| THFDA | EFE | THEFE | THFA | Others | |||
| a Reaction temperature 120 °C, catalyst loading 100 mg.b Reaction temperature 120 °C, catalyst loading 20 mg.c Reaction temperature 80 °C, catalyst loading 10 mg.d Conversion of furfural diethyl acetal.e THFDA: tetrahydrofurfural diethyl acetal; EFE: ethyl furfural ether; THEFE: tetrahydroethyl furfural ether; THFA: tetrahydrofurfuryl alcohol; others: products formed by EFE decomposition. | |||||||
| 1a | 10 | 100 | 38 | 0 | 23 | 3 | 36 |
| 30 | 100 | 39 | 0 | 25 | 3 | 33 | |
| 2b | 10 | 95 | 52 | 10 | 25 | 2 | 11 |
| 30 | 100 | 50 | 0 | 32 | 2 | 16 | |
| 3c | 10 | 32 | 79 | 7 | 10 | 3 | 0 |
| 30 | 84 | 78 | 3 | 16 | 2 | 0 | |
By comparing the product distribution of reactions starting with furfural and FDA on Pd/SiO2, two findings should be noted. First, THFDA was formed in a moderate yield starting with FDA, while it was observed in a minute yield starting with FAL. We propose that the competitive adsorption of FAL and/or FA with FDA over Pd surface occurs, thus inhibiting the hydrogenation of furan ring in FDA while favoring the hydrogenolysis of C–O–C bond. This assumption has been verified by testing the hydrogenation activity of FDA in presence of FAL or FA over Pd/SiO2 catalyst. The results in Table S4† showed that the FDA conversion decreased significantly after adding 20 μL of furfural or FA. Moreover, the EFE selectivity was significantly improved by adding both reagents. These results well explained the stable selectivity of EFE in the first 90 min when furfural was used as reactant. Second, EFE was only detected when less amount of catalyst or lower reaction temperature were employed. The possible explanation is that over-hydrogenation of EFE was very fast so that the produced EFE could not be observed under higher reaction temperatures.
We also tested the activity of Pd–Na/SiO2 in FDA hydrogenation at 80 °C and 0.3 MPa H2. The results in Fig. 6 suggests that THFDAwas always the major product in 120 min (sel. > 95%), meaning that the hydrogenation of furan-ring dominated the reaction process over Pd–Na/SiO2. These results suggest that Pd nanoparticles coordinated with Na+ are highly selective in hydrogenation of furan ring. One could also see that the reaction rate of FDA hydrogenation on Pd–Na/SiO2 was half of that on Pd/SiO2 (Table 1, Entry 3). We may conclude that the presence of Na+ partially deactivates the hydrogenation activity of furan ring while totally inhibits the hydrogenolysis reaction pathway. This behaviour is also consistent with previous finding over I–Pd/Al2O3 and NaI–Pd/Al2O3.7c Apparently the residue Na+ affects the electronic property of Pd nanoparticles according to the CO-IR adsorption. However, the nature of Na+–Pd interaction is still not clear at this stage. Further study on the coordination of C![[double bond, length as m-dash]](https://www.rsc.org/images/entities/char_e001.gif) C or C–O–C group on Pd surface would be helpful for elucidating the competition between hydrogenation and hydrogenolysis. Nevertheless, the observation in this study well explains the low selectivity of Pd catalysts with residue Na+ in reductive-etherification of furfural.
C or C–O–C group on Pd surface would be helpful for elucidating the competition between hydrogenation and hydrogenolysis. Nevertheless, the observation in this study well explains the low selectivity of Pd catalysts with residue Na+ in reductive-etherification of furfural.
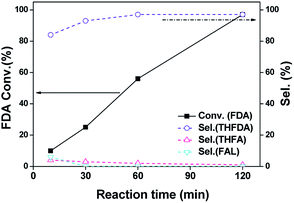 | ||
| Fig. 6 Catalytic performance of Pd–Na/SiO2 for the hydrogenation of FDA. Reaction conditions: 10 mg catalyst, 10 mL of 0.24 M FDA ethanol solution; 80 °C, 0.3 MPa H2. | ||
Conclusions
In summary, we herein systematically studied the hydrogenation/reductive-etherification of furfural in alcohol over Pd/SiO2 catalysts with/without Na+ modification. The Pd/SiO2 catalyst without Na+ was active and selective for reductive etherification under mild conditions by forming furfural acetal as key intermediate. The Pd/SiO2 modified with Na+ was found to be solely active in hydrogenation of furan ring and C![[double bond, length as m-dash]](https://www.rsc.org/images/entities/char_e001.gif) O group. The role of Na+ in changing the reaction pathways of furfural hydrogenation can be explained in two folds: (i) the ion-exchange of Na+ and Si–OH leads to for formation of Si–ONa, which is not active for acetalization; (ii) the structure/electronic property of Pd nanoparticles was strongly altered by doping Na+, thus showing high selectivity in hydrogenation of furan ring while losing its activity in hydrogenolysis of C–O–C bond.
O group. The role of Na+ in changing the reaction pathways of furfural hydrogenation can be explained in two folds: (i) the ion-exchange of Na+ and Si–OH leads to for formation of Si–ONa, which is not active for acetalization; (ii) the structure/electronic property of Pd nanoparticles was strongly altered by doping Na+, thus showing high selectivity in hydrogenation of furan ring while losing its activity in hydrogenolysis of C–O–C bond.
Experimental
Catalyst preparation
The SiO2 support was Evonik Degussa Aerosil® 200 (surface area: 208 m2 g−1). Pd/SiO2 catalysts were prepared by wet impregnation method. In a typical preparation, 0.6 g of silica support was impregnated with 2 mL ethanol containing 0.57 mL H2PdCl4 aqueous solution (21.512 gPd L−1). The sample was dried at 80 °C for 10 h and calcined in air at 550 °C for 5 h. Pd–Na/SiO2 catalyst was prepared by a typical deposition–precipitation method. In a typical preparation, 0.6 g silica support was dispersed in H2O (20 mL) with vigorous stirring for 1 h. 0.57 mL of H2PdCl4 aqueous solution (21.512 gPd L−1) was added to the mixture, and then the mixture was stirred for 1 h. The pH value of the suspension was adjusted to 10 by adding NaOH solution (1 M). The slurry was stirred for another 1 h, filtered, washed with deionized water, and finally dried at 80 °C overnight and calcined in air at 550 °C for 5 h. The Pd loading was determined by inductively coupled plasma (ICP) with Thermo IRIS Intrepid II XSP atomic emission spectrometer. The catalysts were digested using certain amount of aqua regia and the obtained solutions were diluted to the desired concentration with deionized water before test.Materials characterization
Nitrogen adsorption–desorption isotherms at −196 °C were obtained on a BELSORP-Max equipment. Prior to the test, the samples were first degassed at 150 °C under vacuum for 6 h. Specific surface areas (SSA) were calculated according to the Brunauer–Emmett–Teller (BET) method using five relative pressure points in the interval of 0.05–0.30. The powder X-ray diffraction (XRD) patterns were collected on Rigaku Ultima IV X-ray diffractometer using Cu Kα radiation (λ = 1.5405 Å) operated at 35 kV and 25 mA. Transmission electron microscopy (TEM) images were taken on FEI Tecnai G2 F30 microscope operating at 300 kV. The average Pd particle size was calculated by dTEM= (∑nidi3)/(∑nidi2) by measuring at least 100 particles. The X-ray photoelectron spectroscopy (XPS) was recorded on an ESCALAB 250xi spectrometer with a monochromated Al Kα X-ray source (hν = 1486.6 eV) at base pressure of 8 × 10⁻¹⁰ Pa. Fourier transform infrared (FT-IR) CO adsorption on fresh and reduced samples was performed on a Nicolet iS50 spectrometer equipped with a home-made in situ cell (32 scans with resolution of 4 cm−1). Catalyst samples were pressed to self-supporting wafers about 9–12 mg with diameter of 11 mm. For CO adsorption on fresh sample, the wafer was dehydrated in N2 with flow rate of 30 mL min−1 at 100 °C for 30 min. After cooling to room temperature, a spectrum was recorded and used as background for subtraction. Then, CO was introduced into the in situ cell by flowing high purity CO gas with flow rate about 10 mL min−1 for 3 min. Afterwards, the in situ cell was flushed by N2 at room temperature for certain period to remove the gas phase CO. For CO adsorption on reduced sample, the wafer was flushed in 30 mL min−1 N2/H2 at 120 °C for 30 min and then cooled down to 30 °C in N2.Catalytic tests
The reductive etherification/hydrogenation of furfural was conducted in a Teflon-lined (60 mL) steel batch reactor. No pretreatment on the catalysts was conducted prior to each reaction. The reactor was charged with 9.8 mL of ethanol, 0.2 mL of furfural and 10–100 mg of catalyst, and the mixture was stirred under 0.3–1 MPa H2 pressure at 80–120 °C. After reaction for desired period, H2 was released and the liquid was diluted with ethanol before analysis. The products were analyzed with a flame ionization detector (FID) and the capillary column of DB-FFAP (30 m length and 0.25 mm internal diameter). The mass spectra of some products were recorded on a Shimadzu GCMS-QP2010SE instrument equipped with an Rxi-5Sil MS (30 m × 0.25 mm × 0.25 μm).Conflicts of interest
There are no conflicts to declare.Acknowledgements
We acknowledge the financial support from China Ministry of Science and Technology under contract of 2016YFA0202804, the National Natural Science Foundation of China (Grant No. 21773067, 21533002) and the Open Research fund of Shanghai Key Laboratory of Green Chemistry and Chemical Processes.Notes and references
- (a) A. Corma, S. Iborra and A. Velty, Chem. Rev., 2007, 107, 2411 CrossRef CAS PubMed; (b) W. Leitner, J. Klankermayer, S. Pischinger, H. Pitsch and K. Kohse-Hçinghaus, Angew. Chem., Int. Ed., 2017, 56, 5412 CrossRef CAS PubMed.
- (a) J. Lange, E. van der Heide, J. V. Buijtenen and R. Price, ChemSusChem, 2012, 5, 150 CrossRef CAS PubMed; (b) A. M. Ruppert, K. Weinberg and R. Palkovits, Angew. Chem., Int. Ed., 2012, 51, 2564 CrossRef CAS PubMed; (c) M. Balakrishnan, E. R. Sacia and A. T. Bell, ChemSusChem, 2014, 7, 2796 CrossRef CAS PubMed; (d) R. Mariscal, P. Maireles-Torres, M. Ojeda, I. Sadaba and M. Lopez Granados, Energy Environ. Sci., 2016, 9, 1144 RSC; (e) K. Gupta, R. K. Rai and S. K. Singh, ChemCatChem, 2018, 10, 2326 CrossRef CAS.
- (a) W. Leitner, J. Klankermayer, S. Pischinger, H. Pitsch and K. Kohse-Hçinghaus, Angew. Chem., Int. Ed., 2017, 56, 5412 CrossRef CAS PubMed; (b) J. E. Rorrer, A. T. Bell and F. Dean Toste, ChemSusChem, 2019, 12, 2835 CrossRef CAS PubMed.
- (a) P. Neves, M. M. Antunes, P. A. Russo, J. P. Abrantes, S. Lima, A. Fernandes, M. Pillinger, S. M. Rocha, M. F. Ribeiro and A. A. Valente, Green Chem., 2013, 15, 3367 RSC; (b) Z. Yuan, Z. Zhang, J. Zheng and J. Lin, Fuel, 2015, 150, 236 CrossRef CAS.
- G. M. Gonzalez Maldonado, R. S. Assary, J. Dumesic and L. A. Curtiss, Energy Environ. Sci., 2012, 5, 8990 RSC.
- D. R. Chaffey, T. E. Davies, S. H. Taylor and A. E. Graham, ACS Sustainable Chem. Eng., 2018, 6, 4996 CrossRef CAS.
- (a) M. Balakrishnan, E. R. Sacia and A. T. Bell, Green Chem., 2012, 14, 1626 RSC; (b) R. Pizzi, R. van Putten, H. Brust, S. Perathoner, G. Centi and J. C. van der Waal, Catalysts, 2015, 5, 2244 CrossRef CAS; (c) D. Wu, W. Y. Hernandez, S. W. Zhang, E. I. Vovk, X. H. Zhou, Y. Yang, A. Y. Khodakov and V. V. Ordomsky, ACS Catal., 2019, 9, 2940 CrossRef CAS; (d) Y. Wang, Q. Cui, Y. Guan and P. Wu, Green Chem., 2018, 20, 2110 RSC; (e) C. Li, G. Xu, X. Liu, Y. Zhang and Y. Fu, Ind. Eng. Chem. Res., 2017, 56, 8843 CrossRef CAS.
- (a) Y. Nakagawa, K. Takada, M. Tamura and K. Tomishige, ACS Catal., 2014, 4, 2718 CrossRef CAS; (b) R. R. Chada, S. S. Enumula, K. S. Koppadi, V. R. B. Gurram, S. R. R. Kamaraju and D. R. Burri, ChemistrySelect, 2018, 3, 9946 CrossRef CAS.
- (a) S. Nishimura and T. Itaya, Chem. Commun., 1967, 422 RSC; (b) V. Bethmont, C. Montassier and P. Marecot, J. Mol. Catal. A: Chem., 2000, 152, 133 CrossRef CAS; (c) T. T. Pham, S. P. Crossley, T. Sooknoi and L. L. Lobban, Appl. Catal., A, 2010, 379, 135 CrossRef CAS.
- N. S. Date, N. S. Biradar, R. C. Chikate and C. V. Rode, ChemistrySelect, 2017, 2, 24 CrossRef CAS.
- Y. Bi and G. Lu, Appl. Catal., B, 2003, 41, 279 CrossRef CAS.
- (a) R. Pellegrini, G. Leofanti, G. Agostini, L. Bertarione, S. Bertarione, E. Groppo, A. Zecchina and C. Lamberti, J. Catal., 2009, 267, 40 CrossRef CAS; (b) N. M. Martin, M. van den Bossche, H. Gronbeck, C. Hakanoglu, F. Zhang, T. Li, J. Gustafson, J. F. Weaver and E. Lundgren, J. Phys. Chem. C, 2014, 118, 1118 CrossRef CAS; (c) Y. Zhang, Y. Cai, Y. Guo, H. Wang, L. Wang, Y. Lou, Y. Guo, G. Lu and Y. Wang, Catal. Sci. Technol., 2014, 4, 3973 RSC.
- L. F. Liotta, G. A. Martin and G. Deganello, J. Catal., 1996, 164, 322 CrossRef CAS.
- J. M. Rubio-Caballero, S. Saravanamurugan, P. Maireles-Torres and A. Riisager, Catal. Today, 2014, 234, 233 CrossRef CAS.
Footnote |
| † Electronic supplementary information (ESI) available: Textural properties, XPS, and acetalization and hydrogenation activity of Pd catalysts. See DOI: 10.1039/c9ra05281j |
| This journal is © The Royal Society of Chemistry 2019 |

