 Open Access Article
Synthesis, oxide formation, properties and thin film transistor properties of yttrium and aluminium oxide thin films employing a molecular-based precursor route†
Nico
Koslowski
a,
Rudolf C.
Hoffmann
a,
Vanessa
Trouillet
b,
Michael
Bruns
b,
Sabine
Foro
c and
Jörg J.
Schneider
 *a
*a
aFachbereich Chemie, Eduard-Zintl-Institut für Anorganische und Physikalische Chemie, Technische Universität Darmstadt, Alarich-Weiss-Str. 12, 64287 Darmstadt, Germany
bInstitute for Applied Materials (IAM-ESS), Karlsruhe Nano Micro Facility (KNMF), Karlsruhe Institute of Technology (KIT), Hermann-von-Helmholtz-Platz 1, 76344 Eggenstein-Leopoldshafen, Germany
cDepartment of Material Science, Technische Universität Darmstadt, Alarich-Weiss-Str. 8, 64287 Darmstadt, Germany
First published on 2nd October 2019
Abstract
Combustion synthesis of dielectric yttrium oxide and aluminium oxide thin films is possible by introducing a molecular single-source precursor approach employing a newly designed nitro functionalized malonato complex of yttrium (Y-DEM-NO21) as well as defined urea nitrate coordination compounds of yttrium (Y-UN 2) and aluminium (Al-UN 3). All new precursor compounds were extensively characterized by spectroscopic techniques (NMR/IR) as well as by single-crystal structure analysis for both urea nitrate coordination compounds. The thermal decomposition of the precursors 1–3 was studied by means of differential scanning calorimetry (DSC) and thermogravimetry coupled with mass spectrometry and infrared spectroscopy (TG-MS/IR). As a result, a controlled thermal conversion of the precursors into dielectric thin films could be achieved. These oxidic thin films integrated within capacitor devices are exhibiting excellent dielectric behaviour in the temperature range between 250 and 350 °C, with areal capacity values up to 250 nF cm−2, leakage current densities below 1.0 × 10⁻⁹ A cm−2 (at 1 MV cm−1) and breakdown voltages above 2 MV cm−1. Thereby the increase in performance at higher temperatures can be attributed to the gradual conversion of the intermediate hydroxy species into the respective metal oxide which is confirmed by X-ray photoelectron spectroscopy (XPS). Finally, a solution-processed YxOy based TFT was fabricated employing the precursor Y-DEM-NO21. The device exhibits decent TFT characteristics with a saturation mobility (μsat) of 2.1 cm2 V−1 s−1, a threshold voltage (Vth) of 6.9 V and an on/off current ratio (Ion/off) of 7.6 × 10⁵.
Introduction
High-k dielectrics based on metal oxides have gained remarkable attention due to their applicability for a variety of electronic and optoelectronic applications.1 To date, most of the oxide thin-film transistors (TFTs) reported are based on the conventional dielectric SiO2, which may exhibit a higher leakage current and hence require higher operational voltages to enhance the electronic properties of the TFTs.2,3 Although significant progress has been achieved in terms of oxide semiconductors, investigations concerning the application of novel oxide dielectrics are still helpful to improve the current situation. Currently, various binary metal oxides like TiO2,4 Ta2O5,5 HfO2,6 ZrO2,4,7–9 Al2O34,10–13 and Y2O34,14–18 have already shown promising results and with respect to their electronic performance, they are in the realm that they potentially can replace SiO2 as gate dielectric in TFT devices.However, these high-k materials are mostly deposited by expensive vacuum-based processes and create challenges in processing in order to further extend their application towards large-area applications.19 Hence, a significant amount of research has been dedicated to the solution processing of amorphous metal oxides due to the possibility of cost-efficient, large-area deposition as well as the use of printing techniques to deposit these building blocks for electronic applications.2,19,20 Among the various high-k dielectrics, solution-processed amorphous aluminium oxide, Al2O3, has already demonstrated its potential as excellent choice for the use as gate dielectric in TFTs.4,21 Thereby, its impressive dielectric performance can be related to a minor accumulation of charge carriers within the bulk dielectric and a small trap density at the semiconductor/dielectric interface.4 Recently, amorphous aluminium oxide thin films with very good dielectric properties are also accessible by a molecular single-source precursor approach reported by our group.22 We have devised a route to AlxOy dielectric, its synthesis and structural elucidation by employing the molecular coordination compound tris[(diethyl-2-nitromalonato)]aluminium(III) (Al-DEM-NO2).
Yttrium oxide, Y2O3, is yet another promising high-k material due to a combination of favourable individual electrical properties like a wide bandgap (5.8 eV), a high refractive index (1.9–2.0), a high dielectric constant (14–18), a low dissipation factor (<0.005) and finally a high breakdown voltage (>3 MV cm−1).23 Furthermore, Y2O3 has the ability to interact intimately with the oxide semiconductor by forming a chemical surface bond leading to an improved interaction and formation of an intimate dielectric-semiconductor interface. As a result, low electron trap densities and thus low leakage currents can be realized.24 Despite such advantages, only a few studies have investigated the potential towards its application in TFT technology. Adamopolous et al. executed a direct comparison between solution-processed Al2O3 and Y2O3 dielectrics, using aluminium acetylacetonate and yttrium acetylacetonate hydrate as precursors. Al2O3 and Y2O3 dielectric thin films were deposited by spray pyrolysis and subsequent calcined at 400 °C in air. As a result, electrical measurements performed in vacuum (10−5 mbar) revealed a significantly higher capacitance for the Y2O3 based dielectrics.18 Liu et al. demonstrated the fabrication of Y2O3 dielectrics via an aqueous route, using yttrium nitrate hydrate as the precursor and deionized water as solvent. The thin films were deposited by means of spin-coating and subsequent calcination at 300 °C. The generated Y2O3 dielectric exhibited very low leakage current (10−9 A cm−2 at 1 MV cm−1) and a dielectric constant of 14.8 15.
In general, the majority of the studies use conventional metal salts like nitrates14,15,17,25–27 or chlorides10,12,13,28 as precursors, which possess some drawbacks like the additional requirement for additives or stabilizers, which exert an uncertainty on the film formation and thus the electrical properties of the final device. In the case of metal chlorides, acidic by-products like HCl or Cl−-ion trace impurity present in the final ceramic can deteriorate the overall device performance.29–31
A meaningful strategy to circumvent such disadvantages is the use of molecular precursors, which typically start to decompose at moderate temperatures of about 200 °C. As a drawback, organic residues from the ligand framework remain in the dielectric thin films at low annealing temperatures. The complete decomposition of the ligand framework usually requires temperatures up to 500 °C. A common approach dealing with that issue uses the systematic introduction of reactive nitro or nitroso functionalities into the ligand framework, enhancing the exothermic nature of the decomposition of the precursor.32,33 Herein we have chosen diethyl-2-nitromalonate as ligand in the yttrium oxide single-source precursor molecule. A common approach used is “combustion synthesis”, which is based on a “fuel/oxidizer” reaction and enables a complete conversion of the precursor at much lower temperatures which are typically employed in decomposition reactions. Often, urea or acetylacetone serve as “fuel” and metal nitrates as “oxidizer”. Initiated by the thermal decomposition, redox reactions between the nitrate anion and the urea molecules occur, enhancing the conversion into the metal oxide and leading to various nitrogen compounds as by-products. Concerning solution-processed dielectrics this approach already showed good applicability. However, the detailed decomposition mechanism of the combustion synthesis has not been clarified in full so far. Besides that, aqueous solutions of metal nitrates and urea as additive usually require ageing of the solution over a more extended period of time to initiate the combustion effect. In order to gain more control and reproducibility in the combustion process, we have chosen a new approach combining the “oxidizer” (nitrate ions) and the “fuel” (urea ligands) in one defined coordination compound predefined in one molecule. This facilitates systematic studies of the respective metal oxide formation in a more accurate manner.
In this work we demonstrate the synthesis and structural elucidation of bis(diethyl-2-nitromalonato) nitrato yttrium(III) 1 as well as urea nitrate coordination compounds of yttrium(III) 2 and aluminium(III) 3 and their applicability as molecular single-source precursor for the formation of dielectric thin films of yttrium oxide and aluminium oxide, respectively. The molecular structures of the new oxide precursor compounds 2 and 3 were identified by single-crystal X-ray diffraction and spectroscopic techniques (IR, 1H-, 13C-, DEPT- and 27Al-NMR). The oxide dielectric thin films were obtained by spin-coating of the respective molecular precursor, using either 2-methoxyethanol as solvent in the case of 1 and water for 2 and 3. Subsequent calcination at moderate temperatures between 250 and 350 °C of these precursor molecules occur without requirement of any additive and yields dielectric thin films with excellent electrical performances. Precursor 1, 2 and 3 are thus capable for the solution processing of aluminium and yttrium oxide and their subsequent use as gate dielectrics in TFTs.
Experimental section
Synthesis and characterization
![[double bond, length as m-dash]](https://www.rsc.org/images/entities/char_e001.gif) O) ppm.
O) ppm.
IR = 2985 (s, νCH), 2941 (s, νCH), 1742 (s, νC = O), 1638 (s, νN = O), 1426 (s, νas,N–O), 1323 (s, νCN), 1255 (s, νs,N–O), 1067 (s, νC–O), 862 (s, δO=N–O).
![[double bond, length as m-dash]](https://www.rsc.org/images/entities/char_e001.gif) O) ppm.
O) ppm.
IR = 3472 (s, νNH), 3366 (s, νNH), 3212 (s, νNH), 1625 (s, νCO), 1578 (s, δNH), 1489 (s, νNO), 1468 (s, νNO), 1448 (s, νNO), 1397 (s, νNO), 1343 (s, νCN), 1294 (s, νCN), 1145 (m, δNH), 1030 (m, δNH), 819 (w, δNH), 772 (w, δNH), 745 (w, δNH), 584 (m, δCN), 527 cm−1 (m, δCN). The detailed crystallographic data for 2 is provided in the ESI.†
![[double bond, length as m-dash]](https://www.rsc.org/images/entities/char_e001.gif) O) ppm. 27Al NMR (500 MHz, [d4] methanol) δ = −9.6 (Al–O) ppm.
O) ppm. 27Al NMR (500 MHz, [d4] methanol) δ = −9.6 (Al–O) ppm.
IR = 3447 (s, νNH,out of phase), 3339 (s, νNH,in phase), 3234 (s, νNH,in phase), 1628 (s, νCO), 1571 (s, δNH), 1501 (s, δNH), 1331 (s, νCN), 1153 (m, δNH), 1035 (m, δNH), 828 (w, δNH), 763 (w, δNH), 618 (m, δCN), 541 (m, δCN), 421 cm−1 (m, δNH). The detailed crystallographic data for 3 is provided in the ESI.†
Thin-film transistor fabrication
For the fabrication of the TFT device an indium zinc oxide (IZO) semiconductor was introduced by employing established oximato precursor compounds, previously reported by our group.22,34–36 Solutions of the respective indium and zinc precursors were prepared by dissolving 1 wt% in 2-methoxyethanol (ratio In![[thin space (1/6-em)]](https://www.rsc.org/images/entities/char_2009.gif) :
:![[thin space (1/6-em)]](https://www.rsc.org/images/entities/char_2009.gif) Zn, 6
Zn, 6![[thin space (1/6-em)]](https://www.rsc.org/images/entities/char_2009.gif) :
:![[thin space (1/6-em)]](https://www.rsc.org/images/entities/char_2009.gif) 4), spin-coated at 2500 rpm for 20 seconds onto the YxOy-(1)-350 dielectric and subsequently annealed at 350 °C. Performing of three iterations of the coating procedure results in a film thickness of ∼12 nm.
4), spin-coated at 2500 rpm for 20 seconds onto the YxOy-(1)-350 dielectric and subsequently annealed at 350 °C. Performing of three iterations of the coating procedure results in a film thickness of ∼12 nm.
Finally, gold source-drain electrodes (W/L = 2 mm/100 mm) were sputter deposited onto the IZO semiconductor, using a shadow mask (2 rectangular areas of 2 mm × 1 mm, separated by a distance of 150 μm).
Materials characterization
NMR-spectroscopy was carried out at 500 MHz using a DRX500 spectrometer (Bruker BioSpin GmbH). IR-spectroscopy was carried out on a Nicolet 6700 (Thermo Fisher Scientific). The samples were measured in attenuated total reflection (ATR) without additional preparation. Thermogravimetric analysis (TGA) coupled with mass spectrometry (MS) and infrared (IR) spectroscopy was performed using TG 209N1 (Netzsch) coupled with Aelos QMS 403C (Netzsch) and a Nicolet iS10 spectrometer (Thermo Fisher Scientific). The samples were measured in an oxygen-atmosphere with a heating rate of 2.5 or 5 K min−1, in the range of 50–800 °C, in a corundum crucible. Differential scanning calorimetry (DSC) was performed with STA 449 F3 Jupiter (Netzsch). X-ray diffraction (XRD) measurements were carried out using a MiniFlex 600 (Rigaku), using Cu-Kα-radiation (600 W) in Bragg-Brentano geometry. Transmission electron microscopy (TEM) was carried out with an operating voltage of 200 kV, using a Tecnai F20 (FEI) system. The samples were prepared on lacey carbon-coated copper grids. Spectroscopic ellipsometry was carried out using a Woolham M-2000 V spectrometer (spectral range 370–1690 cm−1) using the completeEASE software (version 6.29). Atomic force microscopy (AFM) was performed using MFP-3D (Asylum Research) equipped with silicon cantilevers. X-ray photoelectron spectroscopy (XPS) measurements were performed on a K-Alpha(+) XPS system (Thermo Fisher Scientific, East Grinstead, UK). The monochromated Al Kα X-ray source was used at a spot size of 400 mm. All spectra are referenced to the C 1s peak of hydrocarbons at 285.0 eV.Electrical characterization
Impedance measurements were performed in a glovebox under inert conditions, using a ModuLab MTS System (Solartron Analytical Ltd) equipped with a probe station (Cascade Microtech, Inc). Impedance measurements were operated in the frequency range of 10 Hz to 100 kHz with amplitudes of 500 mA. The measurements of the breakdown voltage were carried out on a B1500A semiconductor device analyzer (Agilent).TFT transfer and output characteristics were determined using a HP 4155A semiconductor parameter analyzer (Agilent) in a glove box under inert conditions.
Results and discussion
Synthesis of precursor molecules and materials characterization
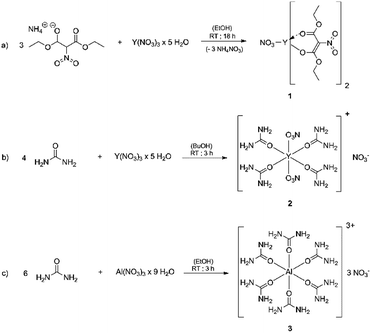
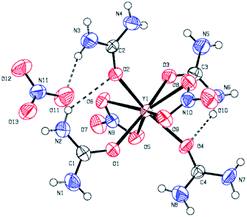
The coordination compounds [Y(urea)4(NO3)2][NO3] 2 and [Al(urea)6][NO3]33 were synthesized by the reaction of the respective metal nitrate hydrates with stoichiometric amounts of urea, using n-butanol for 2 and ethanol for 3 as solvent (Fig. 1). Compound 2 crystallizes in the space group P![[1 with combining macron]](https://www.rsc.org/images/entities/char_0031_0304.gif) (Fig. 2)and 3 crystallizes in the space group P21/n. In both cases the neutrally charged urea molecules act as monodentate ligands and coordinate to the central metal atom by its oxygen atom in accord with Pearson's hard/soft acid base concept. For compound 2 the central metal is coordinated by four urea and two nitrate molecules, whereby the nitrate molecules act as bidentate ligands and coordinate to the yttrium centre by two oxygen atoms, leading to a double capped trigonal prism with coordination number eight for Y3+. Although crystal quality of 3 so far precluded a satisfactory crystal structure refinement, a preliminary refinement allows to determine the connectivity giving an octahedral coordination (Fig. S1 ESI†). Additionally, the octahedral coordination environment of the aluminium centre in 3 is confirmed by 27Al-NMR spectroscopy (Fig. S10†) giving a singlet peak at −9.6 ppm which is attributed to the octahedral coordination of the aluminium centre. The compound hexakis(urea) aluminium(III)-chloride, exhibits a comparable coordination environment to precursor 3 displaying a singlet peak at −7.6 ppm in the 27Al-NMR spectrum.37 Although synthesis of the aluminium compound 3 has been reported,37,38 its versatility with respect to an application was not demonstrated so far. Hexakis(urea) nitrate compounds with trivalent metal cations are also known for iron,38 indium and gallium,39 the latter two have been reported by our group, recently. [Metal(urea)4(NO3)2][NO3] compounds as in the case of 2 are not known so far. A comparable compound exhibits three monodentate tetramethylurea ligands and three bidentate nitrate anions. Thereby the coordination polyhedron is a tricapped trigonal prism with coordination number nine for the yttrium central cation.40
(Fig. 2)and 3 crystallizes in the space group P21/n. In both cases the neutrally charged urea molecules act as monodentate ligands and coordinate to the central metal atom by its oxygen atom in accord with Pearson's hard/soft acid base concept. For compound 2 the central metal is coordinated by four urea and two nitrate molecules, whereby the nitrate molecules act as bidentate ligands and coordinate to the yttrium centre by two oxygen atoms, leading to a double capped trigonal prism with coordination number eight for Y3+. Although crystal quality of 3 so far precluded a satisfactory crystal structure refinement, a preliminary refinement allows to determine the connectivity giving an octahedral coordination (Fig. S1 ESI†). Additionally, the octahedral coordination environment of the aluminium centre in 3 is confirmed by 27Al-NMR spectroscopy (Fig. S10†) giving a singlet peak at −9.6 ppm which is attributed to the octahedral coordination of the aluminium centre. The compound hexakis(urea) aluminium(III)-chloride, exhibits a comparable coordination environment to precursor 3 displaying a singlet peak at −7.6 ppm in the 27Al-NMR spectrum.37 Although synthesis of the aluminium compound 3 has been reported,37,38 its versatility with respect to an application was not demonstrated so far. Hexakis(urea) nitrate compounds with trivalent metal cations are also known for iron,38 indium and gallium,39 the latter two have been reported by our group, recently. [Metal(urea)4(NO3)2][NO3] compounds as in the case of 2 are not known so far. A comparable compound exhibits three monodentate tetramethylurea ligands and three bidentate nitrate anions. Thereby the coordination polyhedron is a tricapped trigonal prism with coordination number nine for the yttrium central cation.40
It is noteworthy that the nitrate counter anion is crucial for the strong thermal decomposition of these complexes. This is due to the fuel/oxidizer reaction between the urea molecules and the nitrate species, resulting in an effective conversion of the ligand sphere and the formation of the respective metal oxides at moderate combustion temperatures.
The thermal decomposition of 1, 2 and 3 was carried out in an oxygen atmosphere to get an insight in the decomposition by-products of the precursors. The decomposition behavior of the yttrium precursors proceeded as a multi-step decomposition whereby significant mass loss occurs in the first step itself. The aluminium precursor proceeds as a one-step decomposition. The residual mass of all the precursors are in good agreement with the expected ceramic yield from the decomposition of the precursors in oxygen 1: CYcalc. 20.19%, CYmeas. 19.49%; 2: CYcalc. 21.92%, CYmeas. 22.73% and 3: CYcalc. 8.90%, CYmeas. 10.10%.
Differential scanning calorimetry (DSC) for 1 shows exothermic peaks at about 170, 235, 400 and 500 °C (Fig. 3b). The DSC for 2 displays a sharp exothermic peak between 100–150 °C, followed by less intense peaks between 250–300 °C. In the case of 3 the DSC shows a sharp exothermic peak at 225 °C, followed by less intense peaks between 250–300 °C. Furthermore, the differential scanning calorimetry of precursor 2 and 3 indicate a strong exothermic decomposition, which corresponds to the expected fuel/oxidizer reaction between the urea molecules and the nitrate anions. In order to investigate the gaseous decomposition products a thermogravimetric analysis with in situ mass spectrometry (Fig. 4) and infrared spectroscopy (Fig. 5) detection at the maximum of the Gram–Schmidt signal (120 °C for 1, 230 and 340 °C for 2 and 210 °C for 3) was performed.
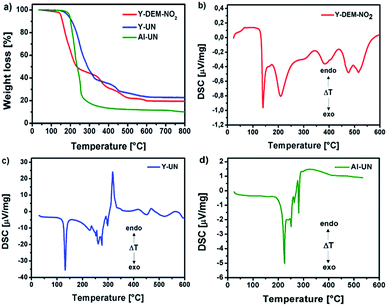 | ||
| Fig. 3 (a) Thermo gravimetric analysis of 1, 2 and 3 in an oxygen atmosphere and (b–d) differential scanning calorimetry (DSC) for 1, 2 and 3. | ||
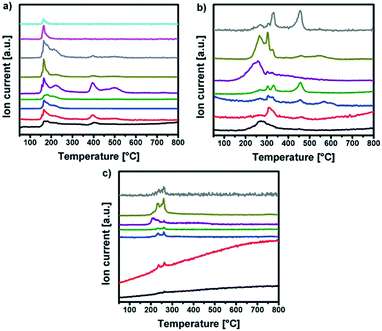 | ||
| Fig. 4 MS intensities of (a) Y-DEM-NO21, (b) Y-UN 2 and (c) Al-UN 3 for m/z+ peaks corresponding to the TG curves in Fig. 3 respectively. | ||
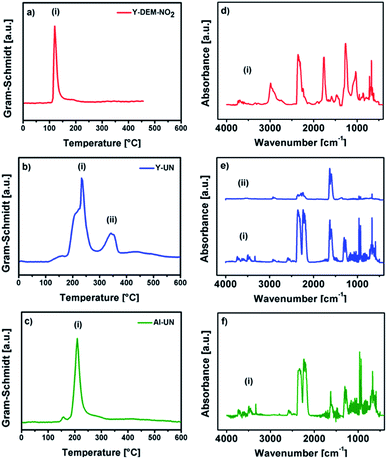 | ||
| Fig. 5 Gram–Schmidt intensities (a–c) of 1, 2 and 3 and the corresponding IR signal intensities (d–f) according to the Gram–Schmidt signals of the precursors, respectively. | ||
Regarding 1 the detected gases could be assigned to water (m/z+ 18), carbon monoxide (m/z+ 28), nitric oxide (m/z+ 30), carbon dioxide (m/z+ 44) and nitrogen dioxide or ethanol (m/z+ 46). But also larger fragments of the ligand can be found like C2H5O (m/z+ 45), C3H5O2 (m/z+ 63) and C3H7O3 (m/z+ 91). The TG/IR at the maximum of the Gram–Schmidt signal confirms the release of carbon dioxide (CO2: 2309 and 3356 cm−1), as well as fragments containing alkyl groups (νCH 2987 and 2939 cm−1), and carbonyl groups (νC![[double bond, length as m-dash]](https://www.rsc.org/images/entities/char_e001.gif) O 1756 cm−1).
O 1756 cm−1).
Concerning precursors 2 and 3, the detected gaseous decomposition by-products are identical. Thereby, the releasing gases during the combustion synthesis could be assigned to ammonia (m/z+ 17), water (m/z+ 18), carbon monoxide (m/z+ 28), nitric oxide (m/z+ 30), isocyanic acid (m/z+ 43), carbon dioxide (m/z+ 44) and nitrogen dioxide (m/z+ 46).
The corresponding IR signals detected at the maximum of the Gram–Schmidt signal clearly confirm for both precursors the evolution of ammonia (NH3: 965 cm−1), isocyanic acid (HNCO: 2239 cm−1), carbon dioxide (CO2: 2310 and 2359 cm−1) and nitric acid (HNO3: 1629 and 1305 cm−1), which were detected at various decomposition stages in the temperature range between 200 °C and 350 °C. Nevertheless, a detailed mechanism for the thermal decomposition of the urea nitrate precursors remains challenging and is not clarified so far.
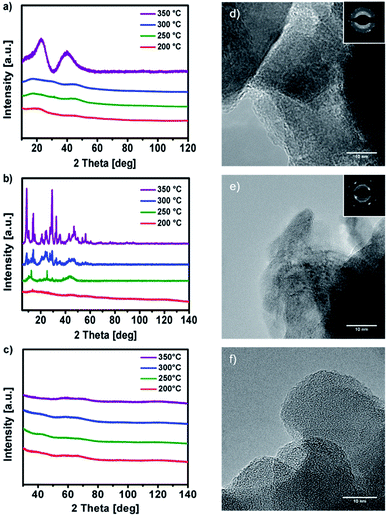
X-ray analysis of the solution-processed decomposition products of 1, 2 and 3 obtained at 200, 250, 300 and 350 °C (Fig. 6a, b and c) reveals a stepwise formation of the respective metal oxides. Thermal decomposition of 1 in the temperature range between 200–300 °C yields amorphous decomposition products, exhibiting first crystalline reflexes at 350 °C. After further annealing to 500 °C the material starts to crystallize, forming cubic Y2O3 in the space group Ia![[3 with combining macron]](https://www.rsc.org/images/entities/char_0033_0304.gif) (Fig. S12a ESI†). In case of 2 the thermal transformation already exhibits crystalline reflexes at 250 °C, finally forming cubic Y2O3 in the space group Ia
(Fig. S12a ESI†). In case of 2 the thermal transformation already exhibits crystalline reflexes at 250 °C, finally forming cubic Y2O3 in the space group Ia![[3 with combining macron]](https://www.rsc.org/images/entities/char_0033_0304.gif) at 600 °C (Fig. S12b ESI†). Thermal transformation of 3 in the temperature range between 200–350 °C (200, 250, 300 and 350 °C) reveal an amorphous AlxOy product throughout. Furthermore, the amorphous phase of AlxOy was confirmed by transmission electron microscopy, which revealed no crystalline domains on the nanometer scale (TEM, Fig. 6f). However, at an annealing temperature of 600 °C the AlxOy material starts to crystallize forming α-Al2O3 (Fig. S12c ESI†). The relatively low temperature of 600 °C for the formation of α-Al2O3, might be due to the strong exothermic fuel/oxidizer reaction between the urea molecules and the nitrate species during the decomposition of the precursor, resulting in local hot spots with higher temperatures.
at 600 °C (Fig. S12b ESI†). Thermal transformation of 3 in the temperature range between 200–350 °C (200, 250, 300 and 350 °C) reveal an amorphous AlxOy product throughout. Furthermore, the amorphous phase of AlxOy was confirmed by transmission electron microscopy, which revealed no crystalline domains on the nanometer scale (TEM, Fig. 6f). However, at an annealing temperature of 600 °C the AlxOy material starts to crystallize forming α-Al2O3 (Fig. S12c ESI†). The relatively low temperature of 600 °C for the formation of α-Al2O3, might be due to the strong exothermic fuel/oxidizer reaction between the urea molecules and the nitrate species during the decomposition of the precursor, resulting in local hot spots with higher temperatures.
The IR spectrum of the decomposition products of Y-DEM-NO21 and Y-UN 2 is shown in Fig. 7a and b. The sharp IR absorption bands in the range of 2900–3100 cm−1 are attributable to Y–O-vibrations of yttrium oxide. The characteristic broad absorption bands at about 3400 cm−1 are associated with the hydroxyl groups attributable to Y(OH)3 as well as to adsorbed water molecules which exhibit a deformation vibration mode at about 1590 cm−1.41
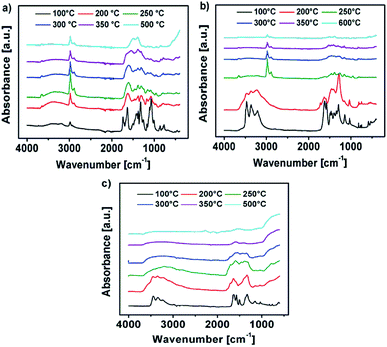 | ||
| Fig. 7 (a–c) IR spectra of the thermal transformation of the precursors 1, 2 and 3 into the respective metal oxides at various temperatures. | ||
The absorption bands at about 1400 cm−1 probably originate due to the presence of carbon-based adsorbents like C–H, C![[double bond, length as m-dash]](https://www.rsc.org/images/entities/char_e001.gif) C, C
C, C![[double bond, length as m-dash]](https://www.rsc.org/images/entities/char_e001.gif) O and possibly CO3−2-species due to the Lewis acidity of Y2O3.42 In the case of the samples YxOy-(1)-350, YxOy-(2)-350, YxOy-(2)-300 no other absorption bands are present, which could be attributed to organic residues.
O and possibly CO3−2-species due to the Lewis acidity of Y2O3.42 In the case of the samples YxOy-(1)-350, YxOy-(2)-350, YxOy-(2)-300 no other absorption bands are present, which could be attributed to organic residues.
At temperatures below 300 °C the samples exhibit some absorption bands from residual ligand fragments. Regarding precursor 2, the YxOy-(2)-200 sample exhibits NH stretching modes in the range of 3100–3500 cm−1, which originate from the amine groups of the urea ligands. For the YxOy-(2)-250 sample, these vibrational bands are not visible any longer.
Regarding the initial decomposition process of precursor 1, absorption bands in the range of 1300–1700 cm−1 vanish at first. These bands are attributable to NO2 stretching vibrations. For 1 absorption bands at about 3000 cm−1 are additionally expected for low annealing temperatures like 200 or 250 °C, which are attributed to ν-CH2 and ν-CH3 stretching modes originating from the ethyl framework of the 2-nitro-diethyl malonate ligand.22 Unfortunately, the Y–O-vibrations of yttrium oxide are located in the same range, resulting in overlaps of the vibrational bands. At an annealing temperature of 500 °C for precursor 1 and 600 °C in the case of precursor 2, the hydroxide is fully converted into yttrium oxide, showing no remaining signals of any organic constituents.
Fig. 7c shows the IR spectrum of the decomposition products of Al-UN 3. In the range of 3100–3400 cm−1 are characteristic broad absorption bands present, originating from hydroxyl groups attributable to Al(OH)3, as well as to adsorbed water molecules exhibiting a deformation vibration mode at about 1590 cm−1.41 Due to the Lewis acidity of Al2O3 the absorption bands at about 1400 cm−1 can also be assigned to the presence of carbon-based adsorbents like C–H, C![[double bond, length as m-dash]](https://www.rsc.org/images/entities/char_e001.gif) C, C
C, C![[double bond, length as m-dash]](https://www.rsc.org/images/entities/char_e001.gif) O and possibly CO3−2-species, similar as observed for the yttrium precursors 1 and 2. The absorption bands in the range of 400–900 cm−1 can be attributed to Al–O-vibrations of aluminium oxide.
O and possibly CO3−2-species, similar as observed for the yttrium precursors 1 and 2. The absorption bands in the range of 400–900 cm−1 can be attributed to Al–O-vibrations of aluminium oxide.
In the case of the samples AlxOy-350 and AlxOy-300, no additional absorption bands attributable to organic residues are present. At annealing temperatures of 200 and 250 °C the samples display some additional absorption bands from residual ligand fragments. For the AlxOy-200 sample NH stretching modes in the range of 3100–3500 cm−1 are present, originating from the amine groups of the urea ligands, similar as observed for 2. At an annealing temperature of 250 °C the NH stretching modes are vanished. Finally, at an annealing temperature of 500 °C, the hydroxide is fully converted into aluminium oxide. Additionally, morphology and texture of the obtained thin films, prepared at 350 °C, were investigated by atomic force microscopy (AFM). AFM images of YxOy-(1)-350 and AlxOy-350 reveal a uniform, smooth and crack-free film formation, while polycrystalline YxOy-(2)-350 samples exhibit a relatively rough surface. The roughness (RRMS) of the surface for the samples YxOy-(1)-350, YxOy-(2)-350 and AlxOy-350 is 0.31, 6.82, and 0.19 nm, respectively (Fig. S17a–c ESI†). We attribute the unexpected surface roughness of YxOy-(2)-350 to local hot spots which are generated during the combustion synthesis of this precursor. Besides, a high degree of polycrystallinity of the sample may play a role. Indeed, comparable rough surfaces for yttrium oxide thin films have also been reported, exhibiting (RRMS) of ∼6.0 (ref. 14) and 17.40 nm (ref. 4) respectively.
XPS surface chemical analysis
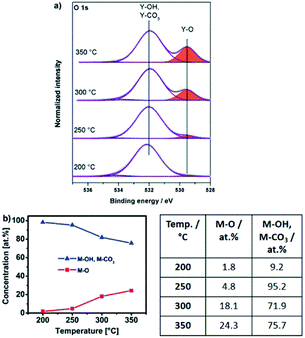
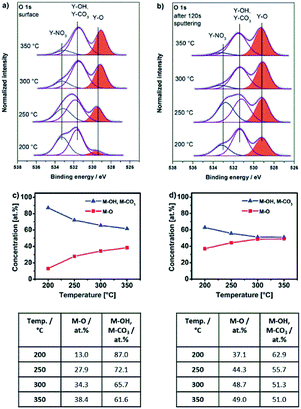
Thin films obtained by thermal transformation of 1, 2 and 3 into the respective oxides YxOy and AlxOy at temperatures of 200, 250, 300 and 350 °C were studied using X-ray photoelectron spectroscopy (XPS, Fig. 8a, 9a and 10a).The O 1s core spectra of 1 (Fig. 8a) can be deconvoluted in three peaks with binding energies at 529.5, 532.0 and 534.3 eV. The peak at 529.5 eV corresponds to surface O2− species coordinated to Y3+.43–46 Due to the fact that hydroxyl and carbonate species appear in the same range of binding energies47 the peak at 532.0 eV can be attributed to both, OH− (ref. 44, 45) as well as CO32− species. The presence of such CO32− species coordinated to Y3+ is further supported by a characteristic peak at a binding energy of 290.3 eV in the C 1s core spectra45 (Fig. S14a, ESI†). The very weak and only minor signal at 534.3 eV can be attributed to chemisorbed OH groups.48
Interestingly, for lower annealing temperatures of 200 and 250 °C minor amounts of NO3− species are also detectable and indicated by a peak at 407.4 eV in the N 1s core spectra49,50 (Fig. S14b, ESI†). The presence of such NO3− species at these low annealing temperatures is in accord with a beginning thermal transformation process of precursor bis(diethyl-2-nitromalonato)nitrato yttrium(III) Y-DEM-NO21 into YxOy. At an annealing temperature of 200 °C, O2− coordinated metal-oxygen species are detected. However hydroxyl and carbonate species present the main species at that low temperature. Significant conversion into the final oxide starts in the temperature range between 250 and 300 °C. Consequently, the intensity of the Y–OH and Y–CO3 fragments observed at 532.0 eV becomes smaller with increasing annealing temperature. In contrast, the peak associated with the Y–O species at 529.5 eV subsequently increases with increasing temperature (Fig. 8a), indicating a progressing transformation of the precursor molecule 1 and its conversion into the yttrium oxide framework. This finding corresponds nicely with the observation from the thermogravimetric analysis, whereby a significant mass loss occurs in the first decomposition step of precursor 1, ending at a temperature between 250 and 300 °C when the transformation to the oxide has already progressed significantly (Fig. 3a).
For the molecular yttrium oxide precursor Y-UN 2, the O 1s core spectra (Fig. 9a) as well as the spectra after 120 s of surface sputtering (Fig. 9b) have been recorded. In both cases, the O 1s core spectra were fitted according to three individual signals at binding energies of 529.0, 531.2 and 532.9 eV. The peak at 529.0 eV is in accord with O2− species and the peak at 532.0 eV can be attributed to OH− as well to CO32− species both not discernable individually due to the narrow energy overlap of the two signals.47 Furthermore, it becomes evident that the Y–O/(Y–OH, Y–CO3) ratio is higher within the bulk of the material compared to its topmost surface composition (Fig. 9c–d). The peak at a binding energy of 532.9 eV can be attributed to NO3− species,50 originating from the remaining precursor. The presence of such NO3− species on the surface as well as in the bulk material is further supported by an additional peak at a binding energy of 407.3 eV in the N 1s core spectra,49 which is observed for all annealing temperatures studied (200–350 °C) (Fig. S16a and b, ESI†). The concentration of the NO3− species is higher on the surface than within the bulk material. Furthermore, the amount of NO3− species, evidenced in N 1s as well as in O 1s, is decreasing for both contributions, surface and subsurface when the annealing temperature increases which is in accord with the progressing conversion from 2 into the yttrium oxide framework.
At low annealing temperatures of 200 and 250 °C, when the decomposition is still incomplete, significant concentrations of up to 7.0 at% of NO3− species are detectable. Furthermore, the respective YxOy-(2)-200 sample exhibits NH stretching modes in the range of 3100–3500 cm−1 (Fig. 7b), originating from the still present residual amine groups of the urea ligands. This corroborates with the presence of a peak at 399.2 eV characteristic of nitrogen in amine groups (Fig. S16a and b, ESI†). This fact also supports a still incomplete transformation process of the ionic precursor 2 at that low annealing temperature. Such ionic residues in the developing oxide film can act as preferential parasitic pathways for the electrical current in an oxide dielectric. As a result, capacitor devices processed from materials derived from precursor 2 at such significant low temperatures of 200 and 250 °C exhibit electrical short-circuiting under voltage impact. At temperatures above 250 °C exothermic signals in the DSC analysis of 2, however prove the further ongoing extrusion of such ligand species during ongoing film formation in the thermal processing (Fig. 3c). At annealing temperatures of 300 and 350 °C, the nitrate concentration within the material is thus consequently reduced to 2.4 and 1.5 at%, respectively. This already results in a polycrystalline yttrium oxide based capacitor device which start to perform under these conditions (see upcoming section). Besides, it is remarkable that the generation of even thicker polycrystalline yttrium oxide dielectric films generated from precursor 2 at temperatures of 300 °C or above can further reduce the electrical short-circuiting in such metal oxide capacitor devices. This can be explained by a smaller statistical probability in generating parasitic electrical pathways from one electrode to the other, mediated by still remaining ionic ligand species in the film.
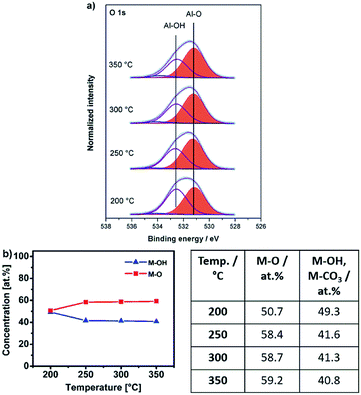
For the aluminium oxide precursor, Al-UN 3 the O 1s core spectra contain three peaks, at binding energies of 531.2 eV (M–O),51,52 532.6 eV (M–OH)53 and 534.1 eV for all annealing temperatures studied (Fig. 10a). The broad and again weak minor signal at 534.1 eV can be attributed to chemisorbed OH groups.48,54 The peak associated to the M–O functionality again subsequently increases and the peak associated to M–OH correspondingly decreases with increasing annealing temperature (Fig. 10b) similar as it is observed for the yttrium oxide precursors 1 and 2. At an annealing temperature of 200 °C small amounts of NO3− species are present, indicated by a peak at a binding energy of 407.4 eV in the N 1s core spectra. Besides, the IR spectrum of AlxOy-200 exhibits NH stretching modes in the range of 3100–3500 cm−1 (Fig. 7c), originating from the amine groups of the urea ligands, and in accord with the behaviour of the nitrate-containing yttrium compound 2. Additionally, these findings are in agreement with a DSC measurement of 3 displaying a sharp exothermic peak at 225 °C (Fig. 3d) as well as the thermogravimetric analysis of 3, exhibiting a most prominent and significant mass loss at about 225 °C. As a consequence, capacitor devices processed at 200 °C are still exhibiting electrical short-circuiting throughout, indicating a significant presence of parasitic electrical pathways, while processing temperatures of 250–350 °C already lead to amorphous aluminium oxide, based capacitor devices with good dielectric properties.
Dielectric properties of solution derived yttrium oxide YxOy and aluminium oxide AlxOy
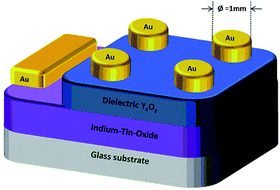
The dielectric properties of the solution-processed metal oxide thin films processed at various temperatures were measured using a metal–insulator–metal (MIM) structure (Fig. 11).ITO-coated glass was used for the fabrication of the capacitor devices, serving as a substrate as well as a gate electrode. Precursor solutions of 1, 2 and 3 were spin-coated on the ITO coated glass and annealed at various temperatures (200–350 °C), leading to the formation of YxOy and AlxOy thin films, respectively. As top electrode, gold (50 nm) was sputtered on the YxOy films. In case of the AlxOy films a combination of 50 nm gold as well as a 10 nm interlayer of titanium was used as the top electrode.
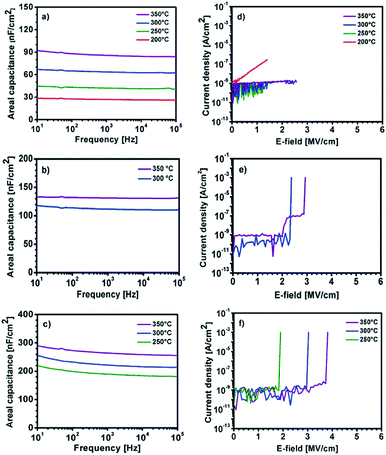
The capacitance vs. frequency curves in the range of 10 Hz to 100 kHz are displayed in Fig. 12a–c. The use of precursor 1 thermally processed at 200–350 °C leads to YxOy based capacitors, exhibiting areal capacities of 26, 41, 63 and 84 nF cm−2 at 10 kHz for YxOy-(1)-200, YxOy-(1)-250, YxOy-(1)-300 and YxOy-(1)-350, respectively. The use of precursor 2, at an annealing temperature of 300 and 350 °C, results in a capacitance of 111 and 131 nF cm−2 at 10 kHz, respectively. Furthermore, it is noteworthy that the use of the yttrium precursors Y-DEM-NO21 and Y-UN 2 lead to capacitors with almost no frequency dispersion.
Finally, the AlxOy dielectric, obtained by thermal processing from precursor 3, exhibit remarkable high capacities of 184, 216 and 259 nF cm−2 at 10 kHz for AlxOy-250, AlxOy-300 and AlxOy-350 respectively. The observed high capacities C can be attributed to a progressing conversion of 3 into the respective oxidic films of ∼ 60 nm thickness (Fig. 10) based on the relationship C = (kE0A)/D. Additionally, breakdown measurements have been carried out for all three dielectric layers (Fig. 12d–f). It is evident that higher annealing temperatures correspond to higher breakdown voltages as well as less current leakage. The samples YxOy-(1)-250, YxOy-(1)-300 and YxOy-(1)-350, generated from 1 show no electrical breakdown throughout the whole measurement range of 40 V. Interestingly, the YxOy-200 sample exhibit no clear cut electrical breakdown, but a drastic increasing leakage current with increasing voltage. This might be attributed to the fact that almost no yttrium oxide has formed at 200 °C, as shown in the XPS measurement (Fig. 8a). The leakage current at 1 MV cm−1, using precursor 1 amounts to 5.5 × 10⁻⁸, 6.9 × 10⁻¹⁰, 2.1 × 10⁻¹⁰ and 3.8 × 10⁻¹⁰ A cm−2 for samples YxOy-(1)-200, YxOy-(1)-250, YxOy-(1)-300 and YxOy-(1)-350, annealed at these different temperatures, respectively. YxOy-(2)-300 and YxOy-(2)-350 generated from precursor 2 possess an electrical breakdown of 2.4 and 2.9 MV cm−1 and a very low leakage current of 9.2 × 10⁻¹⁰ and 8.5 × 10⁻¹⁰ A cm−2 at 1 MV cm−1. The electrical breakdown of the AlxOy dielectrics occur at 1.9, 3.0 and 3.8 MV cm−1 for AlxOy-250, AlxOy-300 and AlxOy-350, respectively. The current leakage at 1 MV cm−1 amounts 9.1 × 10⁻¹⁰, 6.2 × 10⁻¹⁰ and 5.0 × 10⁻¹⁰ for AlxOy-250, AlxOy-300 and AlxOy-350, respectively. It is remarkable that besides YxOy-(1)-200, all fabricated capacitors fulfil the criteria of Wager et al. for an ideal dielectric, exhibiting low leakage current of J < 1 × 10⁻⁸ at 1 MV cm−1.55
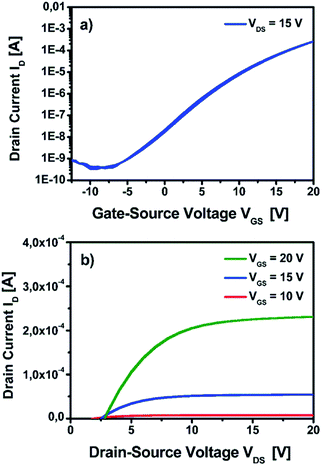
The control of the atmospheric conditions under which the studies have been performed is crucial for the interpretation of the obtained dielectric properties. In ambient atmosphere, adsorbed water molecules reside on the thin film surface, contributing to the parasitic resistance and thus resulting in a drastically increased capacitance. At low annealing temperatures there are more detrimental hydroxide groups residing on the surface of the thin films, which enhance the adsorption of additional water molecules. Consequently, this effect becomes even higher; the lower the chosen annealing temperature under ambient conditions is. As a result, extraordinarily high capacities even for very low annealing temperatures are a clear indicator that such studies have been performed under ambient, atmospheric conditions. Therefore, a direct comparison of studies performed under non-inert and inert atmosphere seems unrealistic. The situation can be even more complicated if conditions of measurement are not explicitly comparable in this regard. An overview of the current state of the art studies is given in Table 1. It is evident that the yttrium oxide YxOy dielectric derived from the molecular precursors 1 and 2 show very good electrical performances compared to other yttrium oxide-based dielectrics. Only work by Adamopolous et al. reports higher capacities (133 nF cm−2) comparable values to those of YxOy generated from precursor 2 (131 nF cm−2), though using even a slightly higher annealing temperature of 400 °C. Concerning the current leakage at 1 MV cm−1 the reported reference works display values which are up to three magnitudes higher compared to the current leakage generated from the herein reported yttrium oxide obtained from our precursor approach using molecules 1 and 2. Indeed, the new capacitors reported herein are to the best of our knowledge currently the only ones fulfilling the criterion of Wager et al. (J < 1 × 10⁻⁸ A cm−2 at 1 MV cm−1) for minimum current leakage of technologically relevant dielectrics. Lastly, in order to evaluate the dielectric in an TFT geometry YxOy derived from precursor compound 1 was succesfully employed as a functional dielectric layer in a field effect transistor using solution-processed indium zinc oxide (IZO) as semiconducting layer. Within the device architecture, solution deposited amorphous indium zinc oxide (IZO) precursor was spin-coated and subsequently processed at 350 °C for complete formation of a IZO semiconductor. The IZO precursor solution was generated by using single source zinc and indium precursors as described by us.22,34–36 A schematic representation of the TFT architecture is shown in Fig. S18 ESI.† The electrical measurements are characterized by plotting the transfer and output characteristics of the measured TFT device and is displayed in Fig. 13. The crucial performance metrics including the charge-carrier mobility (μsat) in the saturation regime, the threshold voltage (Vth) and the ratio of the current measured in the on-state and the off-state (Ion/off) of the final device were extracted from the data obtained from the transfer and output characteristics. The measured TFT displays a good device performance with a μsat of 2.1 cm2 V−1 s−1, a Vth of 6.9 V and an Ion/off of 7.6 × 10⁵, with no significant hysteresis in the measured transfer characteristics. The device performance demonstrates the successful implementation of the fabricated YxOy dielectric when combined with an amorphous IZO semiconductor in a TFT device architecture thus serving as a proof of principle study.
| Ref. | Temp. (°C) | d (nm) | k | Areal cap. (nF cm−2) (f) | Leakage (A cm−2) | E B (MV cm−1) |
|---|---|---|---|---|---|---|
| a Our solution processed AlxOy dielectric is given for comparison. | ||||||
| This work 1 | 350 | 156 | 14.9 | 84 (10 kHz) | 3.8 × 10⁻¹⁰ (1 MV cm−1) | >2 |
| This work 1 | 300 | 163 | 11.5 | 63 (10 kHz) | 2.1 × 10⁻¹⁰ (1 MV cm−1) | >2 |
| This work 1 | 250 | 248 | 11.5 | 46 (10 kHz) | 6.9 × 10⁻¹⁰ (1 MV cm−1) | >2 |
| This work 1 | 200 | 286 | 8.5 | 21 (10 kHz) | 5.5 × 10⁻⁸ (1 MV cm−1) | — |
| This work 2 | 350 | 82 | 12.1 | 131 (10 kHz) | 8.5 × 10⁻¹⁰ (1 MV cm−1) | 2.9 |
| This work 2 | 300 | 87 | 10.9 | 111 (10 kHz) | 9.2 × 10⁻¹⁰ (1 MV cm−1) | 2.4 |
| Song | 500 | 188 | 15.9 | 74.7 (1 MHz) | 8.63 × 10⁻⁷ (2 MV cm−1) | — |
| Song | 400 | 188 | 15.6 | 73.4 (1 MHz) | 7.21 × 10⁻⁸ (2 MV cm−1) | — |
| Song | 300 | 188 | 15.2 | 71.7 (1 MHz) | 5.24 × 10⁻⁸ (2 MV cm−1) | — |
| Tsay | 550 | 220 | 10.5 | 42.2 (100 kHz) | 1.7 × 10⁻⁶ (5 V) | — |
| Tsay | 500 | 220 | 10.0 | ≈40 (100 kHz) | 1.8 × 10⁻⁷ (5 V) | — |
| Tsay | 450 | 225 | 9.5 | 37.4 (100 kHz) | <1.0 × 10⁻⁶ (5 V) | — |
| Adamopolous | 400 | — | ≈16.2 | ≈133 (120 Hz) | — | — |
| aThis work 3 | 350 | 59 | 17.2 | 259 (10 kHz) | 5.0 × 10⁻¹⁰ (1 MV cm−1) | 3.8 |
| aThis work 3 | 300 | 61 | 14.9 | 216 (10 kHz) | 6.2 × 10⁻¹⁰ (1 MV cm−1) | 3.0 |
| aThis work 3 | 250 | 74 | 15.4 | 184 (10 kHz) | 9.1 × 10⁻¹⁰ (1 MV cm−1) | 1.9 |
Conclusions
In conclusion, we have demonstrated the synthesis and full structural characterization of the single-source molecular precursors bis(diethyl-2-nitromalonato) nitrato yttrium(III) 1, dinitrato tetra(urea) yttrium(III)-nitrate 2 and hexakis(urea) aluminium(III)-nitrate 3. The thermal decomposition of these precursors has been investigated in depth revealing formation of volatile by-products in the course of the thermal conversion with no significant formation of stable intermediate decomposition products. Additionally, in all cases the conversion into the respective metal oxide occurs at relatively low decomposition temperatures which exemplifies the versatility of the combustion route using high energy precursors. While precursor 1 is soluble in methoxyethanol, precursor 2 and 3 have good solubility in water (>20%), which provides an eco-friendly approach to the synthesis of the high-k YxOy and AlxOy dielectric materials. AlxOy thin films are amorphous for all annealing temperatures studied (200–350 °C), whereby YxOy samples show crystallinity starting from 350 °C for 1 and 250 °C for 2, respectively. The AlxOy based capacitors fabricated exhibit very high areal capacities even at a moderate annealing temperature of 250 °C (184 nF cm−2 at 10 kHz). Furthermore, all AlxOy based capacitors, annealed in the temperature range 250–350 °C, exhibit very low current leakage of J < 10−9 A cm−2 at 1 MV cm−1. Additionally, the breakdown voltage was determined to be 1.9, 3.0 and 3.8 MV cm−1 for AlxOy-250, AlxOy-300 and AlxOy-350, respectively.The YxOy based capacitors, generated from precursor 2 and annealed at 300 and 350 °C exhibit a high capacitance of 111 and 131 nF cm−2 at 10 kHz. The current leakage at 1 MV cm−1 amounts less than 10–9 A cm−2 at 1 MV cm−1 for both samples and the electrical breakdown occurs at 2.4 and 2.9 MV cm−1, respectively. The YxOy based capacitors, generated from precursor 1, exhibit satisfactory areal capacities even at moderate temperatures (84 nF cm−2 at 350 °C). Furthermore, the YxOy based capacitors exhibit almost no frequency dispersion over the whole range (10 Hz–100 kHz). Except for a calcination temperature of 200 °C, all capacitors exhibit very low current leakage of J < 10−9 A cm−2 at 1 MV cm−1 and show no electrical breakdown up to 40 V.
Additionally, the implementation of the fabricated yttrium oxide dielectric with an IZO semiconductor processed at 350 °C demonstrates an effective TFT performance characteristics, exhibiting a μsat of 2.1 cm2 V−1 s−1, a Vth of 6.9 V and Ion/off of 7.6 × 10⁵.
The ability of such a unique class of high combustible precursor molecules based on the urea/nitrate ligand environment presents itself as a potential alternative in the low-temperature fabrication of high-k dielectric materials. It remains interesting to see if this strategy can be extended towards formation of other metal oxides from a similar solution process. This could warrant interesting functional properties towards novel device fabrication in the future.
Conflicts of interest
The authors declare no conflict of interests.Acknowledgements
TEM investigations were performed at ERC Jülich under contract with ERC-TUD1. We acknowledge Dr J. Engstler and S. Heinschke for performing TEM, XRD and ellipsometric studies. The acquisition of the K-Alpha(+) instrument at KIT was supported by the German Federal Ministry of Economics and Technology.Notes and references
- A. Facchetti and T. J. Marks, Transparent Electronics: From Synthesis to Applications, 2010 Search PubMed.
- S. Park, C.-H. Kim, W.-J. Lee, S. Sung and M.-H. Yoon, Mater. Sci. Eng., R, 2017, 114, 1–22 CrossRef.
- J. Robertson and R. M. Wallace, Mater. Sci. Eng., R, 2015, 88, 1–41 CrossRef.
- W. Xu, H. Wang, L. Ye and J. Xu, J. Mater. Chem. C, 2014, 2, 5389–5396 RSC.
- R. C. Frunză, B. Kmet, M. Jankovec, M. Topič and B. Malič, Mater. Res. Bull., 2014, 50, 323–328 CrossRef.
- Y. B. Yoo, J. H. Park, K. H. Lee, H. W. Lee, K. M. Song, S. J. Lee and H. K. Baik, J. Mater. Chem. C, 2013, 1, 1651–1658 RSC.
- C.-G. Lee and A. Dodabalapur, J. Electron. Mater., 2012, 41, 895–898 CrossRef CAS.
- A. Liu, G. X. Liu, H. H. Zhu, F. Xu, E. Fortunato, R. Martins and F. K. Shan, ACS Appl. Mater. Interfaces, 2014, 6, 17364–17369 CrossRef CAS.
- L. Zhu, G. He, J. Lv, E. Fortunato and R. Martins, RSC Adv., 2018, 8, 16788–16799 RSC.
- C. Avis and J. Jang, J. Mater. Chem., 2011, 21, 10649–10652 RSC.
- Y. Xu, X. Li, L. Zhu and J. Zhang, Mater. Sci. Semicond. Process., 2016, 46, 23–28 CrossRef CAS.
- W. Yang, K. Song, Y. Jung, S. Jeong and J. Moon, J. Mater. Chem. C, 2013, 1, 4275–4282 RSC.
- P. K. Nayak, M. N. Hedhili, D. Cha and H. N. Alshareef, Appl. Phys. Lett., 2013, 103, 033518 CrossRef.
- K. Song, W. Yang, Y. Jung, S. Jeong and J. Moon, J. Mater. Chem., 2012, 22, 21265–21271 RSC.
- A. Liu, G. Liu, H. Zhu, Y. Meng, H. Song, B. Shin, E. Fortunato, R. Martins and F. Shan, Curr. Appl. Phys., 2015, 15, S75–S81 CrossRef.
- C.-Y. Tsay, C.-H. Cheng and Y.-W. Wang, Ceram. Int., 2012, 38, 1677–1682 CrossRef CAS.
- F. Xu, A. Liu, G. Liu, B. Shin and F. Shan, Ceram. Int., 2015, 41, S337–S343 CrossRef CAS.
- G. Adamopoulos, S. Thomas, D. D. C. Bradley, M. A. McLachlan and T. D. Anthopoulos, Appl. Phys. Lett., 2011, 98, 123503 CrossRef.
- W. Xu, H. Li, J.-B. Xu and L. Wang, ACS Appl. Mater. Interfaces, 2018, 10, 25878–25901 CrossRef CAS.
- A. Liu, H. Zhu, H. Sun, Y. Xu and Y.-Y. Noh, Adv. Mater., 2018, 30, 1706364 CrossRef.
- S. W. Smith, W. Wang, D. A. Keszler and J. F. Conley Jr, J. Vac. Sci. Technol., A, 2014, 32, 041501 CrossRef.
- N. Koslowski, S. Sanctis, R. C. Hoffmann, M. Bruns and J. J. Schneider, J. Mater. Chem. C, 2019, 7, 1048–1056 RSC.
- G. Teowee, K. C. McCarthy, F. S. McCarthy, T. J. Bukowski, D. G. Davis and D. R. Uhlmann, J. Sol-Gel Sci. Technol., 1998, 13, 895–898 CrossRef CAS.
- H. Z. Zhang, L. Y. Liang, A. H. Chen, Z. M. Liu, Z. Yu, H. T. Cao and Q. Wan, Appl. Phys. Lett., 2010, 97, 122108 CrossRef.
- W. Xu, M. Long, T. Zhang, L. Liang, H. Cao, D. Zhu and J.-B. Xu, Ceram. Int., 2017, 43, 6130–6137 CrossRef CAS.
- A. Liu, G. Liu, H. Zhu, B. Shin, E. Fortunato, R. Martins and F. Shan, RSC Adv., 2015, 5, 86606–86613 RSC.
- W. Xu, H. Wang, F. Xie, J. Chen, H. Cao and J.-B. Xu, ACS Appl. Mater. Interfaces, 2015, 7, 5803–5810 CrossRef CAS.
- H. Tan, G. Liu, A. Liu, B. Shin and F. Shan, Ceram. Int., 2015, 41, S349–S355 CrossRef CAS.
- D.-H. Lee, Y.-J. Chang, W. Stickle and C.-H. Chang, Solid-State Lett., 2007, 10, K51–K54 CrossRef CAS.
- Y. Zhao, G. Dong, L. Duan, J. Qiao, D. Zhang, L. Wang and Y. Qiu, RSC Adv., 2012, 2, 5307–5313 RSC.
- B. Sykora, D. Wang and H. v. Seggern, Appl. Phys. Lett., 2016, 109, 033501 CrossRef.
- R. C. Hoffmann and J. J. Schneider, Eur. J. Inorg. Chem., 2014, 2014, 2241–2247 CrossRef CAS.
- Y. Chen, B. Wang, W. Huang, X. Zhang, G. Wang, M. J. Leonardi, Y. Huang, Z. Lu, T. J. Marks and A. Facchetti, Chem. Mater., 2018, 30, 3323–3329 CrossRef CAS.
- S. Sanctis, R. C. Hoffmann, M. Bruns and J. J. Schneider, Adv. Mater. Interfaces, 2018, 5, 1800324 CrossRef.
- R. C. Hoffmann, M. Kaloumenos, S. Heinschke, E. Erdem, P. Jakes, R.-A. Eichel and J. J. Schneider, J. Mater. Chem. C, 2013, 1, 2577–2584 RSC.
- S. Sanctis, N. Koslowski, R. Hoffmann, C. Guhl, E. Erdem, S. Weber and J. J. Schneider, ACS Appl. Mater. Interfaces, 2017, 9, 21328–21337 CrossRef CAS PubMed.
- Y. Qiu and L. Gao, J. Am. Ceram. Soc., 2004, 87, 352–357 CrossRef CAS.
- M. S. Lupin and G. E. Peters, Thermochim. Acta, 1984, 73, 79–87 CrossRef CAS.
- S. Sanctis, R. C. Hoffmann, N. Koslowski, S. Foro, M. Bruns and J. J. Schneider, Chem. - Asian J., 2018, 13, 3912–3919 CrossRef CAS.
- A. S. Antsyshkina, G. G. Sadikov, M. N. Rodnikova and S. E. Tikhonov, Crystallogr. Rep., 2003, 48, 610–612 CrossRef CAS.
- H. A. Al-Abadleh and V. H. Grassian, Langmuir, 2003, 19, 341–347 CrossRef CAS.
- J. Gangwar, B. K. Gupta, P. Kumar, S. K. Tripathi and A. K. Srivastava, Dalton Trans., 2014, 43, 17034–17043 RSC.
- D. Barreca, G. A. Battiston, D. Berto, R. Gerbasi and E. Tondello, Surf. Sci. Spectra, 2001, 8, 234–239 CrossRef CAS.
- C. Durand, C. Dubourdieu, C. Vallée, V. Loup, M. Bonvalot, O. Joubert, H. Roussel and O. Renault, J. Appl. Phys., 2004, 96, 1719–1729 CrossRef CAS.
- T. Gougousi and Z. Chen, Thin Solid Films, 2008, 516, 6197–6204 CrossRef CAS.
- E. J. Rubio, V. V. Atuchin, V. N. Kruchinin, L. D. Pokrovsky, I. P. Prosvirin and C. V. Ramana, J. Phys. Chem. C, 2014, 118, 13644–13651 CrossRef CAS.
- J. Stoch and J. Gablankowska-Kukucz, Surf. Interface Anal., 1991, 17, 165–167 CrossRef CAS.
- P. Post, L. Wurlitzer, W. Maus-Friedrichs and A. P. Weber, Nanomaterials, 2018, 8, 530 CrossRef.
- M. Y. Smirnov, A. V. Kalinkin and V. I. Bukhtiyarov, J. Struct. Chem., 2007, 48, 1053–1060 CrossRef CAS.
- B. C. Beard, Appl. Surf. Sci., 1990, 45, 221–227 CrossRef CAS.
- V. Trouillet, H. Tröβe, M. Bruns, E. Nold and R. White, J. Vac. Sci. Technol. A, 2007, 25, 927–931 CrossRef CAS.
- B. R. Strohmeier, Surf. Sci. Spectra, 1994, 3, 135–140 CrossRef CAS.
- C. Gao, X.-Y. Yu, R.-X. Xu, J.-H. Liu and X.-J. Huang, ACS Appl. Mater. Interfaces, 2012, 4, 4672–4682 CrossRef CAS PubMed.
- M. R. Alexander, G. E. Thompson, X. Zhou, G. Beamson and N. Fairley, Surf. Interface Anal., 2002, 34, 485–489 CrossRef CAS.
- J. F. Wager, D. A. Keszler and R. E. Presley, Transparent Electronics, Springer, New York, 2008 Search PubMed.
Footnote |
| † Electronic supplementary information (ESI) available. CCDC 1937519 for precursor 2. For ESI and crystallographic data in CIF or other electronic format see DOI: 10.1039/c9ra05348d |
| This journal is © The Royal Society of Chemistry 2019 |

