 Open Access Article
A room temperature operated ammonia gas sensor based on Ag-decorated TiO2 quantum dot clusters
Haixin Liu,
Wenhao Shen* and
Xiaoquan Chen
State Key Laboratory of Pulp and Paper Engineering, South China University of Technology, Guangzhou, 510640, P. R. China. E-mail: ppwhshen@scut.edu.cn
First published on 7th August 2019
Abstract
In this research, nanometer size aggregates (clusters) of titanium dioxide (TiO2) quantum dot clusters (QDs) have been successfully prepared via a convenient hydrolysis method at a low temperature (80 °C). Then different amounts (0–5%) of Ag were further decorated on the TiO2 QDs via dipping and annealing under a nitrogen atmosphere. After Ag decoration, the TiO2 QD sensing materials were synthesized, and characterization and NH3 gas sensing performance studies were carried out. Analysis via XRD and EDS was conducted, and the results showed that Ag+ ions were successfully reduced to Ag and decorated on the surface of the anatase TiO2 QDs. Noble metal Ag acted as the sites for adsorbates, catalysts, or promoters during the surface reactions, and as the element improving the thermal stability of the nanostructure. Therefore, the Ag-decorated gas sensor possessed better gas sensing performance than an undecorated gas sensor, and 3% Ag dopant proved to be the optimal amount of addition. The fabricated 3% Ag-decorated TiO2 QDs gas sensor, compared with the undecorated TiO2 QDs sensor, displayed a 6-times-higher sensing response at room temperature and demonstrated excellent gas sensing properties toward 10–100 ppm NH3 gas, good selectivity, gas sensitivity and stability, rapid response/recovery time, and a linear relationship between the response and the target gas concentration. In particular, the excellent performance of the Ag decorated-TiO2 QDs gas sensor was achieved at room temperature, which suggests the great possibility of a prompt gas sensing response, with the use of paper as a substrate, that requires a low operation temperature.
Introduction
Recently there has been huge demand for monitoring and controlling air pollutants, of which ammonia (NH3) is one of the most common examples that causes severe environmental problems. When ammonia is present in ecosystems in excess, it can cause nutrient imbalances and eutrophication. In terrestrial ecosystems this leads to a loss of plant species and habitat diversity, and in aquatic ecosystems this causes algal blooms and hypoxia.1 In recent years, research into new and more effective NH3 gas sensors using nanostructured materials has gained plenty of attention, due to the various applications, including in environmental monitoring,2 industrial process monitoring,3 automotive exhaust detection,4,5 and medical diagnostics.6,7One of the most commonly applied gas sensing mechanisms for NH3 is based on resistive sensors with various metal oxide semiconductors,2,3 such as TiO2, ZnO,8,9 WO3,10 In2O3,11,12 ZrO2,13 V2O5,14 carbon nanotubes,15,16 Fe2O3 (ref. 17) and Co3O4.18 In our previous work, TiO2 QDs were successfully synthesized at a low temperature (80 °C), and their application in NH3 gas sensors was studied. The fabricated TiO2 QDs showed a highly porous structure and a large specific surface area, which enhanced their gas sensing performance toward NH3 at room temperature. A comparison with other reported NH3 gas sensors is shown in Table 1. These previous reports imply that NH3 gas sensors prepared using nanomaterials have the disadvantages of requiring high temperatures, demonstrating low sensitivity and involving complex synthesis processes. In order to solve these problems, much effort has been devoted to this area with attempts to control the particle size and morphology,19 maximize the exposure of active crystal facets,20,21 introduce transition metal dopants,22,23 metal oxide additives24 or noble metal sensitizers,19,24,25 and make composites with conducting polymers. It has been proven that nanoparticles of noble metals (Pd, Rh, Pt, Au, Ag) on the surface of metal oxides can act as the sites for adsorbates, catalysts, or promoters during surface reactions and as the element that improves the thermal stability of the film nanostructure.23,26,27 Of these, the low price of Ag dopants compared to other noble metals is beneficial for their practical application; moreover, as reported, the gas sensing properties of various kinds of semiconductors are promoted markedly by Ag dopants.28 Furthermore, with the aim of printing sensing materials on paper substrates to fabricate wearable and flexible gas sensors, to further enhance the gas sensing performance at room temperature, the testing of curved substrates is needed. Therefore, Ag-decorated TiO2 QD sensing materials were prepared, and their gas sensing performance was promoted with an alumina tube as the substrate. With different thicknesses and sizes of the prepared sensor, the resistance was different, so the baseline was different to our previous work; but compared with TiO2 QDs sensors on an alumina tube, the Ag–TiO2 QDs gas sensor still showed better performance.
| No. | Material | Concentration (ppm) | Response (R = Ra/Rg) | Temperature (°C) | Ref. |
|---|---|---|---|---|---|
| 1 | WO3 | 300 | 2.39 | 250 | 29 |
| 2 | V2O5 | 1 | 11.3 | 200 | 14 |
| 3 | Pd–ZnO | 5 | 7.1 | 210 | 30 |
| 4 | TiO2 QDs | 10 | 7.8 | RT | Our previous work31 |
| 5 | SnO2/MWCNTs | 100 | 12.5 | RT | 26 |
| 6 | PANI/TiO2 | 23 | 1.7 | RT | 32 |
| 7 | TiO2/PPy | 30 | 3.52 | RT | 33 |
| 8 | PANI–TiO2 | 20 | 12.5 | RT | 34 |
| 9 | Ag–TiO2 QDs | 20 | 25.1 | RT | Present work |
In this context, this paper is focused on the fabrication of a NH3 sensor based on Ag-decorated TiO2 QDs via a facile annealing route to enhance the NH3 sensing performance at room temperature. To the best of our knowledge, an Ag-decorated TiO2 QDs NH3 gas sensor has not yet been reported in the literature. The fabricated sensors were evaluated systematically in terms of their response, response/recovery times and selectivity toward NH3. The main target of this work is to promote the gas sensing performance toward NH3 at room temperature on a curved substrate (alumina tube). The fabricated Ag-decorated TiO2 QDs gas sensor successfully showed a response several times higher than that of an undecorated gas sensor.
Experimental
Synthesis of anatase TiO2 QDs
The TiO2 QDs were prepared according to a previous work,31 and the detailed synthesis process is as follows. (1) Tetrabutyl titanate (Ti(OC4H9)4, 10 mL) and acetic anhydride ((CH3CO)2O, 20 mL) were mixed with cyclohexane (50 mL) in a glass vessel with a screw-on cap. The mixture was then heated to 80 °C until it appeared turbid. After maintaining the reaction for 30 min, the solid product was centrifuged from the reaction mixture, washed several times with acetone and distilled water, and dried to provide the titanyl organic compound. (2) The titanyl organic compound was mixed with water (H2O![[thin space (1/6-em)]](https://www.rsc.org/images/entities/char_2009.gif) :
:![[thin space (1/6-em)]](https://www.rsc.org/images/entities/char_2009.gif) TiO2 = 50
TiO2 = 50![[thin space (1/6-em)]](https://www.rsc.org/images/entities/char_2009.gif) :
:![[thin space (1/6-em)]](https://www.rsc.org/images/entities/char_2009.gif) 1 mol mol−1), and then nitric acid (HNO3) solution was added at a concentration of 1 mol L−1. The mixture was then heated and continuously stirred at 60 °C for 3 h to obtain the TiO2 QDs. The prepared TiO2 QDs were settled through controlling the pH and collected via centrifugation. After washing with ethanol and DI water several times and drying at 60 °C overnight, TiO2 QD powder was acquired.
1 mol mol−1), and then nitric acid (HNO3) solution was added at a concentration of 1 mol L−1. The mixture was then heated and continuously stirred at 60 °C for 3 h to obtain the TiO2 QDs. The prepared TiO2 QDs were settled through controlling the pH and collected via centrifugation. After washing with ethanol and DI water several times and drying at 60 °C overnight, TiO2 QD powder was acquired.
Synthesis of Ag-decorated TiO2 QDs
The obtained TiO2 QDs were then divided into five equal portions and mixed with distilled water. Different amounts of AgNO3 were added to the five mixtures, respectively. The molar ratio of Ag/Ti was set at 0%, 1%, 3% or 5%, individually. Subsequently, the mixtures were ultrasonically agitated for 15 min until they were homogeneous. Then the mixtures were annealed under a nitrogen atmosphere via two steps: step 1 was to dry the material at 80 °C for 6 h, followed by a temperature of 550 °C for 4 h (step 2) to obtain the Ag-decorated TiO2 QDs gas sensing materials.Characterization
Before the investigations into the gas sensing performance of the gas sensors, the gas sensing materials were characterized via XRD, SEM, EDS, TEM and BET analysis methods. The crystalline structure and phase composition were characterized using an X-ray diffractometer (XRD, Bruker, Germany), with Cu Kα radiation at a wavelength of 1.5406 Å, operating at 40 kV and 30 mA. The morphology was observed using a scanning electron microscope (SEM, Merlin, Germany) with an operation voltage of 5 kV. A transmission electron microscope (TEM, JEM-2200FS, Japan) was used to further characterize the crystallographic features. The gas sensing performance of the sensor was evaluated using a WS-30A gas sensor measurement system (Weishen Electronic Technology Co., Ltd, China).Gas sensor fabrication and measurements
The fabrication process of the gas sensor was as follows: (1) the as-prepared gas sensing material was mixed with absolute ethyl alcohol at a weight ratio of 4![[thin space (1/6-em)]](https://www.rsc.org/images/entities/char_2009.gif) :
:![[thin space (1/6-em)]](https://www.rsc.org/images/entities/char_2009.gif) 1 and the mixed solution was ultrasonically agitated for 15 min until a homogeneous slurry was formed; (2) the slurry was pasted onto an alumina tube that had a pair of Au electrodes and four Pt wires for resistance measurements; and (3) the alumina tube was annealed at 300 °C for 2 h to improve the stability of the sensor and remove residual organics on the surface of the sensor.
1 and the mixed solution was ultrasonically agitated for 15 min until a homogeneous slurry was formed; (2) the slurry was pasted onto an alumina tube that had a pair of Au electrodes and four Pt wires for resistance measurements; and (3) the alumina tube was annealed at 300 °C for 2 h to improve the stability of the sensor and remove residual organics on the surface of the sensor.
As shown in Fig. 1a, the structure of the gas sensor is explained as follows: a pair of gold electrodes connected to Pt wires is printed on the alumina tube, and the area between the two gold electrodes is coated with the as-prepared gas sensing material. Fig. 1b displays the circuit used to measure the gas sensor, where Rf is a load resistor connected in series with the gas sensor and RS donates the resistance of the sensor. In the testing process, an appropriate bias voltage (Vworking = 5 V) was applied. The response of the sensor was measured by monitoring the voltage (Voutput) changes of RF. The gas response (S) of the sensor is defined as S = Ra/Rg for reducing gases and S = Rg/Ra for oxidizing gases, where Rg and Ra are the resistance values of the sensor measured in the target gas and in air, respectively.
 | ||
| Fig. 1 (a) A schematic diagram of the gas sensor and (b) the electric circuit used to investigate the gas sensor. | ||
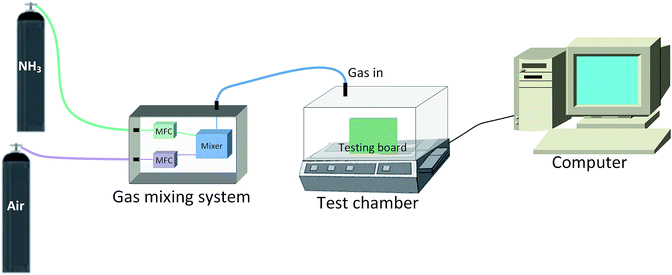
The experimental setup for the gas sensing measurement system is shown in Fig. 2. The fabricated sensor was set-up on a testing board in an 18 L testing chamber that was connected to the gas sensing measurement system. The temperature and humidity of the chamber were maintained at 25 °C and 50%, respectively. The concentrations of the testing gases (NH3, C2H5OH, CH2O, C6H6 and H2S) mixed with air were controlled via two mass flow controllers.
Results and discussion
Structural and morphological characteristics
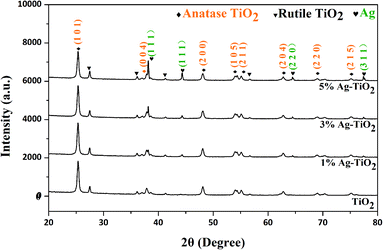
Before any investigation of the gas sensing performance, the Ag-decorated TiO2 QDs were characterized with XRD, SEM and EDS technologies. The results are addressed below.XRD was conducted to investigate the crystal structures of the as-synthesized samples. The results of measurements are shown in Fig. 3. In the case of the TiO2 QDs, the pattern was in accordance with anatase TiO2 reflections (JCPDS no. 04-0477), and all the diffraction peaks correspond well to the (101), (004), (200), (105), (211), (204), (220), and (215) peaks of anatase TiO2. Compared with the TiO2 QDs, all the patterns of the Ag-decorated TiO2 QDs sensing materials revealed the presence of the diffraction peaks of anatase TiO2 along with additional peaks at 2θ = 38.1°, 44.3°, 64.4° and 77.4°, which corresponded well with the (111), (200), (220) and (311) peaks of spinel silver (JCPDS no. 65-2871). In addition, the intensities increase when the concentration of Ag dopant is higher. Moreover, these anatase TiO2 and spinel diffraction peaks were present in all the Ag-decorated samples without any shifts, indicating that the metal dopants were merely placed on the surfaces of the crystals rather than being covalently anchored into the crystal lattices.28 Compared to our previous work, at higher annealing temperatures, the crystallinity is higher and small rutile TiO2 peaks were also observed in all the samples, where the appearance of rutile TiO2 diffraction peaks was due to phase transformation from anatase TiO2 to rutile TiO2 at high annealing temperatures (550 °C).35 In addition, from eqn (1), the calculated crystallite size of the TiO2 QDs was 66 nm, and the average crystallite sizes of the 1%, 3% and 5% Ag-decorated TiO2 QDs sensing materials were 31.2, 30.8, and 34.2 nm, respectively.
 | (1) |
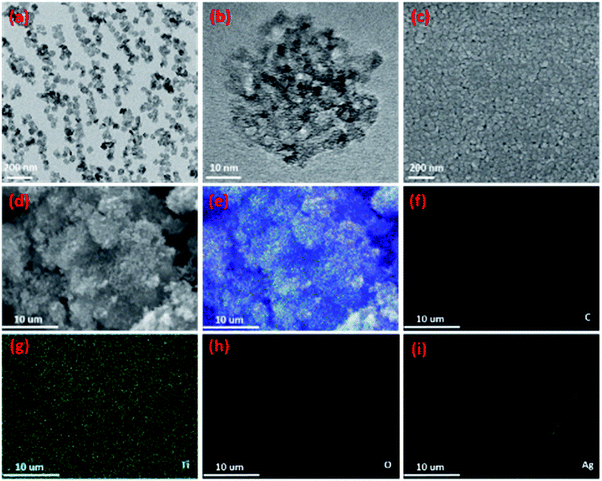
SEM, TEM and EDS technologies were utilized to characterize the TiO2 QDs and Ag-decorated sensing materials. TEM images of the TiO2 QDs are shown in Fig. 4a and b; as we can see, the synthesized stable nanometer size aggregates with good dispersibility were TiO2 quantum dot clusters with a uniform size of 66 nm, they were formed from 2–5 nm diameter anatase crystals. Similar to our reported work,31 with a unique formation method, the TiO2 QDs show a highly porous structure (Fig. 4b) with a huge specific surface area of 315.74 m2 g−1.31 In our previous work, the sensor was fabricated on a flat substrate; for further research, to achieve fabrication on a paper substrate for a flexible sensor, we need to test it on a curved substrate and then we can start optimizing the sensing material on a tubular substrate to achieve better sensing performance at room temperature. Our coming work is aimed at compositing the nanoparticles with two-dimensional GO to achieve flexible sensors on paper to simplify the fabrication process with printing technology. After considering the noble metal Ag as the catalyst, Ag-decorated TiO2 QDs were synthesized. Following coating on an alumina tube, the SEM results are displayed in Fig. 4c. The film is densified and porous between the grains of the film, which is an advantage for the diffusion of the target gas. However, the decorated Ag cannot be seen in the film, maybe due to its low concentration or small size. Then, EDS analysis was introduced; the elemental mapping images of the Ag-decorated TiO2 sensing material are displayed in Fig. 4d–i, where all scale bars are 10 μm. Fig. 4d shows an SEM image, and Fig. 4f–i clearly highlight the presence of C, Ti, O, and Ag elements. It is notable that the good dispersion of the Ag dopant is revealed in Fig. 4i; the detected C elements in Fig. 4f are attributed to the conducting resin that was applied during the preparation of the sample for SEM characterization. The XRD (Fig. 3) and EDS (Fig. 4) characterization results indicate that the Ag dopant was successfully decorated on the surface of the TiO2 sensing material.
Gas sensing properties and mechanism
To further enhance the gas sensing properties, the dopant Ag was added to form Ag-decorated QDs sensing materials, and corresponding Ag-decorated TiO2 QDs gas sensors were developed and tested.Optimal amount of Ag dopant addition
After having decorated the material with the dopant Ag at 0%, 1%, 3% and 5%, respectively, different Ag-decorated TiO2 QDs gas sensors were fabricated and exposed to 20, 40, 60, and 80 ppm NH3 gas, successively, and the gas sensing performances were measured and are given in Fig. 5. Compared with the undecorated TiO2 QDs gas sensor, all Ag-decorated TiO2 QDs gas sensors displayed higher responses (Fig. 5a) and shorter response/recovery times (Fig. 5b, c and Table 2). In the results shown in Fig. 5, the 3% Ag-decorated TiO2 QDs gas sensor possessed the best gas sensing performance; its sensing response and response/recovery time were 6 times higher and shorter, respectively, than those of the pure TiO2 QDs gas sensor, which meets our goal and will benefit our future research. Therefore, all subsequent experiments were carried out with the 3% Ag-decorated TiO2 QDs sensor.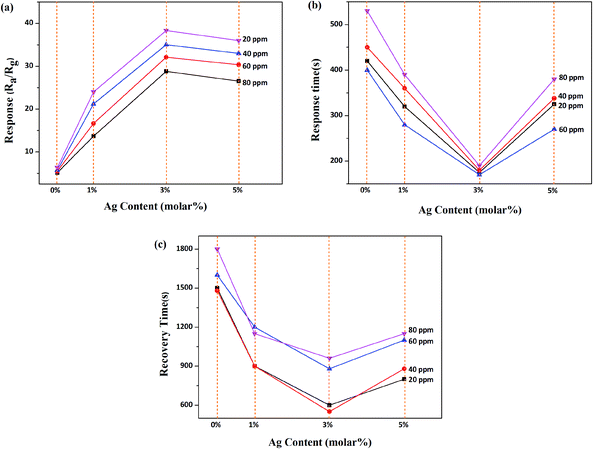 | ||
| Fig. 5 A performance comparison between Ag-decorated TiO2 QDs gas sensors with different volumes of Ag addition to NH3: (a) response; (b) response time; and (c) recovery time. | ||
| Sample | Response time (s) 20 ppm | Recovery time (s) 20 ppm | Response time (s) 40 ppm | Recovery time (s) 40 ppm | Response time (s) 60 ppm | Recovery time (s) 60 ppm | Response time (s) 80 ppm | Recovery time (s) 80 ppm |
|---|---|---|---|---|---|---|---|---|
| 0% | 420 | 1500 | 450 | 1480 | 400 | 1600 | 530 | 1800 |
| 1% | 320 | 900 | 360 | 900 | 280 | 1200 | 390 | 1150 |
| 3% | 175 | 600 | 180 | 550 | 170 | 880 | 190 | 960 |
| 5% | 325 | 800 | 338 | 880 | 270 | 1100 | 380 | 1150 |
From the results in Fig. 5, it is evident that the noble metal Ag greatly improves the gas sensing behaviour of the sensor upon exposure to NH3 gas. Moreover, the abrupt decrease in the response of the sensor decorated with higher amounts of Ag than the optimal 3% (Fig. 5a) was probably due to a reduction in the number of active sites (Ag particles), which was correlated with the agglomeration of Ag grains.36,37 As for the mechanism of the performance enhancement with the Ag dopant, it could be attributed to the following factors. (1) The decorated noble metal Ag not only provides specific adsorption sites in the form of single particles mixed in the matrix, but most Ag elements can often act as catalysts. Thus, the contact potential barrier of the material is decreased and the interfacial effect is enhanced, and therefore the sensing reaction is promoted.38 Generally, a chemiresistive semiconductor sensor is based on the resistance of the sensing material changing due to chemical and electronic interactions between the adsorbed gas and the sensing material. The sensing mechanism can be described in terms of an oxygen adsorption reaction on the sensing material surface, which strongly depends on the operating temperature; the stable oxygen ions are O2−, O− and O2−, which operate below 100 °C, from 100–300 °C, and above 300 °C, respectively.39 Hence, the oxygen adsorption reactions can be represented as follows:
| O2 (gas) → O2 (ads) | (2) |
| O2 (ads) + e− → O2− (ads) | (3) |
| 2NH3 + 3O2− (ads) → 3H2O + 3e− | (4) |
Linearity between the response and the target gas concentration
With optimal 3% Ag dopant addition, the behavior of the Ag-decorated TiO2 QDs gas sensor towards different levels of NH3 gas at room temperature was further investigated. After having been exposed to NH3 gas at concentrations from 10 ppm up to 100 ppm, separately, the corresponding responses of the Ag-decorated TiO2 QDs gas sensor are shown in Fig. 6. It is clearly indicated in Fig. 6a that the responses of the sensor increased with an increase in the concentration of NH3 gas, where the sensing responses to 10 ppm and 100 ppm NH3 gas were 25.1 and 40.7, respectively. It is noteworthy that, even at a low level of 10 ppm NH3, this particular Ag-decorated TiO2 QDs gas sensor still exhibited a reasonably high sensing response of 25.1. Besides, the results in Fig. 6b demonstrated good linearity between the sensing response and the NH3 concentration, and linear equation for the correlation is S = 0.166CNH3 + 24.738, where S is the response sensitivity and CNH3 is the NH3 concentration; the regression coefficient is 0.975. In addition, in order to calculate the limit of detection (LOD) of the sensor, the signal response (S) at different NH3 concentrations was analyzed via linear regression (y = a + bx). The LOD = 3σD/s ≈ 0.217 ppm, where σD is the standard deviation of the y-intercept and s is the slope of the calibration curve. With all these results, a possible low detection limit at the ppb level is implied.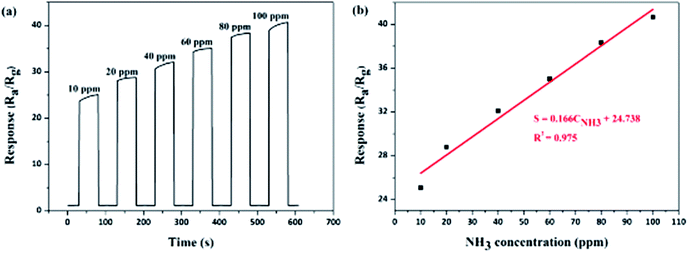 | ||
| Fig. 6 Gas sensing properties of the Ag-decorated TiO2 QDs gas sensor to different concentrations of NH3 gas: (a) dynamic response; and (b) the correlation between the response and concentration. | ||
Response/recovery time, selectivity and stability
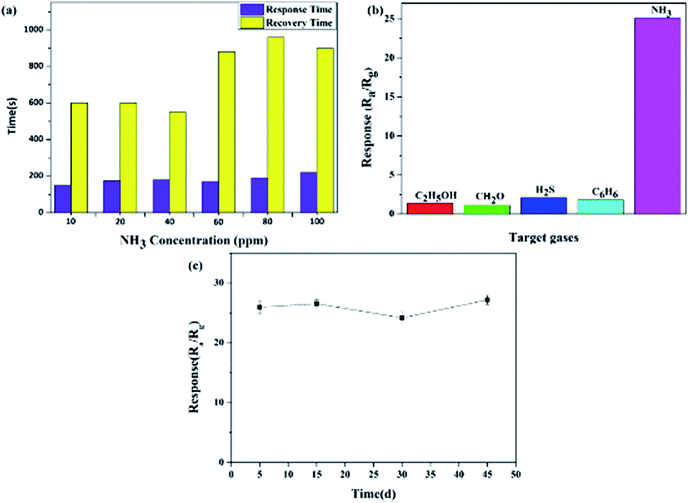
In addition to the above sensing response, the response/recovery time, selectivity and stability are also critical characteristics for gas sensors, and these gas sensing properties were further investigated.Firstly, comparisons of the response/recovery time at different NH3 gas concentrations for the Ag-decorated TiO2 QDs gas sensor are plotted in Fig. 7a. Obviously, the sensor responded faster than it recovered generally; the response time showed a tiny variation upon exposure to different levels of NH3 gas, whereas the recovery time became longer with an increase in NH3 concentration (60 to 100 ppm). Secondly, in the study, the selectivity of the Ag-decorated TiO2 QDS gas sensor was studied through exposing the sensor to 10 ppm C2H5OH, CH2O, H2S, C6H6 and NH3 gases, individually. As indicated clearly in Fig. 7b, the sensor displayed no significant sensitivities to the gases C2H5OH, CH2O, H2S and C6H6; it conversely demonstrated a very high sensitivity to NH3 gas, where the sensing response was almost 10 times higher than towards the other four kinds of gas. This result clearly revealed that the Ag-decorated TiO2 QDS gas sensor had excellent selectivity for NH3 gas. Lastly, the investigation of the long-term stability of the Ag-decorated TiO2 QDs gas sensor was conducted via putting the sensor under a 10 ppm NH3 atmosphere for 45 days. The measured results in Fig. 7c reveal that only a tiny fluctuation in the sensing response was observed during this period, which indicates that the sensor possesses a stable response to NH3 gas.
From the above-demonstrated good linearity (Fig. 6b), rapid response/recovery time (Fig. 7a), and excellent sensitivity (Fig. 7b) and stability (Fig. 7c) performances of the developed NH3 sensor based on the Ag-decorated TiO2 QDs sensing material, it is particularly important to highlight that this excellent gas sensing performance was achieved at room temperature. In recent years, most reported work on NH3 gas sensors has been conducted at high temperatures, whereas NH3 sensors operating at room temperature have been limited. Therefore, in the present study, the excellent gas sensing performance of the developed Ag-decorated TiO2 QDs gas sensor at room temperature suggests the following prospects: (1) since there is no need for the sensor to be heated to a required temperature, as shown in Fig. 7a, this implies that a prompt response could be achieved when operating at room temperature; (2) the presented room temperature operation of the Ag-decorated TiO2 QDs gas sensor showed a great possibility for using flexible natural green fibers as substrates in the fabrication of a gas sensor in which a low operation temperature is the key point.
Conclusions and prospects
Based on an Ag-decorated TiO2 QDs sensing material, an NH3 gas sensor was fabricated, and its gas sensing performance at room temperature was studied. The study results were as follows. (1) The characterization results from the Ag-decorated TiO2 sensing material displayed that the decorated Ag was in the form of spinel silver and displayed uniform distribution. Targeting NH3 gas and operation at room temperature, the optimal amount of Ag dopant addition was determined to be 3%, and gas sensing study results from the 3% Ag-decorated TiO2 QDs gas sensor toward 10–100 ppm NH3 gas revealed that the Ag-decorated TiO2 QDs gas sensor not only possessed good NH3 selectivity, gas sensitivity, stability and linearity, but it also showed rapid response and recovery times. Even at a low concentration of 10 ppm NH3 gas, it still had a high response of 25.1, a rapid response time of 150 s and a recovery time of 600 s. (2) The point most worth mentioning is that the excellent gas sensing performance of the Ag-decorated TiO2 QDs gas sensor was achieved at room temperature. This innovation showed the following great possibilities: (i) since there is no need for the sensor to be heated to a required high operating temperature, a prompt gas-sensing response can be achieved; and (ii) from a biodegradable view, a gas sensor can be developed with flexible natural green fibers as substrates in which a low operation temperature is the key point. This will be the focus of our future work.Conflicts of interest
There are no conflicts of interest to declare.Acknowledgements
The research was supported by the Research Funds of Joint Research for International Cooperation on Scientific and Technological Innovation by MOST (2017YFE9134900), the Science and Technology Program of Guangzhou, China (No. 201904010423), and the National Science Foundation of Guangdong Province, China (No. 2016A030313478).Notes and references
- R. W. Pinder, A. B. Gilliland and R. L. Dennis, Geophys. Res. Lett., 2008, 35, 82–90 CrossRef.
- J. W. Erisman, R. Otjes, A. Hensen, P. Jongejan, P. van den Bulk, A. Khlystov, H. Möls and S. Slanina, Atmos. Environ., 2001, 35, 1913–1922 CrossRef CAS.
- T. D. Durbin, R. D. Wilson, J. M. Norbeck, J. W. Miller, T. Huai and S. H. Rhee, Atmos. Environ., 2002, 36, 1475–1482 CrossRef CAS.
- Y.-L. Tang, Z.-J. Li, J.-Y. Ma, Y.-J. Guo, Y.-Q. Fu and X.-T. Zu, Sens. Actuators, B, 2014, 201, 114–121 CrossRef CAS.
- S.-Y. Wang, J.-Y. Ma, Z.-J. Li, H. Q. Su, N. R. Alkurd, W.-L. Zhou, L. Wang, B. Du, Y.-L. Tang, D.-Y. Ao, S.-C. Zhang, Q. K. Yu and X.-T. Zu, J. Hazard. Mater., 2015, 285, 368–374 CrossRef CAS PubMed.
- R. E. de la Hoz, D. P. Schlueter and W. N. Rom, Am. J. Ind. Med., 1996, 29, 209–214 CrossRef CAS PubMed.
- W. Ament, J. Huizenga, E. Kort, T. van der Mark, R. Grevink and G. Verkerke, Int. J. Sports Med., 1999, 20, 71–77 CrossRef CAS PubMed.
- C. Baratto, RSC Adv., 2018, 8, 32038–32043 RSC.
- G. N. Dar, A. Umar, S. A. Zaidi, S. Baskoutas, S. W. Hwang, M. Abaker, A. Al-Hajry and S. A. Al-Sayari, Talanta, 2012, 89, 155–161 CrossRef CAS PubMed.
- C. Xu, N. Miura, Y. Ishida, K. Matsuda and N. Yamazoe, Sens. Actuators, B, 2000, 65, 163–165 CrossRef CAS.
- D. Han, P. Song, H. Zhang, H. Yan, Q. Xu, Z. Yang and Q. Wang, RSC Adv., 2014, 4, 50241–50248 RSC.
- P. Guo and H. Pan, Sens. Actuators, B, 2006, 114, 762–767 CrossRef CAS.
- A. Satsuma, K. Shimizu, T. Hattori, H. Nishiyama, S. Kakimoto, S. Sugaya and H. Yokoi, Sens. Actuators, B, 2007, 123, 757–762 CrossRef CAS.
- V. Modafferi, G. Panzera, A. Donato, P. L. Antonucci, C. Cannilla, N. Donato, D. Spadaro and G. Neri, Sens. Actuators, B, 2012, 163, 61–68 CrossRef CAS.
- J. Huang, J. Wang, C. Gu, K. Yu, F. Meng and J. Liu, Sens. Actuators, A, 2009, 150, 218–223 CrossRef CAS.
- E. Bekyarova, M. Davis, T. Burch, M. E. Itkis, B. Zhao, S. Sunshine and R. C. Haddon, J. Phys. Chem. B, 2004, 108, 19717–19720 CrossRef CAS.
- W. Kim, J. S. Lee and J. Jang, RSC Adv., 2018, 8, 31874–31880 RSC.
- J. Deng, R. Zhang, L. Wang, Z. Lou and T. Zhang, Sens. Actuators, B, 2015, 209, 449–455 CrossRef CAS.
- Z. Jing and J. Zhan, Adv. Mater., 2008, 20, 4547–4551 CrossRef CAS.
- S. Tian, F. Yang, D. Zeng and C. Xie, J. Phys. Chem. C, 2012, 116, 10586–10591 CrossRef CAS.
- K. Anand, O. Singh, M. P. Singh, J. Kaur and R. C. Singh, Sens. Actuators, B, 2014, 195, 409–415 CrossRef CAS.
- D. Xue, R. Zhou, X. Lin, X. Duan, Q. Li and T. Wang, RSC Adv., 2019, 9, 4150–4156 RSC.
- J. Haeng Yu and G. Man Choi, Sens. Actuators, B, 1998, 52, 251–256 CrossRef.
- H. Gong, J. Q. Hu, J. H. Wang, C. H. Ong and F. R. Zhu, Sens. Actuators, B, 2006, 115, 247–251 CrossRef CAS.
- I. P. Liu, C. H. Chang, T. C. Chou and K. W. Lin, Sens. Actuators, B, 2019, 291, 148–154 CrossRef CAS.
- V. Srivastava and K. Jain, Sens. Actuators, B, 2008, 133, 46–52 CrossRef CAS.
- C. Cannilla, G. Bonura, F. Frusteri, D. Spadaro, S. Trocino and G. Neri, J. Mater. Chem. C, 2014, 2, 5778 RSC.
- Y. Tang, Z. Li, X. Zu, J. Ma, L. Wang, J. Yang, B. Du and Q. Yu, J. Hazard. Mater., 2015, 298, 154–161 CrossRef CAS PubMed.
- N. Van Hieu, V. Van Quang, N. D. Hoa and D. Kim, Curr. Appl. Phys., 2011, 11, 657–661 CrossRef.
- Y. Zeng, Z. Lou, L. Wang, B. Zou, T. Zhang, W. Zheng and G. Zou, Sens. Actuators, B, 2011, 156, 395–400 CrossRef CAS.
- H. Liu, W. Shen, X. Chen and J. P. Corriou, J. Mater. Sci.: Mater. Electron., 2018, 29, 18380–18387 CrossRef CAS.
- H. Tai, Y. Jiang, G. Xie, J. Yu, X. Chen and Z. Ying, Sens. Actuators, B, 2008, 129, 319–326 CrossRef CAS.
- H. Tai, Y. Jiang, G. Xie, J. Yu and M. Zhao, Int. J. Environ. Anal. Chem., 2007, 87, 539–551 CrossRef CAS.
- J. Gong, Y. Li, Z. Hu, Z. Zhou and Y. Deng, J. Phys. Chem. C, 2010, 114, 9970–9974 CrossRef CAS.
- C.-L. Wang, W.-S. Hwang, H.-L. Chu, H.-J. Lin, H.-H. Ko and M.-C. Wang, Ceram. Int., 2016, 42, 13136–13143 CrossRef CAS.
- S. Pandey and K. K. Nanda, ACS Sens., 2016, 1, 55–62 CrossRef CAS.
- G. Xu, Y. W. Zhang, X. Sun, C. L. Xu and C. H. Yan, J. Phys. Chem. B, 2005, 109, 3269–3278 CrossRef CAS PubMed.
- L. Chen and S. C. Tsang, Sens. Actuators, B, 2003, 89, 68–75 CrossRef CAS.
- M. Takata, D. Tsubone and H. Yanagida, J. Am. Ceram. Soc., 1976, 59, 4–8 CrossRef CAS.
| This journal is © The Royal Society of Chemistry 2019 |

