 Open Access Article
Property improvement of multi-walled carbon nanotubes/polypropylene composites with high filler loading via interfacial modification
Hongqing Wang,
Zewen Li,
Kailiang Hong,
Mengna Chen,
Zhen Qiao,
Zhijuan Yuan and
Zhe Wang *
*
Key Laboratory of Chemical Engineering Process and Technology for High-Efficiency Conversion, College of Heilongjiang Province, School of Chemistry and Materials Science, Heilongjiang University, Harbin 150080, People's Republic of China. E-mail: zhe.wang@msn.com
First published on 17th September 2019
Abstract
Although carbon nanotubes (CNTs) exhibit excellent performance, they are prone to agglomeration because of their high surface energy and large specific surface area. Moreover, CNTs are hardly compatible with polymers due to their nonpolar properties, as manifested by the less stable interface between these two components. This study was aimed at improving the compatibility between multi-walled carbon nanotubes (MWNTs) and polypropylene (PP). Herein, a practical strategy for the modification of MWNTs and the subsequent fabrication of polypropylene-grafted multi-walled carbon nanotubes (PP-g-MWNTs) are reported. The morphology of the as-obtained PP-g-MWNTs was observed using a scanning electron microscope (SEM), a transmission electron microscope (TEM) and a polarizing microscope, whereas their elemental composition and bond structures were characterized by Fourier transform infrared (FT-IR) spectroscopy, energy dispersive spectroscopy (EDS) and X-ray photoelectron spectroscopy (XPS). X-ray diffraction (XRD) was used for crystallographic analyses. A performance comparison between the PP-g-MWNT samples and the undecorated samples was conducted based on the results obtained via dynamic mechanical analysis (DMA), tensile testing, differential scanning calorimetry (DSC) and thermogravimetric analysis (TGA). Serial characterizations proved the successful grafting of PP molecular chains onto the MWNT surfaces. Thus, the MWNTs, the filler phase, could be included into the PP matrix covalently and thus existed as an integrated component of the composite system. As a consequence, the specific design of PP-g-MWNTs remarkably improved both thermal and mechanical properties of the PP composites.
1. Introduction
As a common type of engineering plastics, polypropylene (PP) exhibits excellent physical properties, prominent mechanical performance and facile processability.1 However, its practical applications are significantly restricted due to its low-temperature brittleness; recently, studies on the modification of PP or PP composites by filling them with rubber particles or functionalized carbon nanotubes (CNTs) have attracted the attention of many researchers. The addition of these fillers increases the strength and toughness of the composites.2,3 Undeniably, CNTs have continuously been a good choice for the fabrication of polymer-based nanocomposites since 1991. CNTs have a broad spectrum of merits, including high surface area, low density, as well as various excellent mechanical properties, chemical stabilities and thermal properties, because of their unique structure.4–15 The addition of CNTs to a polymer matrix can result in an improvement in the physical and mechanical properties or even some novel functions that did not exist before.16,17 Commonly, CNTs can be divided into two categories: single-walled CNTs (SWNTs) and multi-walled CNTs (MWNTs). Since the former is more costly than the latter, MWNTs have received extensive attention over the years. Numerous studies have reported the positive impacts of MWNTs on PP/CNT nanocomposites in terms of their mechanical performance, electrical properties, thermal stabilities and crystallization capacities.18–20 As a primary research direction, the influence of the modification of PP composites by the filling of CNTs on the properties of the PP composites has been explored in detail by many research groups.9,21,22 For instance, Andrews et al.23 found a 60% decrement in the tensile strength of the PP composites containing 12.5% (volume percentage) CNTs when compared with the strength value of neat PP. Moreover, Liu and Gao24 highlighted that filling the PP matrix with a 3% CNTs (weight percentage) could enhance both the tensile and the compact strengths. Bao et al.25 reported a significant dependence of the tensile properties of these composites on the filling rate. By scrutinizing closely the mechanical performance and yielding behaviors of PP/MWNTs composites, optimal stiffness and strength could be achieved at the CNT filling rate of 0.3% (weight percentage). Moreover, Kashiwagi et al. 26 incorporated MWNTs as flame-retardant additives into a PP matrix and verified the significance of MWNTs for thermal conductivity and stability; for blending, solution-blending, in situ polymerization27 as well as melt-mixing28 have been employed before.Although the property improvement of PP/MWNT composites has already made a significant progress,29–32 limitations, such as poor compatibility between the fillers and the matrix as well as the agglomeration of MWNTs, still remain. In this regard, approaches, including the regulation of PP molecular weight,33 post-treatment,34 and use of a compatibilizer,35 have been developed for improving the compatibility and enhancing the dispersibility of these composites. However, further exploration is required to better fulfil the practical requirements.
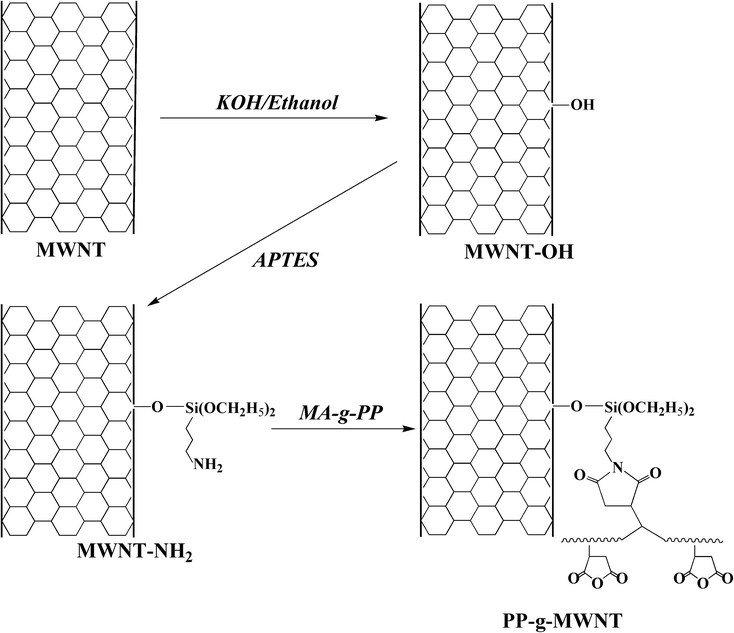
Herein, we report a blending method of PP/MWNT composites based on the preparation of PP-g-MWNTs. To be specific, PP was grafted with 1.00 wt% of maleic anhydride (PP-g-MAH). Moreover, CNTs were covalently attached with hydroxyl groups (MWNTs-OH) using KOH and further transformed into MWNTs-NH2 by a silane coupling agent. The subsequent reaction between the amino groups on MWNTs and the MAH groups on PP resulted in the successful grafting of PP chains onto the MWNT; this afforded the target product PP-g-MWNTs. With crystalline PP coated on the surface, MWNTs could better distribute into the PP matrix, and their reinforcing effect was ascertained within a loading range between 0.30 wt% and 10.00 wt%. The DSC and DMA data confirmed that the covalent integration method enabled the PP-g-MWNTs to be an intrinsic part of the composite system, and remarkable improvements in the mechanical, thermal, and electrical properties of the obtained composites were achieved due to the uniform distribution of MWNTs and interfacial conditions.
2. Experimental
2.1 Materials
MWNTs (diameter of 10–20 nm, purity > 95%) prepared via chemical vapor deposition (CVD) were purchased from Chengdu Organic Chemistry Co., Ltd. (China). PP (type T30S) and PP-g-MAH (1 wt% MAH) were commercially available at PetroChina Daqing Petrochemical Co. and Huangshan Beno Technology Co., Ltd., respectively. N,N′-Dimethylformamide (DMF), anhydrous ethanol and dimethylbenzene were produced by Tianjin Kermel Chemical Reagent Co., Ltd. (China). 3-Aminopropyltriethoxysilane (APTES) was provided by the Chengdu Organic Chemistry Institute.2.2 Synthesis of hydroxylated carbon nanotubes (MWNTs-OH)
Fig. 1 illustrates the synthesis route of PP-g-MWNTs, with the hydroxylation of MWNTs as the initial step. To be specific, a mixture of potassium hydroxide (10.0012 g) and anhydrous ethanol (100 mL) was added to a three-necked flask and then stirred for half an hour. Subsequently, MWNTs (2.0023 g) were added to the abovementioned mixture. The mixture then underwent ultrasonic dispersion (30 min) and a reaction in an oil bath for 12 h at 100 °C. Next, it was filtered through a 45 μm-aperture membrane, followed by washing thrice with ethanol and deionized water. The MWNTs-OH could be obtained after keeping the filtrate in vacuo for 12 h at 80 °C.2.3 Synthesis of aminated carbon nanotubes (MWNTs-NH2)
The as-prepared MWNTs-OH (2.0035 g) powder was dispersed in DMF (100 mL), subjected to ultrasonication (1 h) in a beaker and transferred into a three-necked flask. After the addition of APTES, the flask was kept in an oil bath for 1 h at 110 °C with 40 mL of APTES refluxing. The mixture was filtered through a 0.22 μm-aperture membrane to afford the crude products, and then, the products were completely washed with DMF and dried in vacuo for 12 h at 80 °C. The product obtained was termed as MWNTs-NH2.2.4 Fabrication of the PP-g-MWNTs
The MWNTs-NH2 powder (2.0013 g) was first dispersed in dimethylbenzene (100 mL) in an ultrasonic cleaner for 0.5 h, and PP-g-MAH (4.0236 g) was dissolved in dimethylbenzene (300 mL) in a three-necked flask via heating. Next, these two systems were mixed for 24 h at 110 °C. The mixture obtained was filtered by a 0.22 μm-aperture membrane and dried in vacuo for 12 h at 80 °C to afford the PP-g-MWNTs.2.5 Fabrication of the PP-g-MWNTs/PP composites
Solution blending was used in this study for the preparation of the PP-g-MWNTs/PP composites. PP was mixed with PP-g-MWNTs in 120 °C xylene for 30 min. Octanol (1 drop) was added to the obtained mixture followed by further stirring; the mixture was then transferred into a water bath (90–100 °C) and sonicated for better dispersion. Filtration and in vacuo drying (80 °C, 12 h) yielded the crude blending powder, which was subsequently melted in a self-made mold using the hot-pressing approach. Sample wafers (2.5 or 5 mm in diameter) for mechanical testing were prepared by pressing successively at 180 °C and room temperature. The MWNT contents in the samples were 0 wt%, 0.30 wt%, 0.50 wt%, 0.75 wt%, 1.00 wt%, 5.00 wt%, 7.00 wt% and 10.00 wt%.2.6 Characterization
The bonding structures of the as-prepared PP-g-MWNTs were analyzed by Fourier transform infrared (FTIR) spectroscopy using the PerkinElmer Spectrum model 100 FTIR spectrometer, whereas the crystalline structures were characterized by a Bruker D8 X-ray diffractometer (XRD, Billerica, Massachusetts, USA) using copper Kα radiation (λ = 0.15405 nm, 40 kV, and 100 mA). X-ray photoelectron spectroscopy (XPS) was performed using the Kratos-AXIS ULTRA DLD instrument with an Al Kα X-ray source. Morphology observation was performed using transmission electron microscopy (TEM, JEM-2100, Techcomp Ltd., Japan; 200 kV). Energy dispersive X-ray spectroscopy (EDX) analysis was also carried out using the same TEM (TEM, JEM-2100, Techcomp Ltd., Japan; 200 kV). Differential scanning calorimetry (DSC, PerkinElmer Pyris) was carried out under a nitrogen atmosphere by heating the sample to 170 °C (10 °C min−1), maintaining at this temperature for 10 min, and cooling down (10 °C min−1); on the other hand, dynamic mechanical analysis (DMA, PE Ltd., USA) was conducted under nitrogen purge by heating the sample to 170 °C (5 °C min−1). Thermal stabilities of different contents of PP-g-MWNTs/PP composites were ascertained by thermogravimetric analysis (TGA, Q500) in air at the heating rate of 10 °C min−1 from room temperature to 800 °C. The polarizing microscope was produced by Shanghai Caikon Optical Instrument Co., Ltd. Tensile performance of the samples was assessed using an R-9100 mechanical tester (Shen Zhen Kaiqiangli Machinery Co., Ltd., China). Electrical conductivity was ascertained by the HB-Z103-2AC high-voltage DC power supply, which was obtained from Shanghai No. 6 Electricity Meter Co., Ltd., China.3. Results and discussion
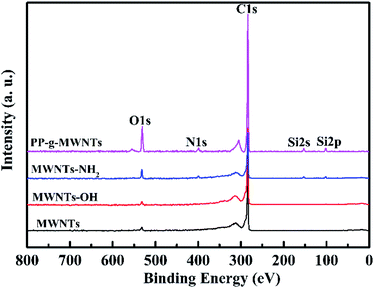
Pristine MWNTs, MWNTs-OH, MWNTs-NH2, and PP-g-MWNTs were first subjected to XPS scanning, with the broad spectra presented in Fig. 2 and the atomic percentages listed in Table 1. At first, as analyzed from the wide spectra, there were two spectral peaks at 532.8 eV and 284.6 eV in the MWNTs and MWNTs-OH curves, representing the binding energies of O 1s and C 1s, respectively. Moreover, in the spectra of MWNTs-NH2 and PP-g-MWNTs, three new spectral peaks appeared at 399.8 eV, 153.0 eV and 102.8 eV, representing the binding energies of N 1s, Si 2s and Si 2p, respectively, due to the generation of N and Si after the amination reaction. For the MWNTs, the content of C 1s was 97.19 wt% and that of O 1s was 2.81 wt% because the MWNTs carried a hydroxyl group during the purging process. Moreover, for MWNTs-OH, the content of O 1s was increased significantly to 4.19 wt%; this suggested that the hydroxyl group was grafted onto the MWNT. The N and Si spectral peaks appeared in the spectrum of MWNTs-NH2, proving that the MWNTs grafted with ATPES were aminated successfully. Moreover, the content of O 1s was increased to 4.53 wt%, which was a common phenomenon that resulted from the ATPTS hydrolysis. The content of C 1s in the PP-g-MWNTs was increased significantly from 93.49 wt% to 97.23 wt%; this suggested that PP was added successfully.| Samples | Element (at%) | |||
|---|---|---|---|---|
| C | N | O | Si | |
| MWNTs | 97.19 | 0 | 2.81 | 0 |
| MWNTs-OH | 95.81 | 0 | 4.19 | 0 |
| MWNTs-NH2 | 93.49 | 1.37 | 4.53 | 0.58 |
| PP-g-MWNTs | 97.23 | 0.57 | 1.75 | 0.45 |
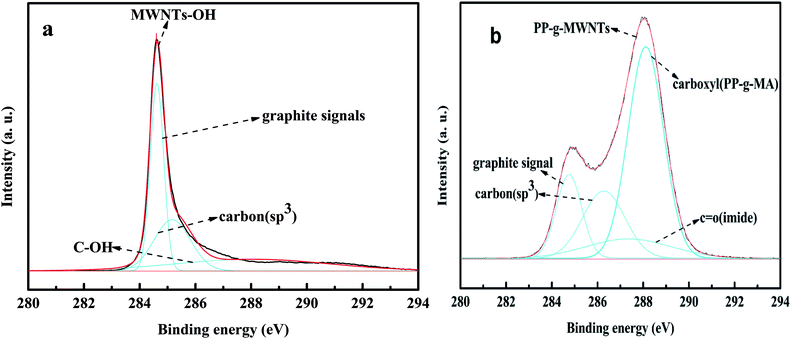
The carbon peak-differentiating graphics of MWNTs-OH are shown in Fig. 3(a). As can be observed from the figure, there are two peaks at 284.5 eV and 285.1 eV for MWNTs-OH. They are the graphite signal and the signal for sp3-hybridized carbon, respectively; both of them are the characteristic peaks of MWNTs. Fig. 3(b) shows the C 1s peak separation for PP-g-MWNTs; some changes occurred during peak differentiation due to the addition of PP, which consequently resulted in new peaks at 284.5 eV, 285.1 eV, 286.3 eV and 288.8 eV, which respectively corresponded to the graphite signal, the signal for sp3-hybridized carbon, the signal for the carbonyl bond in imides and the signal for the ester bond. The grafting of PP can be fully proved by the electron absorption of MWNTs, due to which the positions of the carbonyl peak and ester peak move towards high binding energies.
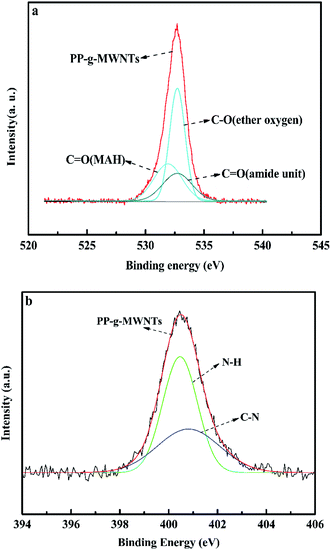
As shown in Fig. 4, Fig. 4(a) shows the oxygen peak-differentiating diagram of the PP-g-MWNTs. It could be split into three peaks (532.6 eV, 533.8 eV, and 532.4 eV), representing the carbonyl bond in maleic anhydride, the ether bond in maleic anhydride and the carbonyl bond in amide. Fig. 4(b) shows the peak segmentation of N 1s. The spectral peaks at 401.2 eV and 400.4 eV represent the C–N and N–H bonds. It could also be fully proved that the MWNTs could successfully graft PP through a covalent bond reaction.
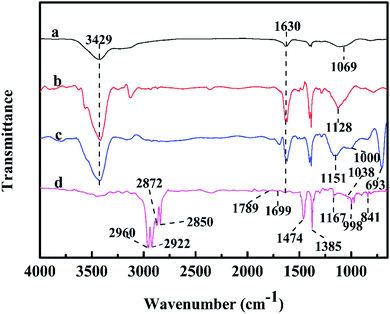
The FTIR spectra of MWNTs before and after functionalization are compared in Fig. 5 to determine their molecular compositions and chemical structures. In the spectrum of pristine MWNTs shown in Fig. 5(a), the absorption bands at 3429 cm−1 and 1069 cm−1 are attributed to the hydroxyl groups (–OH) on the MWNT surface probably because MWNTs are either oxidized or hydrated during purification. In addition, the intense band at 1630 cm−1 corresponds to the C![[double bond, length as m-dash]](https://www.rsc.org/images/entities/char_e001.gif) C stretching vibration; Fig. 5(b) shows the spectrum for MWNTs-OH, where the –OH band in the range from 3400 cm−1 to 3550 cm−1 with increasing width and intensity demonstrates the grafting of hydroxyl groups on the MWNT surface. The peak at 1630 cm−1 corresponds to the C
C stretching vibration; Fig. 5(b) shows the spectrum for MWNTs-OH, where the –OH band in the range from 3400 cm−1 to 3550 cm−1 with increasing width and intensity demonstrates the grafting of hydroxyl groups on the MWNT surface. The peak at 1630 cm−1 corresponds to the C![[double bond, length as m-dash]](https://www.rsc.org/images/entities/char_e001.gif) C stretching, whereas that at 1128 cm−1 can be assigned to the stretching of C–O. This result is consistent with Fig. 3(a), suggesting that the nanotubes have been grafted with hydroxyl groups. As shown in Fig. 5(c), a remarkable decrease in the –OH amounts was suggested by the absorption band between 3400 cm−1 and 3550 cm−1. On the one hand, the hydroxyl groups were consumed during amination. On the other hand, the band belonging to primary amines at the same wavenumber was significantly weaker. Moreover, the two new absorption peaks at 1151 cm−1 and 1000 cm−1 are the stretching vibration peaks of Si–O–C. In addition, the telescopic vibration peak of C–Si appears at 693 cm−1. Thus, the MWNT modification with amino groups was well proved by all these changes. As shown in the spectrum of PP-g-MWNTs in Fig. 5(d), the new bands at 2960 cm−1 and 2872 cm−1 originated from the methyl stretching vibration, whereas those in the vicinity of 2850 cm−1 and 2922 cm−1 were ascribed to the methylene telescopic vibration. These four peaks fully demonstrate the existence of PP. The absorption bands at 1789 cm−1 and 1699 cm−1 correspond to C
C stretching, whereas that at 1128 cm−1 can be assigned to the stretching of C–O. This result is consistent with Fig. 3(a), suggesting that the nanotubes have been grafted with hydroxyl groups. As shown in Fig. 5(c), a remarkable decrease in the –OH amounts was suggested by the absorption band between 3400 cm−1 and 3550 cm−1. On the one hand, the hydroxyl groups were consumed during amination. On the other hand, the band belonging to primary amines at the same wavenumber was significantly weaker. Moreover, the two new absorption peaks at 1151 cm−1 and 1000 cm−1 are the stretching vibration peaks of Si–O–C. In addition, the telescopic vibration peak of C–Si appears at 693 cm−1. Thus, the MWNT modification with amino groups was well proved by all these changes. As shown in the spectrum of PP-g-MWNTs in Fig. 5(d), the new bands at 2960 cm−1 and 2872 cm−1 originated from the methyl stretching vibration, whereas those in the vicinity of 2850 cm−1 and 2922 cm−1 were ascribed to the methylene telescopic vibration. These four peaks fully demonstrate the existence of PP. The absorption bands at 1789 cm−1 and 1699 cm−1 correspond to C![[double bond, length as m-dash]](https://www.rsc.org/images/entities/char_e001.gif) O (MAH) and C
O (MAH) and C![[double bond, length as m-dash]](https://www.rsc.org/images/entities/char_e001.gif) O (amide unit), respectively. In addition, there is a weaker peak at 1038 cm−1, which corresponds to the stretching of the C–O bond in the anhydride group. Moreover, this result is consistent with Fig. 4(a). In addition, doublets occurred at the positions 1474 cm−1 and 1385 cm−1 due to shake coupling caused by the stretching vibration of the absorption bands corresponding to the C–N and N–H bonds of acid amides in the polymer, whereas the wavenumber of the characteristic peaks moved to the direction of low value; this was caused by the influence of the single and double-bond conjugated structure of MWNTs. Moreover, this result is consistent with Fig. 4(b). By checking the literature and books, it was also discovered that the crystalline bands of PP found in the fingerprint region occurred at positions near 1167 cm−1, 998 cm−1, and 841 cm−1, indicating that PP with stem-grafted MWNTs was a crystal-form polymer; based on the abovementioned analysis, maleic anhydride and the coupling reagent were used to successfully graft PP on the MWNT surface.
O (amide unit), respectively. In addition, there is a weaker peak at 1038 cm−1, which corresponds to the stretching of the C–O bond in the anhydride group. Moreover, this result is consistent with Fig. 4(a). In addition, doublets occurred at the positions 1474 cm−1 and 1385 cm−1 due to shake coupling caused by the stretching vibration of the absorption bands corresponding to the C–N and N–H bonds of acid amides in the polymer, whereas the wavenumber of the characteristic peaks moved to the direction of low value; this was caused by the influence of the single and double-bond conjugated structure of MWNTs. Moreover, this result is consistent with Fig. 4(b). By checking the literature and books, it was also discovered that the crystalline bands of PP found in the fingerprint region occurred at positions near 1167 cm−1, 998 cm−1, and 841 cm−1, indicating that PP with stem-grafted MWNTs was a crystal-form polymer; based on the abovementioned analysis, maleic anhydride and the coupling reagent were used to successfully graft PP on the MWNT surface.
 | ||
| Fig. 5 Fourier transform infrared spectra of (a) MWNTs, (b) MWNTs-OH, (c) MWNTs-NH2 and (d) PP-g-MWNTs. | ||
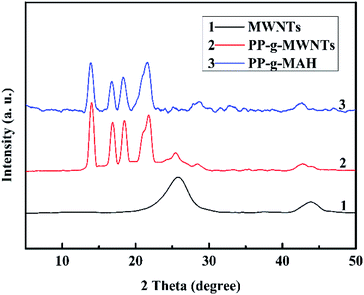
Fig. 6 depicts the XRD patterns of MWNTs, PP-g-MWNTs, and PP-g-MAH. The peaks at 2θ = 25.4° and 43.6° in curve 1 are attributed to the characteristic diffraction peaks of MWNTs. In comparison, several new peaks occurred at 2θ = 21.1°, 18.7°, 17°, and 14° in curve 2, which belonged to the diffraction features of PP. Moreover, in curve 3, PP-g-MAH has these four peaks, but the peak strength is slightly different; this may be due to the influence brought by the addition of MWNTs. Therefore, the successful grafting of PP onto the MWNT surface could be again well proved.
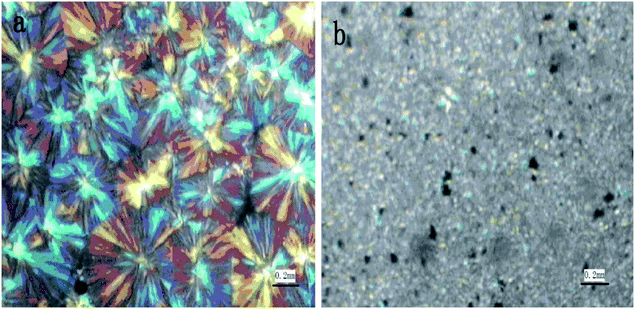
In Fig. 7(a) and (b), the crystal form of PP is shown, whose typical form is the shape of a large petal, and the feature of cross-shaped polarized light is obvious. Moreover, the images obtained under the polarizing microscope show that the composite materials with stem-grafted MWNTs have been changed into many fine grains, suggesting that the mixing of MWNTs leads to the formation of a novel crystal form of PP. The MWNTs acted as a nucleating agent, more conducive to the enhancement of the integral performances of composite materials.
The morphologies of pristine MWNTs and PP-g-MWNTs were observed by TEM and are compared in Fig. 8. As can be observed, the shape of nanotubes (Fig. 8(a)) is clearer and brighter as compared to that after PP grafting (Fig. 8(b)). Moreover, the PP-g-MWNTs were much thicker with a PP layer wrapped outside the nanotubes than the original MWNTs. Fig. 8(b) indicates that the PP groups have been successfully grafted on the surface of MWNTs. For determining the surface elemental compositions of PP-g-MWNTs, the EDS map of a selected area (TEM image of Fig. 8(c)) was also acquired and is shown in Fig. 8(d), and the atomic percentage contents are listed in Table 2. Heteroatoms, including C, N, O, and Si, are distributed on the surface of the sample. This result further proves the grafting of PP onto the MWNTs.
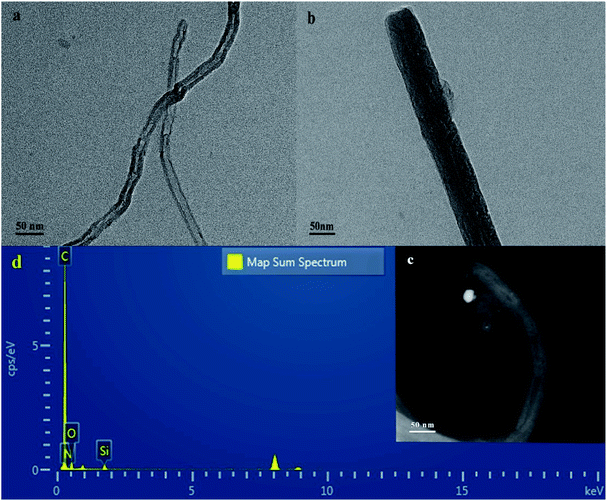 | ||
| Fig. 8 TEM images of the (a) MWNTs and (b) PP-g-MWNTs. TEM-EDS images of the PP-g-MWNTs (c) a TEM image and (d) the EDS spectrum of the structures. | ||
| Element | Line type | k factor | Absorption correction | wt% | wt% sigma |
|---|---|---|---|---|---|
| C | K series | 2.50675 | 1.00 | 95.66 | 0.22 |
| N | K series | 3.14061 | 1.00 | 0.38 | 0.17 |
| O | K series | 1.86867 | 1.00 | 2.73 | 0.13 |
| Si | K series | 1.00000 | 1.00 | 1.23 | 0.06 |
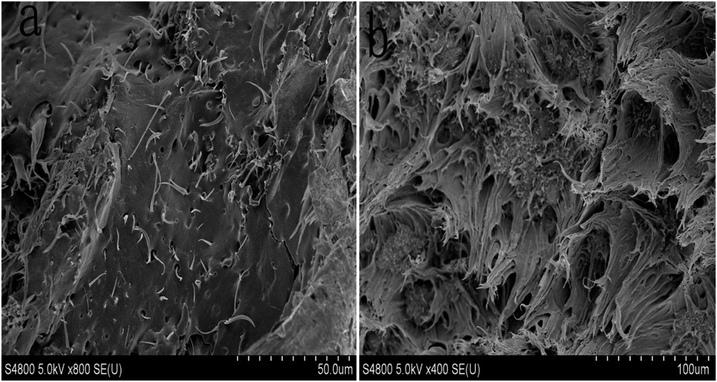
Fig. 9(a) shows the SEM image of the fracture surface of the MWNTs/PP composite material. It can be observed from the morphology that the distribution of MWNTs in PP is very uneven, and most of the MWNTs are gathered in different clusters. In addition, the cross-section of the MWNTs/PP composite material is smooth and does not have any significant wrinkle; this indicates that when external forces function on the surface of the composite material, due to a poor adhesion between the MWNTs and PP at the interface, there would be no PP composite material that has high enhancing and toughening capacity. Fig. 9(b) shows the SEM image of the fracture surface of the PP-g-MWNTs/PP. It can be observed from Fig. 9(b) that the distribution of PP-g-MWNTs in PP is even, and PP has sufficiently infiltrated the functional MWNT. Moreover, the cross section of the PP-g-MWNTs/PP composite material is rough, which is because the crack encountered the blocking effect of PP-g-MWNTs in the process of propagation; thus, it constantly changes the direction of fracture and expansion; this sufficiently proves that the addition of PP-g-MWNTs improves the toughness of the composite material.
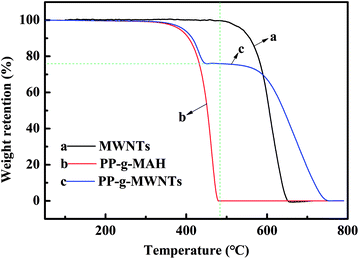
The TGA curve b in Fig. 10 suggests that the PP-g-MAH begins to get consumed at around 410 °C. Curve c also exhibits that PP in PP-g-MWNTs begins to get consumed at around 410 °C until a plateau is achieved when the consumption reaches 76 wt%; this suggests that only PP is consumed in this phase. It was concluded that the consumption of PP was 24 wt%, i.e., the grafting rate of the PP-g-MWNTs was 24 wt%. According to curve a, the consumption of the MWNTs started to break down at about 523 °C until a complete decomposition was achieved at 656 °C. Therefore, the process of consumption of the PP-g-MWNTs from after the plateau to 0 demonstrated that the amount of residual MWNTs was 76 wt%.
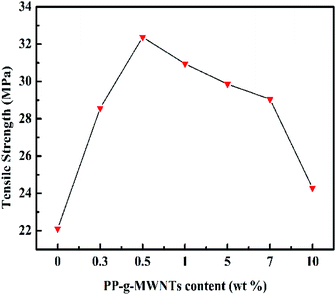
The PP composites with varying PP-g-MWNT contents were obtained from casting molding and then subjected to tensile testing. As suggested by the results depicted in Fig. 11 and listed in Table 3, an increase in the content of the PP-g-MWNTs brought an enhancement and then deterioration to various mechanical properties. Optimal results were obtained at the filling rate of 0.50 wt%. This phenomenon can be explained from different perspectives. On the one hand, the connection between PP and MWNTs was covalent bonding rather than a physical entanglement or hydrogen bonding. Consequently, the chemical network formed could lead to a strengthened interface between PP and MWNTs, and the tensile strength was thus enhanced. Then, the modification of nanotubes could ensure their better distribution throughout the PP matrix during the course of blending, which promoted the maximized embodiment of their excellent characteristics and thereby the improvement of overall tensile properties. On the other hand, the MWNTs at excessive filling rates would inevitably aggregate, and then, the steric factors from adjacent groups at loading rates higher than 0.50 wt% would enhance the brittleness of the PP composites while decreasing their tensile strength. However, a 9.90 wt% increment could still be observed when the PP matrix is filled with 10.00 wt% MWNTs; thus, the covalent grafting of PP onto the MWNT surface indeed facilitated the general improvement of mechanical performance.
| MWNTs (wt%) | Tensile strength (MPa) | Increased range (%) | Breaking elongation | Reduction (%) |
|---|---|---|---|---|
| 0 | 22.1 | 0 | 0.075 | 0 |
| 0.3 | 28.57 | 29.2 | 0.030 | 90.0 |
| 0.5 | 32.37 | 46.4 | 0.036 | 52.0 |
| 1 | 30.94 | 40.1 | 0.030 | 60.0 |
| 5 | 29.86 | 35.3 | 0.019 | 74.7 |
| 7 | 29.05 | 31.4 | 0.015 | 80.0 |
| 10 | 24.29 | 9.9 | 0.014 | 81.3 |
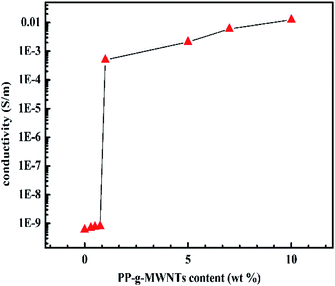
An increasing trend was found for the electrical conductivity of the composites with an increase in the MWNT content, as shown in Fig. 12, and the insulator–conductor transition occurred at critical threshold. Moreover, the better the interfacial adhesion between the MWNTs filler and the PP matrix, the higher the electrical pathways that could be generated.36
Fig. 13(a) shows the storage modulus curves of the PP composites with various contents of PP-g-MWNTs, and a downtrend along with the increasing temperature can be observed for all the samples. At 60 °C, the energy storage moduli of PP-g-MWNTs with 0.30 wt%, 0.50 wt% and 0.75 wt% contents increased by 5.40 wt%, 24.00 wt% and 11.00 wt%, respectively, when compared with the case of pure PP. It is generally known that storage modulus reflects the elastic properties of materials, and the higher the modulus, the better the impact resistance during the collision. However, the composites demonstrated an enhanced impact resistance as the MWNT content increased. Moreover, the result agreed with those obtained via tensile testing, i.e., the PP composite filled with 0.50 wt% MWNTs displayed the best performance.
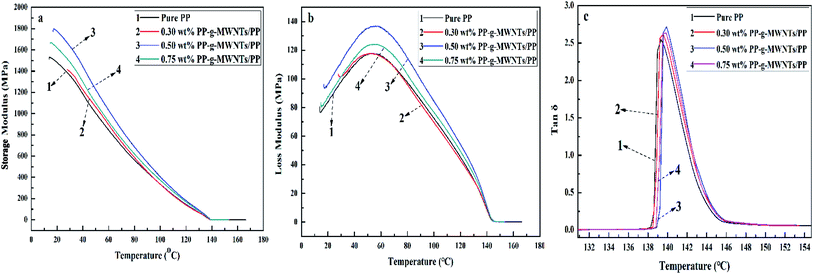 | ||
| Fig. 13 (a) Storage modulus curves of the PP-g-MWNTs/PP composites, (b) loss modulus curves of the PP-g-MWNTs/PP composites and (c) loss tangent curves of the PP-g-MWNTs/PP composites. | ||
The loss modulus curves of the PP composites are shown in Fig. 13(b) to describe their viscous characteristics accordingly, and the lowest modulus occurred for pure PP. Overall, the loss modulus peak increased at higher filler contents; this suggested an enhancement in the toughness of the materials. Once again, it was proved that the PP matrix filled with 0.50 wt% MWNTs was the best composite system according to the results of tensile testing. The improvement in toughness is the result of a combination of multiple causes. The larger movement amplitude of the PP molecular chain at higher temperatures and the good dispersion state of the filler lead to an improvement in the toughness of the material. In addition, a strengthened composite network generated by covalently grafting the PP chains onto the MWNT surface enhances the toughness of the composite. The easier the chain moves at higher temperatures, the higher the internal consumption; however, this consumption would be reduced by the excessive loading of the MWNT fillers.
The loss tangents of the composites prepared herein were further calculated based on the storage and loss moduli to reveal their internal consumption more intuitively, as shown in Fig. 13(c). The internal friction peaked basically at 140 °C, with a tiny deviation at higher temperatures as the PP-g-MWNT content increased. The experimental results indicated that the easier movement of PP chains at higher temperatures led to better MWNT distribution and subsequently enhanced energy dissipation at the interface, in well accordance with the theoretical results. However, excessive PP-g-MWNTs filled into the PP matrix could incur agglomeration, thereby compromising the interface performance of the composites obtained.
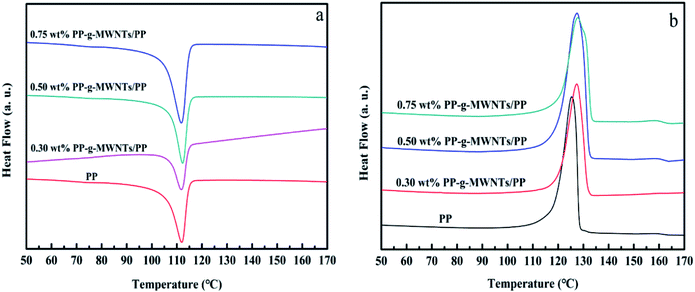
DSC curves in Fig. 14 reveal the progressive increase in the melting and crystallization temperatures of the PP composites with the PP-g-MWNT addition, also suggesting that the PP chains were grafted on MWNT surface via covalent bonding and thus realized a better interface performance. However, it was merely a limited improvement since the MWNTs might restrain the free motion of the PP molecular chains to some extent.
4. Conclusion
Through amination between hydroxylated and aminated MWNTs and MAH-g-PP, PP-g-MWNT composites with the grafting percent of 24% were obtained in this study, which were used as a reinforcing material to reinforce the PP composites. The attachment of PP on the MWNT surface was characterized by multiple techniques including FTIR spectroscopy, XPS, and TGA. The effects of PP-g-MWNTs on the mechanical, thermal, and electrical properties of the PP composites were evaluated by the tensile test, DMA, and electrical resistivity. The experimental results showed that with an increase in the addition amount of PP-g-MWNTs, there was a significant improvement in the mechanical and thermal properties of the composite, which reached a maximum value at 0.5 wt%. Moreover, the conductivity of the composite increased with an increase in the addition amount of the PP-g-MWNTs, whereas the conductivity of the composite was increasingly enhanced, leading to a broad development and prospect for the application of these composites in the electricity sector.Conflicts of interest
The author(s) declared no potential conflicts of interest concerning the research, authorship, and publication of this article.Acknowledgements
This work was supported by the Heilongjiang Educational Committee (contract grant number 1511385).Notes and references
- H. G. Wu, J. W. Zhang, C. Zhang, J. X. Feng, M. A. Rahman and E. Baer, Ind. Eng. Chem. Res., 2016, 55, 10947–10954 CrossRef CAS
.
- E. Munoz-Sandoval, A. J. Cortes-Lopez, B. Flores-Gomez, J. I. Fajardo-Díaz, R. Sanchez-Salas and F. Lopez-Urías, Carbon, 2017, 115, 409–421 CrossRef CAS
.
- T. Sharika, J. Abraham, S. C. George, N. Kalarikkal and S. Thomas, Composites, Part B, 2019, 173, 106798 CrossRef CAS
.
- S. Mallakpour and A. Zadehnazari, High Perform. Polym., 2016, 28, 14–25 CrossRef CAS
.
- I. Marriam, F. J. Xu, M. Tebyeterwa, Y. Gao, W. Liu and Y. P. Qiu, Composites, Part A, 2018, 110, 1–10 CrossRef CAS
.
- D. Liu, P. Yang, H. Zhang, M. J. Liu, W. F. Zhang, D. M. Xu and J. Gao, RSC Adv., 2019, 21, 2129–2137 CAS
.
- G. Yi, X. F. Fan, X. Quan, S. Chen and H. T. Yu, Front. Environ. Sci. Eng., 2019, 13, 23 CrossRef
.
- G. Mittal, V. Dhand, K. Y. Rhee, S. J. Park and W. R. Lee, J. Ind. Eng. Chem., 2015, 21, 11–25 CrossRef CAS
.
- Z. Spitalsky, D. Tasis, K. Papagelis and C. Galiotis, Prog. Polym. Sci., 2010, 35, 357–401 CrossRef CAS
.
- A. Ashori, S. Sheshmani and F. Farhani, Carbohydr. Polym., 2013, 92, 865–871 CrossRef CAS
.
- R. Baretta, M. Brcic, M. Canadija, R. Luciano and F. M. Sciarra, Eur. J. Mech. A Solid., 2017, 65, 1–13 CrossRef
.
- S. Gómez, N. M. Rendtorff, E. F. Aglietti, Y. Sakka and G. Suárez, Appl. Surf. Sci., 2016, 379, 264–269 CrossRef
.
- X. L. Xie, Y. W. Mai and X. P. Zhou, Mater. Sci. Eng., B, 2005, 49, 89–112 CrossRef
.
- A. Montazeri, D. Madah and N. K. Shormasti, J. Therm. Anal. Calorim., 2016, 124, 1441–1448 CrossRef CAS
.
- J. Z. Liang, C. Y. Chen and S. Y. Zou, J. Polym. Environ., 2017, 25, 867–874 CrossRef CAS
.
- H. Quan, S. J. Zhang, J. L. Qiao and L. Y. Zhang, Polymer, 2012, 53, 4547–4552 CrossRef CAS
.
- J. C. Gao, Y. F. Shen and C. Li, J. Thermoplast. Compos. Mater., 2017, 30, 241–254 CrossRef CAS
.
- H. K. F. Cheng, N. G. Sahoo, T. H. Khin, L. Li, S. H. Chan and J. H. Zhao, J. Nanosci. Nanotechnol., 2010, 10, 5242–5251 CrossRef CAS
.
- V. Eckert, E. Haubold, S. Michel, C. Bellmann, P. Potapov, D. Wolf, S. Hampel, B. Buchner and M. Mertig, Carbon, 2019, 141, 99–106 CrossRef CAS
.
- H. K. F. Cheng, N. G. Sahoo, Y. P. Tan, Y. Z. Pan, H. Q. Bao, L. Li, S. H. Chan and J. H. Zhao, ACS Appl. Mater. Interfaces, 2012, 4, 2387–2394 CrossRef CAS PubMed
.
- J. N. Coleman, U. Khan, W. J. Blau and Y. K. Gun'ko, Carbon, 2006, 44, 1624–1652 CrossRef CAS
.
- M. T. Byrne and Y. K. Gun'ko, Adv. Mater., 2010, 22, 1672–1688 CrossRef CAS PubMed
.
- R. Andrews, D. Jacques, M. Minot and T. Rantell, Macromol. Mater. Eng., 2002, 287, 395–403 CrossRef CAS
.
- Y. H. Liu and J. L. Gao, Adv. Mater. Res., 2011, 299–300, 798–801 CAS
.
- S. P. Bao and S. C. Tjong, Adv. Mater. Res., 2007, 485, 508–516 Search PubMed
.
- T. Kashiwagi, E. Grulke, J. Hilding, K. Groth, R. Harris, K. Butler, J. Shields and S. Kharchenko, Polymer, 2004, 45, 4227–4239 CrossRef CAS
.
- A. Zadhoush, R. Reyhani and M. Naeimirad, Polym. Compos., 2019, 40, E501–E510 CrossRef CAS
.
- N. G. Sahoo, N. T. Thet, Q. H. Tan, L. Li, S. H. Chan, J. Zhao and S. Yu, Nanosci. Nanotechnol. Lett., 2009, 9, 5910–5919 CAS
.
- V. Khare, S. Srivastava, S. Kamle and G. M. Kamath, Procedia Structural Integrity, 2019, 14, 215–225 CrossRef
.
- D. Das, S. Sethy and B. K. Satapathy, Polym. Eng. Sci., 2018, 58, 1115–1126 CrossRef CAS
.
- P. H. Wang, S. Sarkar, P. Gulgunje, N. Verghese and S. Kumar, Polymer, 2018, 151, 287–298 CrossRef CAS
.
- W. F. Liu, L. Cheng and S. T. Li, Compos. Commun., 2018, 10, 221–225 CrossRef
.
- Y. Pan, H. K. F. Cheng, L. Li, S. H. Chan, J. H. Zhao and Y. K. Juay, J. Polym. Sci., Part B: Polym. Phys., 2010, 48, 2238–2247 CrossRef CAS
.
- Y. Z. Pan, L. Li, S. H. Chan and J. H. Zhao, Composites, Part A, 2010, 41, 419–426 CrossRef
.
- B. X. Yang, J. H. Shi, K. P. Pramod and S. H. Goh, Compos. Sci. Technol., 2008, 68, 2490–2497 CrossRef CAS
.
- S. H. Lee, E. Cho, S. H. Jeon and J. R. Youn, Carbon, 2007, 45, 2810–2822 CrossRef CAS
.
| This journal is © The Royal Society of Chemistry 2019 |

