 Open Access Article
An invisible private 2D barcode design and implementation with tunable fluorescent nanoparticles†
Kunkun Jianga,
Dandan Xua,
Zhongyang Liua,
Weiwei Zhao a,
Hongjun Jia,
Jiaheng Zhang
 a,
Mingyu Lia,
Tingting Zhengb and
Huanhuan Feng
 *a
*a
aFlexible Printed Electronics Technology Center, School of Materials Science and Engineering, Harbin Institute of Technology (Shenzhen), Shenzhen 518055, China. E-mail: fenghuanhuan@hit.edu.cn
bShenzhen Key Laboratory for Drug Addiction and Medication Safety, Peking University Shenzhen Hospital, Shenzhen, China
First published on 14th November 2019
Abstract
The popularity of 2D barcodes is playing a key role in simplifying people's daily life activities, such as identification, quick payment, checking in and checking out, etc. However, relevant issues have emerged as their popularity has soared. The most urgent and representative problem is decryption, which may lead to serious information leakage and substantial damage to organizations, such as governments and international enterprises. This issue is mainly due to the visibility of 2D barcodes. In order to prevent potential privacy violation and sensitive information leakage through easy access of those visible 2D barcodes, we have designed and fabricated invisible 2D barcodes that will only be visible under UV illumination. This approach provides a promising solution to address the previous problem by transferring 2D barcodes into an invisible state. We have employed a typical micro-emulsion method to fabricate polystyrene (PS) fluorescent nanoparticles due to its simplicity. The invisible patterns can and will only be accessed and recognized under UV light illumination to protect personal private information. These invisible 2D barcodes provide a feasible solution for personal information protection and fit with a patient's privacy protection scenario very well, as we have demonstrated.
Introduction
As the popularity of barcodes has spread from Asia to America and Europe,1 people's daily activities have become more dependent on 2D barcodes, such as identification, authentication, login and so on. There are some issues arising with the spreading trend of barcodes, such as information leakage caused by 2D barcode cracking and identity theft caused by forging 2D barcodes. The most obvious approach to address these issues would be to make more complex and sophisticated barcodes. People have tried to cipher information from linear barcodes into complex cryptic notes such as 2D barcodes with a larger capacity of data storage.2 2D barcodes are easy to access and recognize via using various fluorescent materials. Colourful 2D barcodes' storage and encryption capabilities are increasing compared to binary barcodes,3,4 but they still need to overcome information leakage due to encryption algorithm cracking.5Polymer-based fluorescent materials are a great candidate for bio-labelling and imaging and have attracted great attention due to their tunable optical,6–11 and chemical properties, durability12 and functionalization.13–15 The fluorescent dye not only enables the capability of optical imaging, diagnosis and treatment16–18 but also offers a platform for information storage and encoding.19–25 The encoding can be obtained through spectrum reading of the peak location and intensity.26 The bio-inertness of polymer bulk offers biocompatibility and the capability of encapsulating some thermal/oxygenic sensitive materials to preserve their optical properties,27,28 chemical stability29–32 and low cytotoxicity.33,34 Inorganic nanoparticles also contribute a lot in this area due to their outstanding optical properties.8,10,23,35–38 Quantum dot-doped nano-polymers have been used to print banknotes, watermarks and other valuable documents to prevent counterfeiting due to their specific fluorescence emission under fixed excitation.23,35
Similar anti-forgery barcodes can be fabricated for data encryption.39,40 The use of quantum dots suffers from chemical instability and cytotoxicity.36–38 Xu's group has used up-converting nanoparticles (UCNPs) to produce high-resolution anti-counterfeiting patterns.8 Furthermore, they fabricated a drug capsule with multi-layered colourful UCNPs for drug identification and anticounterfeiting.10 The UCNPs offer a triggerable UV light source for the excitation of doped dyes. The invisibility of information bar codes greatly enhances the security and anti-counterfeiting capabilities of information. Thomas et al. have created a non-clonal anti-counterfeiting label for an optical authentication system by adding a layer of microscopic particles to the quick response (QR) codes to form unique patterns.41,42 Stanley May et al. have demonstrated covert QR codes via lanthanide-doped nanoparticles.43 These composite inks developed with up-converting particles are invisible under ambient light and become visible under infrared excitation (980 nm).43,44 However, the extra heat effect is a potential hazard in dealing with these UCNP-based systems.
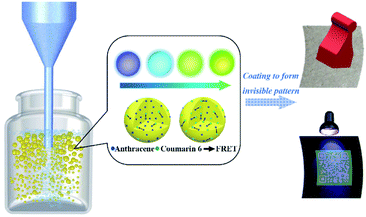
There is still some space to explore and study the implementation of encryption and encoding in the light of previous work. Here we present an approach to produce PS fluorescent nanoparticles using the classical micro-emulsion method to address the decryption issue of current popular visible 2D barcodes. The PS fluorescent nanoparticles are fabricated via a traditional micro-emulsion method. The emission can be tuned via adjusting the mass fraction of the doped fluorescent dyes (Anthracene and Coumarin 6) to match the substrate, such that they become invisible. These nanoparticles are condensed and printed onto non-fluorescent paper to design 2D barcode patterns. These 2D barcodes are invisible under daylight and become visible under UV light excitation (365 nm). We build a patient identification and registration system to verify and confirm their feasibility. The whole system works quite well in preliminary testing. The main procedure is presented in Fig. 1. We sincerely believe that this system is a very promising and competitive key player for building safer and more secure barcode systems.
Experimental
Materials
Polystyrene (PS) (Mw 30![[thin space (1/6-em)]](https://www.rsc.org/images/entities/char_2009.gif) 000–40
000–40![[thin space (1/6-em)]](https://www.rsc.org/images/entities/char_2009.gif) 000), anthracene, coumarin 6, sodium dodecyl sulfate (SDS) and toluene were used. All chemical agents were purchased from Sigma-Aldrich and used without further purification.
000), anthracene, coumarin 6, sodium dodecyl sulfate (SDS) and toluene were used. All chemical agents were purchased from Sigma-Aldrich and used without further purification.
Instruments
Scanning electron microscopy (SEM) was performed on a SEM S4700 and Gemini SEM 300. SEM was used to characterize the morphology of the polystyrene particles and fluorescent polystyrene particles. The nanoparticle size and size distribution were measured by Dynamic Light Scattering (DLS) using a Malvern Zetasizer Nano ZS 90. The samples' fluorescence spectra were obtained by a fluorescence spectrophotometer (RF 5301, Thermo-Fisher). The samples' solid-state fluorescence spectra were checked by a fluorescence spectrophotometer (F-7000). Nanoparticle dispersion was completed by using an Ultrasonic Cell Pulverizer (JY92-IIDN). The power is 10% and the probe diameter is 6 mm. Each sample was cycled three times for 1 minute each time. The fluorescence of the nanoparticles was characterized by a Confocal Laser Scanning Microscope (CLSM) (Zeiss 710). The samples' fluorescence lifetimes were measured by a fluorescence lifetime spectrometer (Quantaurus-Tau C11367).Fabrication of polystyrene nanoparticles
The fluorescent nanoparticles are fabricated via a modified micro-emulsion method. The emulsifying force is offered by a sonication probe (6 mm) with 10% sonicating power, whose full load power is 700 W. The dispersed phase is toluene (2 mL) with 1% polystyrene and the aqueous phase is water (14 mL) with stabilizer SDS. The SDS concentrations were tuned from 0.001 mg mL−1, to 0.01 mg mL−1, 0.1 mg mL−1, 0.5 mg mL−1, 1 mg mL−1, 5 mg mL−1, 10 mg mL−1 and 20 mg mL−1. The sample was stirred at 300 rpm for 1 hour. The ultrasound in the pulse model was set to pulse mode, which means ultrasonication for 1 second and rest for 1 second. The total sonication time is 1 minute. The entire process is repeated 5 times to minimize the size distribution. The emulsified emulsion is magnetically stirred at 300 rpm for 48 hours in a fume hood to evaporate all remaining toluene. The nanoparticle size distribution and morphology were characterized by DLS and SEM.Fabrication of fluorescent polystyrene nanoparticles
Fluorescence properties can be induced by loading fluorescent dye into the dispersed phase at the very beginning together with the PS dissolution process. In the fabrication of fluorescent nanoparticles, the initial steps are the same besides the fact that the fluorescent dye should already be dissolved in the toluene.Pattern formation
The fluorescent nanoparticle ink was printed on non-fluorescent paper to form specific patterns.Results and discussion
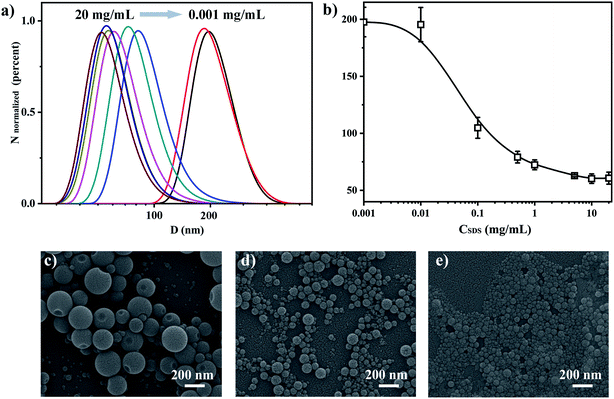
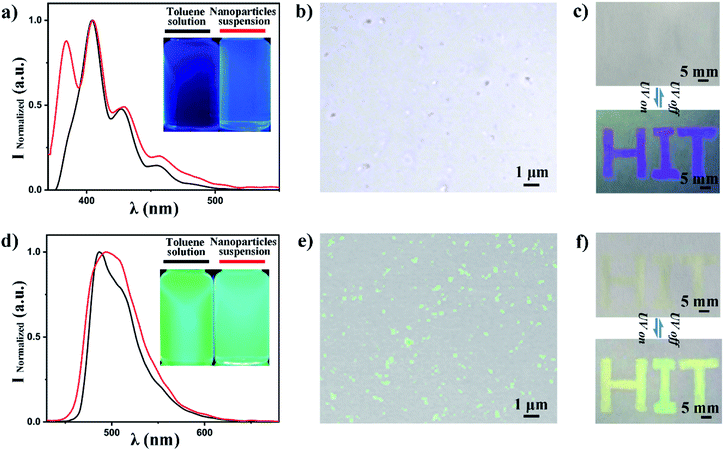
We have fabricated PS nanoparticles using a micro-emulsion method by varying the concentration of SDS to tune the particle size. The particles size distribution and mean value were characterized by DLS as a function of SDS concentration. The size decreases from 200 nm to 60 nm (in diameter) when the SDS concentration increases from 0.001 mg mL−1 to 20 mg mL−1 as shown in Fig. 2a. The size remains constant when the SDS concentration is over 10 mg mL−1. This is reasonable and expected since it is SDS's critical micelle concentration (CMC).45,46 The particle size and distribution do not change much after SDS reached its CMC because the surface tension will not decrease anymore after it reaches its lowest value.47 The size distribution becomes narrower as the SDS concentration increases, as we can see from Fig. 2b. The mean size fluctuation (the error bar of the y-axis) becomes smaller when the SDS concentration increases. SEM shows that the particles are spherical and their size decreases as the SDS concentration increases as shown in the further particle morphology study and size estimation in Fig. 2c–e. Fig. 2c is an SEM image of particles emulsified with an SDS concentration of 0.01 mg mL−1. The size range is around 100–300 nm. This matched with the mean size value (200 nm) from DLS. Fig. 2d and e further confirmed that the size decreased as the SDS concentration increased to 0.1 mg mL−1 and 5 mg mL−1. The bubble problem could arise if we increase the SDS concentration too much. Therefore, we choose an SDS concentration of 5 mg mL−1 to balance the nanoparticle size distribution and bubble generation problem for particle fabrication.The fluorescent dye can be loaded into the nanoparticles via dissolving it into toluene. We choose anthracene and coumarin 6 to dissolve into toluene, respectively. The fluorescence spectra of these two samples are shown in Fig. 3a and d. We also checked the fluorescence spectrum for each fluorescent dye in the ‘free state’ (dissolved in solution) and ‘frozen state’ (loaded into polymer nanoparticles) for spectrum verification. The peak emission wavelength is around 405 nm for anthracene both in toluene solution and in PS nanoparticles (Fig. 3a). The peak emission wavelength is around 490 nm for coumarin 6 both in toluene solution and in PS nanoparticles (Fig. 3d). The photos in the right upper corner are corresponding samples under UV light illumination (wavelength 365 nm). These results indicate that anthracene and coumarin 6 are both environmentally independent during fluorescence emission. We used confocal microscopy to confirm that the fluorescence emission is indeed from the fabricated fluorescent nanoparticles. The results are presented in Fig. 3b and e. It is clear that the anthracene and coumarin 6 fluorescent nanoparticles emit blue and green fluorescence in their corresponding channels, respectively. The excitation and emission spectra of anthracene and coumarin 6 are presented in Fig. S1.† The images under split channels are shown in Fig. S2.†
A sample visibility-switching test is performed by checking the visibility of the printed letters “HIT” as shown in Fig. 3c and f. The anthracene-doped nanoparticles are invisible under daylight and visible with UV excitation. The only defect is that the pattern is not bright enough for quick recognition. On the contrary, the coumarin 6-doped nanoparticles' emission is very bright. It is so bright that it could easily be seen under daylight too.
We decided to tune the spectrum to get a better invisible and accessible performance via Föster Resonance Energy Transfer (FRET). The total dye mass fraction is fixed at 0.001 wt%. The mass ratio of anthracene was decreased from 99% to 55% while the mass ratio of coumarin 6 was increased from 1% to 45%, correspondingly. The details of the S1 samples are given in Table 1. The non-fluorescent substrate optimization details can be found in S3 and S4. The ratios of molarity calculation can be checked in the ESI.†
| Sample | S1_1 | S1_2 | S1_3 | S1_4 | S1_5 | S1_6 | S1_7 | S1_8 | S1_9 | S1_10 |
|---|---|---|---|---|---|---|---|---|---|---|
| Mass ratio (%) | 99![[thin space (1/6-em)]](https://www.rsc.org/images/entities/char_2009.gif) : :![[thin space (1/6-em)]](https://www.rsc.org/images/entities/char_2009.gif) 1 1 |
95![[thin space (1/6-em)]](https://www.rsc.org/images/entities/char_2009.gif) : :![[thin space (1/6-em)]](https://www.rsc.org/images/entities/char_2009.gif) 5 5 |
90![[thin space (1/6-em)]](https://www.rsc.org/images/entities/char_2009.gif) : :![[thin space (1/6-em)]](https://www.rsc.org/images/entities/char_2009.gif) 10 10 |
85![[thin space (1/6-em)]](https://www.rsc.org/images/entities/char_2009.gif) : :![[thin space (1/6-em)]](https://www.rsc.org/images/entities/char_2009.gif) 15 15 |
80![[thin space (1/6-em)]](https://www.rsc.org/images/entities/char_2009.gif) : :![[thin space (1/6-em)]](https://www.rsc.org/images/entities/char_2009.gif) 20 20 |
75![[thin space (1/6-em)]](https://www.rsc.org/images/entities/char_2009.gif) : :![[thin space (1/6-em)]](https://www.rsc.org/images/entities/char_2009.gif) 25 25 |
70![[thin space (1/6-em)]](https://www.rsc.org/images/entities/char_2009.gif) : :![[thin space (1/6-em)]](https://www.rsc.org/images/entities/char_2009.gif) 30 30 |
65![[thin space (1/6-em)]](https://www.rsc.org/images/entities/char_2009.gif) : :![[thin space (1/6-em)]](https://www.rsc.org/images/entities/char_2009.gif) 35 35 |
60![[thin space (1/6-em)]](https://www.rsc.org/images/entities/char_2009.gif) : :![[thin space (1/6-em)]](https://www.rsc.org/images/entities/char_2009.gif) 40 40 |
55![[thin space (1/6-em)]](https://www.rsc.org/images/entities/char_2009.gif) : :![[thin space (1/6-em)]](https://www.rsc.org/images/entities/char_2009.gif) 45 45 |
| Ratios of molarity (molar ratio) | 975![[thin space (1/6-em)]](https://www.rsc.org/images/entities/char_2009.gif) : :![[thin space (1/6-em)]](https://www.rsc.org/images/entities/char_2009.gif) 5 5 |
187![[thin space (1/6-em)]](https://www.rsc.org/images/entities/char_2009.gif) : :![[thin space (1/6-em)]](https://www.rsc.org/images/entities/char_2009.gif) 5 5 |
90![[thin space (1/6-em)]](https://www.rsc.org/images/entities/char_2009.gif) : :![[thin space (1/6-em)]](https://www.rsc.org/images/entities/char_2009.gif) 5 5 |
56![[thin space (1/6-em)]](https://www.rsc.org/images/entities/char_2009.gif) : :![[thin space (1/6-em)]](https://www.rsc.org/images/entities/char_2009.gif) 5 5 |
40![[thin space (1/6-em)]](https://www.rsc.org/images/entities/char_2009.gif) : :![[thin space (1/6-em)]](https://www.rsc.org/images/entities/char_2009.gif) 5 5 |
30![[thin space (1/6-em)]](https://www.rsc.org/images/entities/char_2009.gif) : :![[thin space (1/6-em)]](https://www.rsc.org/images/entities/char_2009.gif) 5 5 |
28![[thin space (1/6-em)]](https://www.rsc.org/images/entities/char_2009.gif) : :![[thin space (1/6-em)]](https://www.rsc.org/images/entities/char_2009.gif) 5 5 |
18![[thin space (1/6-em)]](https://www.rsc.org/images/entities/char_2009.gif) : :![[thin space (1/6-em)]](https://www.rsc.org/images/entities/char_2009.gif) 5 5 |
15![[thin space (1/6-em)]](https://www.rsc.org/images/entities/char_2009.gif) : :![[thin space (1/6-em)]](https://www.rsc.org/images/entities/char_2009.gif) 5 5 |
12![[thin space (1/6-em)]](https://www.rsc.org/images/entities/char_2009.gif) : :![[thin space (1/6-em)]](https://www.rsc.org/images/entities/char_2009.gif) 5 5 |
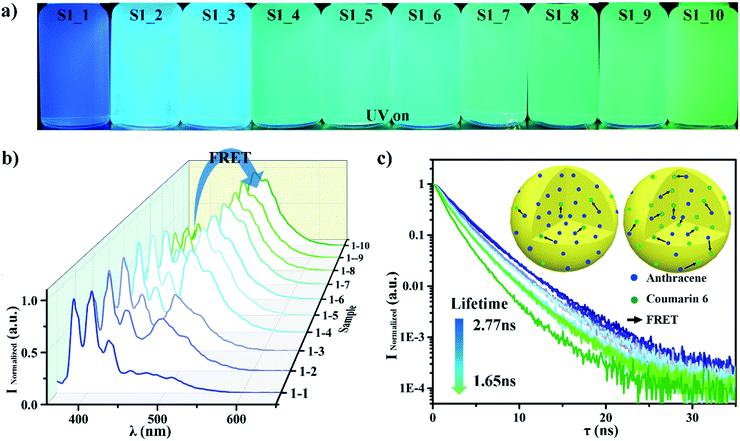
The S1 sample characterizations are shown in Fig. 4. It is clear that the samples' colour changed from blue to green as the coumarin 6 content increased from 1% to 45%, as Fig. 4a shows. The fluorescence spectra of the S1 samples also showed the same trend in Fig. 4b. It is quite obvious that there are two peaks (blue peak wavelength 405 nm and green peak wavelength 490 nm) which response to anthracene and coumarin 6, respectively. The blue peak's intensity is decreased from 1 to 0.1 as the anthracene mass ratio decreases from 99% to 55%. On the contrary, the green peak's intensity is increased from 0.10 to 1 when the coumarin 6 mass ratio increases from 1% to 45%. The peak intensity variations are much bigger than the fluorescent dye's mass ratio variation. The extra variation is due to FRET between anthracene and coumarin 6. In order to characterize the FRET efficiency between these two dyes, we have measured the lifetime48,49 of the Anthracene donor for all samples as shown in Fig. 4c. The apparent lifetime τDA dropped from 2.77 ns to 1.65 ns. This is because the donor Anthracene can transfer its energy to Coumarin 6 via FRET, which will shorten its lifetime. This means that the FRET efficiency increases as the coumarin 6 content increases. A schematic picture of this process is given in Fig. 4c, upper-right corner. The blue dots represent anthracene while the green dots represent coumarin 6. The black arrow is the energy transferring via FRET. It is clear and obvious that the black arrows increase when the receptor (coumarin 6) concentration increases, which means that the system's FRET efficiency increases.50,51
There are several ways to calculate FRET efficiency.50,52,53 One is based on fluorescence peak intensity variation. ID is the peak fluorescence intensity of the donor (which is anthracene in our case). IDA is the peak fluorescence intensity of the acceptor, while A means apparent. The formula is given in eqn (1).
 | (1) |
Another way to calculate FRET efficiency is based on the donors' lifetime change. The formula is given in eqn (2). τD is the mean fluorescence lifetime of the donor (which is anthracene in our case). τDA is the mean fluorescence lifetime of the donor in the presence of the acceptor, while A means apparent.48,49
 | (2) |
We have calculated the FRET efficiency by using these two methods. The FRET efficiency increased from 0.607 to 0.982 when the coumarin 6 mass fraction increased from 1% to 45% as shown in Table S1.† In Table S2,† the FRET efficiency increased from 0.001 to 0.406 when the coumarin 6 mass fraction increased from 1% to 45%. The details can be checked in Table S1 and S2.† The similar trend from these two approaches confirms that anthracene transferred more energy to coumarin 6 via FRET.
Samples of S1_4 to S1_10 are printed on non-fluorescent paper to investigate their display properties. Samples of S1_1 to S1_3 showed good optical properties despite their low emission intensity. We chose an optimized dye ratio (anthracene is 99% and coumarin 6 is 1%) for emission optimization in consideration of the FRET effect. We tried to increase the mass fraction of the mixed dyes to increase the fluorescence intensity by increasing the total dye content from 0.001% to 0.1%, as shown in Table 2.
| Sample | S2_1 | S2_2 | S2_3 | S2_4 |
|---|---|---|---|---|
The mass ratios of anthracene![[thin space (1/6-em)]](https://www.rsc.org/images/entities/char_2009.gif) : :![[thin space (1/6-em)]](https://www.rsc.org/images/entities/char_2009.gif) coumarin 6, 99 coumarin 6, 99![[thin space (1/6-em)]](https://www.rsc.org/images/entities/char_2009.gif) : :![[thin space (1/6-em)]](https://www.rsc.org/images/entities/char_2009.gif) 1 1 |
Dye 0.001 wt% | Dye 0.01 wt% | Dye 0.05 wt% | Dye 0.1 wt% |
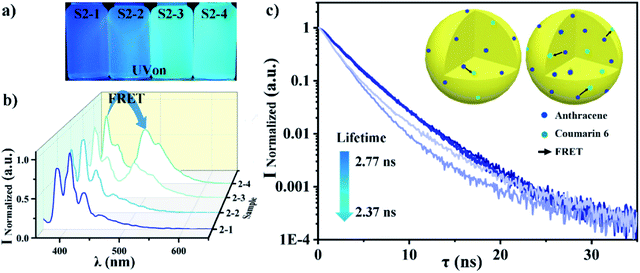
The S2 sample characterization is shown in Fig. 5. It is clear that the samples' colour changes from blue to green as the total dye concentration increases from 0.001% to 0.1%, as shown in Fig. 5a. The blue peak decreased a little bit, while the green peak increased from 0.1 to almost 0.8 in the fluorescence spectrum as shown in Fig. 5b. The peak variations are totally due to the distant proximity54 of enhanced FRET between anthracene and coumarin 6.
The S2 sample lifetimes were measured as shown in Fig. 5c and their FRET efficiency was calculated via the previous two methods. The FRET efficiency increased from 0.582 to 0.902 as the total dye concentration increased when we calculated it via the peak intensity method. The FRET efficiency increased from 0.001 to 0.109 as the total dye concentration increased when we calculated it via the lifetime method. The details are listed in Table S3 and S4.†
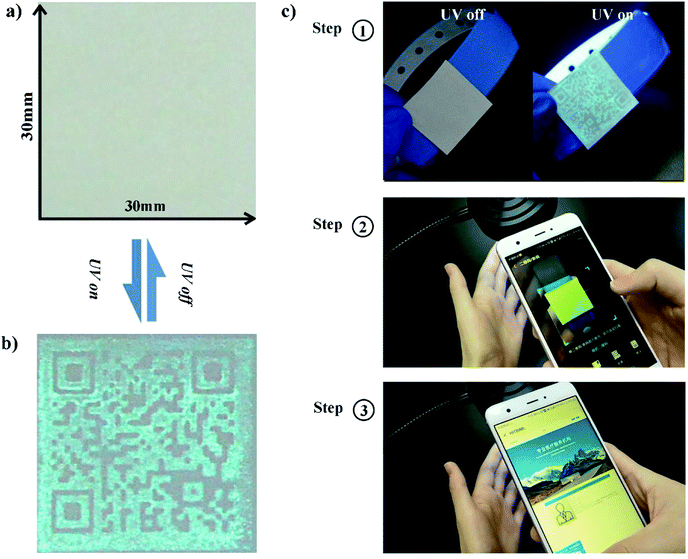
Sample S2_4 shows a good invisibility on non-fluorescent paper and good visibility under UV excitation. Therefore, we choose sample S2_4 to do the visibility-switching test. The composition of the printed ink is as follows. Glycerol is mixed with 15% fluorescent nanoparticles, centrifuged and dried to form a high viscosity mixture and then printed on non-fluorescent paper. The 2D barcode can be used to encrypt private information. The visibility-switching test results are presented in Fig. 6. The barcode is invisible and becomes visible due to UV excitation, and it passes the invisible exam part perfectly. It shows good protection of private information and good accessibility under UV excitation. It can therefore be used for invisible barcode material fabrication due to its wide and fine operational window.39 In Fig. 6c, we demonstrate that the barcode can be linked to a hospital database, and used to show the related patient information, such as name, gender, age and history of diagnosis and therapy, via a mobile phone. This can avoid undesirable glances without UV lamp excitation. Malicious observation of the information can only be done with UV lamp excitation due to the necessity of UV excitation. These invisible labelled bars can be easily transported on a patient wristband and used to protect privacy.
A prototype of an invisible patient wristband tested in real scenarios is presented in Video S1 and S2.† Video S1† shows the invisibility of the 2D barcodes without UV excitation. This system works fine under UV excitation, as we demonstrate in Video S2.† We further sealed these 2D invisible barcodes with transparent PS film to enhance their durability and anti-scratching properties. The sealed samples can be accessed and recognized easily as presented in Fig. S5 and Video S3.† The sealed sample's florescence emission intensity is almost the same after two months, as shown in Video S4.† The sample without sealing treatment became very blurred and its fluorescence emission intensity was quite weak after two months. The sealing treatment enhanced the samples' durability a lot, as we expected.
Conclusions
In summary, we have fabricated tunable fluorescent polystyrene nanoparticles by the classical micro-emulsion method to address the security issues of current 2D barcodes, such as information leakage and decryption due to their visibility. The particle size and emission spectrum can be tuned to fit with various situations of all possible application cases. The fluorescent nanoparticles are formed into a printable ink to be printed as an encrypted invisible 2D barcode pattern for identification and registration in bio-medical applications. These invisible 2D barcode tags can be recognized in less than 1 second under UV light. The whole tag can be sealed by a plastic film to enhance its durability, remaining stable for at least two months. The plastic sealing also offers good protection against humidity and scratching in practical applications. We have further demonstrated the use of the barcodes for patient identification and registration in hospital identification systems. Our prototype of a private patient wristband demonstrates a good adaptability in the case of patient privacy protection and shows very promising prospects in this area of application.Conflicts of interest
There are no conflicts to declare.Acknowledgements
This work was financially supported by Shenzhen Science and Technology Innovation Commission [JCYJ20170811160129498] and [JCYJ20180507183224565], Shenzhen Peacock Innovation Project (KQJSCX20170726104623185), China Postdoctoral Science Foundation (No. 2018M640807), the Natural Science Foundation of Guangdong Province (No. 2018A0303130228) and the Natural Science Foundation of China (No. 21863008).Notes and references
- K. Peng, et al., Security overview of QR codes, Student project in the MIT course 6, 2014, 14 Search PubMed.
- D. Parikh and G. Jancke, Localization and Segmentation of A 2D High Capacity Color Barcode, 2008 IEEE Workshop on Applications of Computer Vision, 2008 Search PubMed.
- R. A. John and K. Raahemifar, in 2015 Ieee 28th Canadian Conference on Electrical and Computer Engineering, IEEE, 2015, pp. 297–301 Search PubMed.
- R. Villan, S. Voloshynovskiy, O. Koval and T. Pun, in Security, Steganography, and Watermarking of Multimedia Contents VII, ed. E. J. Delp and P. W. Wong, 2005, vol. 5681, pp. 453–464 Search PubMed.
- O. Bulan and G. Sharma, IEEE Trans. Image Process., 2011, 20, 1337–1350 Search PubMed.
- L. Brannon-Peppas and J. O. Blanchette, Adv. Drug Delivery Rev., 2004, 56, 1649–1659 CrossRef CAS PubMed.
- Y. Zhao, Z. Xie, H. Gu, C. Zhu and Z. Gu, Chem. Soc. Rev., 2012, 41, 3297–3317 RSC.
- M. You, J. Zhong, Y. Hong, Z. Duan, M. Lin and F. Xu, Nanoscale, 2015, 7, 4423–4431 RSC.
- X. Ji, R.-T. Wu, L. Long, X.-S. Ke, C. Guo, Y.-J. Ghang, V. M. Lynch, F. Huang and J. L. Sessler, Adv. Mater., 2018, 30, 1705480 CrossRef.
- M. You, M. Lin, S. Wang, X. Wang, G. Zhang, Y. Hong, Y. Dong, G. Jin and F. Xu, Nanoscale, 2016, 8, 10096–10104 RSC.
- Y. Ji, H. Wang, L. Xiang, X. Liu, W. Wei, N. Ma and D. Sun, J. Mater. Sci., 2018, 34, 942–948 Search PubMed.
- K. Chang, Z. Liu, H. Chen, L. Sheng, S. X.-A. Zhang, D. T. Chiu, S. Yin, C. Wu and W. Qin, Small, 2014, 10, 4270–4275 CAS.
- C. Loos, T. Syrovets, A. Musyanovych, V. Mailaender, K. Landfester, G. U. Nienhaus and T. Simmet, Beilstein J. Nanotechnol., 2014, 5, 2403–2412 CrossRef PubMed.
- A. Vollrath, S. Schubert and U. S. Schubert, J. Mater. Chem. B, 2013, 1, 1994–2007 RSC.
- O. S. Wolfbeis, Chem. Soc. Rev., 2015, 44, 4743–4768 RSC.
- M. Humar, A. Dobravec, X. Zhao and S. H. Yun, Optica, 2017, 4, 1080–1085 CrossRef CAS.
- C. Meindl, K. Oehlinger, J. Ober, E. Roblegg and E. Froehlich, Toxicology, 2017, 378, 25–36 CrossRef PubMed.
- J.-B. Qu, S.-H. Li, Y.-L. Xu, Y. Liu and J.-G. Liu, Sens. Actuators, B, 2018, 272, 127–134 CrossRef CAS.
- J. J. Agresti, E. Antipov, A. R. Abate, K. Ahn, A. C. Rowat, J.-C. Baret, M. Marquez, A. M. Klibanov, A. D. Griffiths and D. A. Weitz, Proc. Natl. Acad. Sci. U. S. A., 2010, 107, 4004–4009 CrossRef CAS.
- A. M. Klein, L. Mazutis, I. Akartuna, N. Tallapragada, A. Veres, V. Li, L. Peshkin, D. A. Weitz and M. W. Kirschner, Cell, 2015, 161, 1187–1201 CrossRef CAS PubMed.
- Y. Leng, K. Sun, X. Chen and W. Li, Chem. Soc. Rev., 2015, 44, 5552–5595 RSC.
- Y. Zhao, W. Chen, C. Peng, L. Liu, F. Xue, S. Zhu, H. Kuang and C. Xu, J. Colloid Interface Sci., 2010, 352, 337–342 CrossRef CAS PubMed.
- M. Wang, B. Duong, H. Fenniri and M. Su, Nanoscale, 2015, 7, 11240–11247 RSC.
- J. Du, R. Yang, C. Fang, X. Zhou, S. Pan, W. Lei, J. Su, Y. Cheng and D. Liu, J. Mater. Sci., 2018, 34, 2218–2224 Search PubMed.
- X. Zhou, Y. Li, C. Fang, S. Li, Y. Cheng, W. Lei and X. Meng, J. Mater. Sci., 2015, 31, 708–722 CAS.
- D. V. Roberts, B. P. Wittmershaus, Y. Z. Zhang, S. Swan and M. P. Klinosky, J. Lumin., 1998, 79, 225–231 CrossRef CAS.
- K. Li and B. Liu, Chem. Soc. Rev., 2014, 43, 6570–6597 RSC.
- S. Lu, K. Zhu, W. Song, G. Song, D. Chen, T. Hayat, N. S. Alharbi, C. Chen and Y. Sun, Sci. Total Environ., 2018, 630, 951–959 CrossRef CAS PubMed.
- O. Zupke, E. Distler, D. Baumann, D. Strand, R. G. Meyer, K. Landfester, W. Herr and V. Mailander, Biomaterials, 2010, 31, 7086–7095 CrossRef CAS PubMed.
- R. Sauer, A. Turshatov, S. Baluschev and K. Landfester, Macromolecules, 2012, 45, 3787–3796 CrossRef CAS.
- C. Grazon, J. Rieger, R. Meallet-Renault, G. Clavier and B. Charleux, Macromol. Rapid Commun., 2011, 32, 699–705 CrossRef CAS PubMed.
- J. A. Chen, P. S. Zhang, G. Fang, P. G. Yi, X. Y. Yu, X. F. Li, F. Zeng and S. Z. Wu, J. Phys. Chem. B, 2011, 115, 3354–3362 CrossRef CAS PubMed.
- B. Kong, J. H. Seog, L. M. Graham and S. B. Lee, Nanomedicine, 2011, 6, 929–941 CrossRef CAS PubMed.
- L. Landgraf, D. Nordmeyer, P. Schmiel, Q. Gao, S. Ritz, J. S. Gebauer, S. Graß, S. Diabaté, L. Treuel, C. Graf, E. Rühl, K. Landfester, V. Mailänder, C. Weiss, R. Zellner and I. Hilger, Sci. Rep., 2017, 7, 4341 CrossRef PubMed.
- M. Mille, J.-F. Lamere, F. Rodrigues and S. Fery-Forgues, Langmuir, 2008, 24, 2671–2679 CrossRef CAS PubMed.
- L. Bian, H. Shi, X. Wang, K. Ling, H. Ma, M. Li, Z. Cheng, C. Ma, S. Cai, Q. Wu, N. Gan, X. Xu, Z. An and W. Huang, J. Am. Chem. Soc., 2018, 140, 10734–10739 CrossRef CAS PubMed.
- T. Pinkert, D. Furkert, T. Korte, A. Herrmann and C. Arenz, Angew. Chem., Int. Ed., 2017, 56, 2790–2794 CrossRef CAS PubMed.
- M. Lin, Y. Zhao, S. Wang, M. Liu, Z. Duan, Y. Chen, F. Li, F. Xu and T. Lu, Biotechnol. Adv., 2012, 30, 1551–1561 CrossRef CAS PubMed.
- K. Kamijo, N. Kamijo and Z. Gang, in 2008 15th Ieee International Conference on Image Processing, IEEE, vol. 1–5, 2008, pp. 2036–2039, DOI:10.1109/icip.2008.4712185.
- C. Chen, P. Zhang, G. Gao, D. Gao, Y. Yang, H. Liu, Y. Wang, P. Gong and L. Cai, Adv. Mater., 2014, 26, 6313–6317 CrossRef CAS.
- R. Arppe and T. J. Sorensen, Nat. Rev. Chem., 2017, 1, 0031 CrossRef CAS.
- R. Arppe-Tabbara, M. Tabbara and T. J. Sorensen, ACS Appl. Mater. Interfaces, 2019, 11, 6475–6482 CrossRef CAS PubMed.
- J. M. Meruga, W. M. Cross, P. S. May, Q. Luu, G. A. Crawford and J. J. Kellar, Nanotechnology, 2012, 23, 417–438 CrossRef PubMed.
- T. Blumenthal, J. Meruga, P. S. May, J. Kellar, W. Cross, K. Ankireddy, S. Vunnam and Q. N. Luu, Nanotechnology, 2012, 23, 185305 CrossRef PubMed.
- W. Brown and J. X. Zhao, Macromolecules, 1993, 26, 2711–2715 CrossRef CAS.
- Y. Moroi, K. Motomura and R. Matuura, J. Colloid Interface Sci., 1974, 46, 111–117 CrossRef CAS.
- J. P. Rao and K. E. Geckeler, Prog. Polym. Sci., 2011, 36, 887–913 CrossRef CAS.
- A. Hoppe, K. Christensen and J. A. Swanson, Biophys. J., 2002, 83, 3652–3664 CrossRef CAS PubMed.
- M. Tramier, I. Gautier, T. Piolot, S. Ravalet, K. Kemnitz, J. Coppey, C. Durieux, V. Mignotte and M. Coppey-Moisan, Biophys. J., 2002, 83, 3570–3577 CrossRef CAS PubMed.
- T. Ha, T. Enderle, D. F. Ogletree, D. S. Chemla, P. R. Selvin and S. Weiss, Proc. Natl. Acad. Sci. U. S. A., 1996, 93, 6264–6268 CrossRef CAS PubMed.
- Q. Su, W. Feng, D. Yang and F. Li, Acc. Chem. Res., 2017, 50, 32–40 CrossRef CAS.
- P. G. Wu and L. Brand, Anal. Biochem., 1994, 218, 1–13 CrossRef CAS PubMed.
- R. M. Clegg, Lab. Tech. Biochem. Mol. Biol., 2009, 33, 1–57 Search PubMed.
- L. S. He, D. P. Olson, X. L. Wu, T. S. Karpova, J. G. McNally and P. E. Lipsky, Cytometry, Part A, 2003, 55, 71–85 CrossRef.
Footnote |
| † Electronic supplementary information (ESI) available. See DOI: 10.1039/c9ra05774a |
| This journal is © The Royal Society of Chemistry 2019 |

