 Open Access Article
Au-based bimetallic catalysts: how the synergy between two metals affects their catalytic activity†
Jin Sha,
Sébastien Paul,
Franck Dumeignil and
Robert Wojcieszak
 *
*
Univ. Lille, CNRS, Centrale Lille, ENSCL, Univ. Artois, UMR 8181 – UCCS – Unité de Catalyse et Chimie Du Solide, F-59000 Lille, France. E-mail: robert.wojcieszak@univ-lille.fr
First published on 20th September 2019
Abstract
Supported bimetallic nanoparticles are particularly attractive catalysts due to increased activity and stability compared to their monometallic counterparts. In this work, gold-based catalysts have been studied as catalysts for the selective base-free oxidation of glucose. TiO2-supported Au–Pd and Au–Cu series prepared by the sol-immobilization and precipitation-reduction methods, respectively, showed a significant synergistic effect, particularly when the theoretical weight ratio of the two metals was close to 1![[thin space (1/6-em)]](https://www.rsc.org/images/entities/char_2009.gif) :
:![[thin space (1/6-em)]](https://www.rsc.org/images/entities/char_2009.gif) 1 (with an actual experimental bulk Au/Pd molar ratio of ca. 0.8 and ca. 0.4 for Au/Cu) in both cases. XPS analysis showed that the presence of Auδ+, Pd2+ and CuOH species played an important role in the base-free glucose oxidation.
1 (with an actual experimental bulk Au/Pd molar ratio of ca. 0.8 and ca. 0.4 for Au/Cu) in both cases. XPS analysis showed that the presence of Auδ+, Pd2+ and CuOH species played an important role in the base-free glucose oxidation.
Introduction
Since Haruta and Hutchings discovered the peculiarity of gold-based catalysts in CO oxidation and ethylene hydrochlorination in the 80's, this metal has reached a very special status in the field of catalysis.1,2 Actually, the use of gold-based catalysts has tremendously expanded. It is now, e.g., widely used in vinyl acetate monomer synthesis, in the direct synthesis of hydrogen peroxide from H2 and O2, and in the oxidation of a variety of hydrocarbons and alcohols.3 However, gold-based catalytic systems were always affected by a high variation of their catalytic properties depending on the preparation method employed, which is also related to the kind of support used. In fact, many studies stated the importance of the preparation conditions in determining the morphology of the gold particles and the type of metal-support interactions, both being able to profoundly modify the activity and/or the selectivity of the catalyst. For this reason, a lot of attention has been paid to the preparation of gold catalysts in order to assess as much as possible the relation between support/preparation method and the characteristics of the produced catalytic materials.4,5Unlike Pt or Pd, Au-based catalysts showed very good selectivity to desired products and high resistance to O2-poisoning when molecular oxygen is used as the oxidant. However, gold-based catalysts often showed low activity compared to Pt or Pd-based catalysts, and are often suitable for alcohol oxidation only in alkaline conditions. However, bimetallic systems could overpass such limitations, combining the properties associated with the two constituting metals. There was a great enhancement of catalytic properties in many reactions when combining gold with other metals to form new active sites induced by synergistic effects.1,2,6–9 While in the case of monometallic gold catalysts, the activity is mainly influenced by the particle size and the nature of the support, in the case of bimetallic catalysts they are secondary factors of importance.10,11
To enhance catalytic activity and selectivity in carbohydrates oxidation under non-controlled pH conditions, several combinations of gold with one or more other metals have been reported.12,13 Among various Au–Me combinations, oxidation of glucose using Au–Pd catalyst gave better conversions than monometallic gold at 60 °C. The advantage of the addition of a second metal was clearly shown when working in an acidic medium. However, Comotti et al.14 showed that Pt exhibit a better selectivity to gluconic acid compared to Pd, when only this acid is produced. Moreover, some works showed that higher catalytic activity could be obtained in the presence of an Ag–Au core–shell structure. It is due to the specific structure of such bimetallic catalysts, which permits an easy transfer of charges between the core and the shell leading to oxygen activation. In this case, the best catalytic activity was obtained for a 20% Ag and 80% Au mixture. In addition to bimetallic nanoparticles, the use of trimetallic systems was also reported. One of the examples is the Au–Pt–Ag catalyst. The highest TOFs were observed with a mass ratio of 70/20/10.15 Recently, the Hutchings's group16 studied different gold-based bimetallic catalysts for the oxidation of carbohydrates (mono and dicarbohydrates). As a general conclusion, they found that the preparation method is a crucial parameter that governs the catalytic activity of supported Au catalysts in acidic medium. The catalytic results obtained for gold-based systems confirmed that the presence of multiple metals has a positive effect on activity and selectivity. A simple change in the metal-to-metal weight ratio enables fine-tuning the catalytic activity.17
Actually, the arrangement between gold and the other metal atoms plays the most important role in determining the catalytic performance of the as-obtained catalysts.18,19 Therefore, controlling and optimizing the architecture of bimetallic nanoparticles (noted NPs in the following) constitutes the major goal to get high performance and to merge synthesis with structure–activity relationships (the so-called “catalysis by design”) that ultimately allows the rational design of efficient catalysts. The type of morphology obtained strongly depends on the synthesis protocol, the miscibility of both metals, but also on post-synthesis treatment.3,13 The bimetallic composition obviously strongly influences the catalytic performance as shown in many previous studies.3,10,14,20 The question of which is the best metal ratio for an optimal catalyst for a given reaction and why such a ratio is actually the optimal one still remain unanswered.
In this work, we have chosen the oxidation of glucose as a representative reaction to study these factors. Comotti et al.14 have studied the activity of Au–Pt and Au–Pd NPs supported on activated carbon compared to monometallic (Au, Pt, Pd, Rh) catalysts in glucose oxidation under controlled and uncontrolled pH. Hermans et al.21 have also reported synergistic activity in glucose oxidation at basic pH over Au–Pd/C catalysts prepared by impregnation in aqueous solution. The synergistic effect was related to high Pd surface content. Benkó et al.10 have reported SiO2-supported Au–Ag catalysts prepared by sol adsorption method with different metal ratios at pH 9.5. The Au–Ag bimetallic effect and its dependence on the Ag/Au molar ratio was studied in glucose oxidation, where a synergistic activity increase was observed in the case of the bimetallic samples with Ag/Au = 50/50 molar ratio when compared to the Au/SiO2 monometallic reference sample. Synergistic effect has been reported for the three bimetallic systems at high pH. However, this synergistic effect in base-free oxidation of glucose was seldom studied. Realizing base-free reaction would be of high interest because the absence of base in the media would avoid the formation of salts, which must be disposed of at the end of the reaction, hence generating wastes. Glucose oxidation can give various products, but gluconic acid was chosen as the desired product in this work because the selectivity to this acid strongly depends on the catalyst properties.22 It can therefore play the role of a marker, as a discriminating criterion. In the absence of a base, isomerization of glucose to fructose is slowed down. Thus, the selectivity to gluconic acid should be enhanced. In addition, this route would be a one-step synthesis of gluconic acid from glucose instead of the acidification of a salt obtained at high pH. The use of unwanted and environmentally dangerous chemicals such as NaOH could be eliminated, which is positive from an economical point of view (increase of the equipment lifetime due to the elimination of strong corrosive media, elimination of the final gluconate-acid transformation). Moreover, it will be easier to study the occurrence of any synergistic effect with a base-free system. Thus, it is important to focus on the development of catalysts that will have better activity and stability in base-free conditions.
As a consequence, the main objective of this work was to achieve a thorough systematic study of the correlation between the physicochemical and catalytic properties of bimetallic heterogeneous gold-based catalysts for the base-free oxidation of glucose. Especially, the occurrence of any synergistic effect in these catalytic systems was studied. In this context, a set of different mono- and bimetallic supported gold-based catalysts were synthesized, characterized and tested in the base-free oxidation of glucose.
Experimental
Catalysts' preparation
On the basis of literature, sol-immobilization method and precipitation-reduction methods were chosen for the synthesis of the series of catalysts used in this work.23 By these two methods, the particle size of the metal nanoparticles could be kept below 10 nm,16 which is highly important to get a good activity of the gold-based catalyst. Especially, in the sol-immobilization method, by adjusting reaction time, reducing agent concentration, and precursors' concentration, the particle size could be very well controlled.23 The support provides the surface of the catalysts, where the metals are loaded and dispersed. The stability of the support is obviously also very important for the final catalyst. TiO2 was chosen to play this role, as it is very well known to be stable in base-free conditions while providing reasonable specific surface areas.24 The catalysts preparation methods are described in details in the following sections.The resulting slurry was stirred vigorously at room temperature for 1 h. Then, 5 mL of an aqueous solution of NaBH4 (0.1 M) were added dropwise to reduce Au and Cu. The as-obtained Au–Cu/TiO2 catalysts were centrifuged, washed with deionized water until no chloride traces were detected using a 1 wt% AgNO3 solution test, before being finally dried at 80 °C overnight for 24 h.
The catalysts samples were denoted as x%Auy%Pd (where x% corresponds to the gold wt% and y to the palladium wt%) or x%Auz%Cu (where x% corresponds to the gold wt% and z to the copper wt%).
Characterization
The prepared series of catalysts were characterized in order to determine their physical properties, such as the specific surface area, the particles size, their composition and structure, etc. The techniques used in the present work to characterize the catalysts are described in the followings.An Agilent 720-ES ICP-OES was used for determining the metal loading combined with a Vulcan 42S robot, which is an automated digestion system combining the two essential steps in sample preparation prior to analysis by ICP-OES: sample digestion and sample preparation.
N2 physisorption measurements were carried out on a TriStar II Plus apparatus from Micromeritics. Before measurements, the samples were degassed on a VacPrep061 equipment (Micromeritics) at 75 °C under primary vacuum for 80 min and at 250 °C for 3 h. The specific surface area of TiO2 support was 56 m2 g−1. The specific surface of the Au–Pd and Au–Cu modified catalysts did not change after the preparation due to the very low metal content.
XRD measurements were carried out on Brüker X-ray Diffractometer D8 Discover. The samples were scanned in the 2θ range of 20° to 70° with a step of 0.014 and using CuKα1 radiation source (λ = 0.1538 nm).
TEM electron microscopy images were recorded placing a drop of the particles in ethanol onto a carbon film supported on a cooper grid. The samples were studied using a FEI Tecnai G2 20 microscope with a LaB6 cathode operating at 20 kV and a FEI Titan Themis 300 with X-FEG emitter operating from 60 to 300 kV.
The XPS spectra were recorded at a residual pressure of 10−9 mbar on a Kratos Axis UltraDLD electron energy spectrometer operating with a monochromatic Al-Kα (1486.6 eV) or Mg-Kα (1253.6 eV) irradiation. The binding energy (BE) scale was calibrated on the C 1s peak (BE = 284.8 eV) resulting from surface contamination. The accuracy of the measure is estimated at ±0.1 eV. Differential surface charging of the samples was ruled out by checking the reproducibility of XPS measurement in repeated scans under different X-ray exposures. Software CasaXPS was used for the analysis of XPS spectra, separating elemental species in different oxidation states, and calculating relative concentrations of chemical elements.
Base-free aerobic oxidation of glucose
In a standard reaction test, the required amounts of catalyst were placed in the reactor and then 2 mL of an aqueous glucose solution (1 wt%) was added. The reactors were flushed with air at room temperature 3 times before setting the air pressure at 5 bars. Then, the reactors were sealed and the heating was started (the temperature ramp rate was 5 °C min−1). When the desired temperature was reached, stirring was set at 700 rpm and maintained for 5 hours. At 60 °C the final pressure was around 6 bars. At the end of the reaction, the reactors were cooled down. When the temperature reached 40 °C, the remaining pressure was released. Finally, the reaction solution was filtered to separate the catalysts from the liquid. The as-obtained solutions were used directly for analysis, which was carried out on a Dionex ultimate 3000 HPLC equipped with a fixed wavelength UV detector and a refractive index (RI) detector. As far as the stationary phase is concerned, a Rezex organic acid H+ 300 × 7.80 mm column was used. The mobile phase was a 0.0025 mol L−1 sulfuric acid solution used at room temperature with a 0.45 mL min−1 flow rate.Results
Au–Pd/TiO2 catalysts
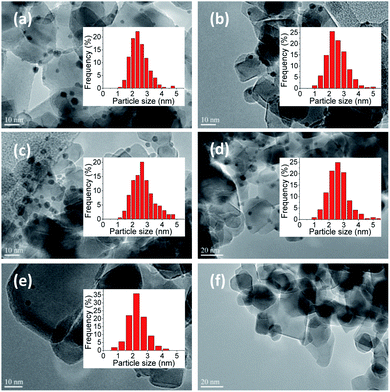
The actual amount of metal loading measured by ICP-OES and the mean particle size obtained from TEM images (Fig. 1) analysis are presented in Table 1.| Catalysts | Theoretical metal loading (wt%) | Measured metal loading (wt%) – ICP-OES | Particles size (nm) | ||||||
|---|---|---|---|---|---|---|---|---|---|
| Au | Pd | Au/Pd | Au/Pdb | Au | Pd | Au/Pd | Au/Pdb | ||
| a Not detected.b Molar ratio. | |||||||||
| 1%Au | 1 | 0 | — | — | 0.97 | NDa | — | — | 2.5 ± 0.6 |
| 0.9%Au0.1%Pd | 0.9 | 0.1 | 9 | 4.86 | 0.83 | 0.05 | 16.60 | 8.97 | 2.5 ± 0.7 |
| 0.7%Au0.3%Pd | 0.7 | 0.3 | 2.33 | 1.26 | 0.68 | 0.19 | 3.58 | 1.93 | 2.7 ± 0.7 |
| 0.5%Au0.5%Pd | 0.5 | 0.5 | 1 | 0.54 | 0.45 | 0.31 | 1.45 | 0.78 | 2.6 ± 0.7 |
| 0.3%Au0.7%Pd | 0.3 | 0.7 | 0.43 | 0.23 | 0.27 | 0.24 | 1.13 | 0.61 | 2.4 ± 0.8 |
| 1%Pd | 0 | 1 | — | — | ND | 0.67 | — | — | ND |
The metals loadings determined from ICP-OES are always lower than expected (Table 1). This is due to the preparation method in solution, which involves the deposition of the metals and several post-preparation steps (filtration and washing). However, the observed differences are quite reasonable and allow comparison of the catalysts' series with various metal compositions.
Fig. 1 presents TEM images of the Au–Pd catalysts supported on TiO2. At least 300 particles were considered, except for 0.3%Au0.7%Pd/TiO2, where 109 particles were counted, and the average particle size and distributions were calculated. A narrow distribution in particles sizes was obtained in any case with the majority of the particles being in the 2–3 nm range irrespective of the catalyst. Unfortunately, it was difficult to observe the metal particles in the 1%Pd/TiO2 catalyst prepared by sol-immobilization method. However, in this sample palladium was actually deposited on the support, as confirmed by ICP-OES, but the Pd particles were probably too small to be distinguished in the TEM images.
It can be concluded from TEM images that Au–Pd nanoparticles prepared by SIM were dispersed homogeneously on the TiO2 support. It is of importance that the mean sizes of Au–Pd particles in the bimetallic Au–Pd/TiO2 samples with different metal ratios were quite similar in the 2–3 nm range (Table 1). Such small Au–Pd particles are believed to be efficient in glucose oxidation.16,26 This also is interesting for the study of the effect of gold and palladium structure and ratio on catalytic performance since the activity will not be governed by the particle size, but only by the composition of the bimetallic particles.
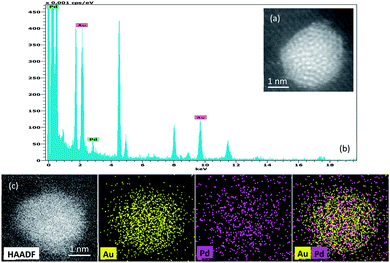
Fig. 2 shows the EDX spectrum and mapping of elements of one particle taken as a significant example on the 0.5%Au0.5%Pd/TiO2 catalyst. It illustrates the alloy-type of the synthesized Au–Pd particles. Note that no monometallic particles were detected by EDX confirming a good distribution of the metals in bimetallic nanoparticles.
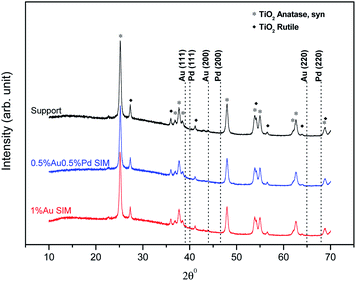
The X-ray diffraction patterns of catalysts of the Au–Pd/TiO2 were identical. We present here the XRD patterns of the 0.5%Au0.5Pd%/TiO2 and 1%Au/TiO2 samples to represent the catalysts series, together with that of the fresh TiO2 support for comparison. Due to the limitations of the technique which is not suitable to detect low metal contents (<1 wt%) or small metal particles (<4 nm)27 and thus due to the probable good and homogeneous dispersion of the metals on the titania surface,26 X-ray diffraction patterns of the catalysts did not show peaks originating from the introduced metals (Fig. 3). The patterns only show the presence of pure TiO2 with anatase and rutile-crystal structures, which is in good agreement with the standard data from the JCPDS PDF card 00-021-1272 and 04-003-0648, respectively.
Fig. 4 presents the XPS spectra of the Au 4f and Pd 3d XPS regions in the catalysts. Different Au 4f and Pd 3d photoelectron peaks corresponding to surface gold and palladium species were found depending on the catalysts' formulation. Because Au and Pd can easily form alloys, they can affect the binding energy of each other.28
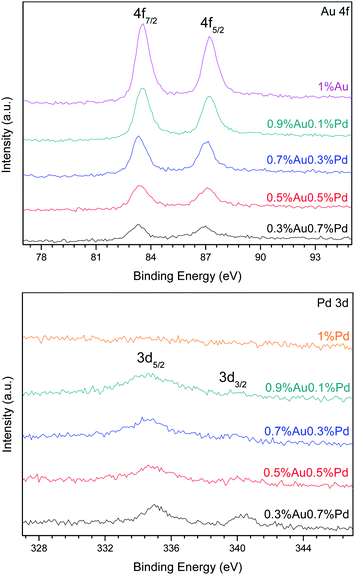 | ||
| Fig. 4 XPS curve of the Au 4f and Pd 3d photoelectron peaks in the series of catalysts prepared by the SIM method. | ||
In all the AuPd catalysts, the Au 4f7/2 photoelectron peak was located at a BE value between 83.22 and 85.99 eV, as reported in Table 2. These values are typical of metallic Au0 and oxidized Auδ+ species, respectively.29,30 The curve fitting of the Au 4f core-level spectrum was performed by using two spin–orbit split Au 4f7/2 and Au 4f5/2 components, separated by 3.7 eV, in a fixed intensity ratio (1.33), keeping the same full width at half-maximum (FWHM) values. The Au 4f curve fitting of the 0.7%Au0.3%Pd/TiO2 sample showed Au 4f7/2 components at BE = 83.31 and 85.76 eV, which can be assigned to Au0 and Auδ+, respectively.29–31 A small fraction of oxidized Auδ+ species were found among metallic gold and gold-palladium particles as indicated by the relative distribution of Au species in Table 2. These metallic gold species were present in the sample as very small nanoparticles undetectable by XRD, since the diffraction patterns showed only the reflections of the TiO2 support. The same oxidation states of gold were detected on the surface of the 0.5%Au0.5%Pd/TiO2 catalyst. The curve fitting of Au 4f7/2 spectrum indicates two Au 4f7/2 components at BE = 83.38 eV and 85.92 eV that also can be attributed to Au0 and Auδ+ species, respectively, with thus a little shift in BE value in comparison with 0.7%Au0.3%Pd/TiO2. The oxidized Auδ+ species represented only a small fraction (9.4%) of the total gold in presence. The other samples were quite similar with the Au 4f7/2 photoelectron peak located at a BE value between 83.22 and 85.99 eV.
| Catalysts | Au 4f7/2 BE (eV) | Surface Au species | Pd 3d5/2 BE (eV) | Surface Pd species |
|---|---|---|---|---|
| a Not detected. | ||||
| 1%Au | 83.51 | Au0 (95.0%) | NDa | ND |
| 85.99 | Auδ+ (5.0%) | |||
| 0.9%Au0.1%Pd | 83.49 | Au0 (95.9%) | 334.69 | Pd0 (100%) |
| 85.99 | Auδ+ (4.1%) | |||
| 0.7%Au0.3%Pd | 83.31 | Au0 (94.0%) | 334.68 | Pd0 (100%) |
| 85.76 | Auδ+ (6.0%) | |||
| 0.5%Au0.5%Pd | 83.38 | Au0 (90.6%) | 334.80 | Pd0 (71.8%) |
| 85.92 | Auδ+ (9.4%) | 336.16 | Pd2+ (28.2%) | |
| 0.3%Au0.7%Pd | 83.22 | Au0 (87.9%) | 335.05 | Pd0 (87.8%) |
| 85.65 | Auδ+ (12.1%) | 337.00 | Pd2+ (12.2%) | |
| 1%Pd | ND | ND | ND | ND |
The Pd 3d5/2 photoelectron peak is located at a BE value between 334.55 and 336.93 eV. These values are typical of metallic Pd0 and Pd2+ species, respectively.32 Pd 3d was well separated by 5.26 eV by using spin–orbit Pd 3d5/2 and Pd 3d3/2 components, in a fixed intensity ratio (1.5), also keeping the same full width at FWHM values. Pd 3d peaks have asymmetric peak shape for metal while Pd oxides have symmetric peak shapes. The Pd 3d curve fitting of the 0.5%Au0.5%Pd/TiO2 sample shows Pd 3d5/2 components at BE = 334.80 and 336.16 eV, which can be assigned to Pd0 and Pd2+, respectively. Their relative distribution reveals a significant fraction of oxidized Pd2+ on the sample surface, as reported in Table 2. A little shift of BE value of Pd 3d5/2 components is observed in the Pd 3d curve fitting of 0.3%Au0.7%Pd/TiO2 sample, with peaks at 335.05 and 337.00 eV that can also be assigned to Pd0 and Pd2+, respectively.30 The Pd 3d spectrum of 0.9%Au0.1%Pd/TiO2 and 0.7%Au0.3%Pd/TiO2 catalysts consisted of two components located at BE = 334.69 and 334.68 eV, respectively, which can be assigned to metallic palladium species, namely Pd0.30 Surprisingly, in 1%Pd/TiO2, no Pd 3d photoelectron peaks were observed as shown in Fig. 4. This suggests that there is no palladium on the surface, or that its concentration is very low (less than 0.01 wt%).
The surface chemical compositions of the x%Auy%Pd/TiO2 catalysts, as determined by XPS, are reported in Table 3.
| Catalysts | Au 4f7/2 | Pd 3d5/2 | Au/Pd | Au/Pda | Au/Pdc | Ti | O | C |
|---|---|---|---|---|---|---|---|---|
| a Weight ratio between gold and palladium.b Not detected.c Weight ratio by ICP-OES. | ||||||||
| 1%Au | 0.25 | NDb | — | — | — | 15.05 | 42.72 | 41.96 |
| 0.9%Au0.1%Pd | 0.17 | 0.08 | 2.11 | 3.91 | 16.60 | 10.80 | 32.70 | 56.23 |
| 0.7%Au0.3%Pd | 0.13 | 0.07 | 1.79 | 3.31 | 3.58 | 10.92 | 32.03 | 56.84 |
| 0.5%Au0.5%Pd | 0.10 | 0.04 | 2.30 | 4.23 | 1.45 | 11.77 | 33.57 | 54.51 |
| 0.3%Au0.7%Pd | 0.05 | 0.06 | 0.86 | 1.59 | 1.13 | 11.93 | 35.34 | 52.61 |
| 1%Pd | ND | ND | — | — | — | 7.28 | 26.56 | 66.14 |
Prior to the evaluation of the catalytic performance of the series of catalysts, blank tests were performed under standard reaction conditions. As shown in Table 4, 6% of glucose conversion was observed, while the selectivity to gluconic acid was only 9.0%. In contrast, over TiO2 the conversion of glucose was only 3.3% and selectivity to gluconic acid raised to 39.6%. Blank test was also done at 80 °C by adding only the TiO2 support. 3.6% of glucose conversion was observed, and no gluconic acid was detected. The carbon balance of all the blank tests was in the 94–98% range.
| Temperature/°C | Glucose conversion% | Gluconic acid select% | Glucuronic acid select% | Fructose select% | Carbon balance% |
|---|---|---|---|---|---|
| a Blank test without adding catalyst.b Blank test adding only support TiO2. Reaction conditions: 2 mL of 1 wt% glucose aqueous solution, catalyst (21.9 mg), air pressure = 5 bar, 5 h of reaction. | |||||
| 60a | 6.0 | 9.0 | 0.0 | 0.0 | 94.5 |
| 60b | 3.3 | 39.6 | 0.0 | 0.0 | 97.6 |
| 80b | 3.6 | 0.0 | 0.0 | 0.0 | 95.9 |
Glucose oxidation was carried out at 60 °C, 80 °C, 100 °C and 150 °C, respectively. Because degradation of glucose occurs at relatively high temperatures, a lot of by-products were generated during reaction at 150 °C. In that case, the solutions became brown after 2 h of reaction with a very low carbon balance. Thus, the results of the tests at 150 °C were not considered in the following discussion. The main product of the oxidation reaction was gluconic acid. However, in some cases glucuronic acid or fructose could also be observed. The carbon balance of the reactions at 60 °C was nearly 100%, while at 80 °C it was around 90% and at 100 °C it was around 75%.
Fig. 5 presents the catalytic performances vs. gold content (from ICP-OES) at 60 °C, 80 °C and 100 °C, respectively. To enable comparison of the reactivity results, the catalytic activity was normalized by expressing it as moles of glucose converted per mole of gold in the catalyst. Two different trends were observed. At 60 °C, as the introduced quantities of palladium increased, the catalytic activity increased to a maximum at 0.45 wt% Au, and then decreased. The less active catalyst tested was the monometallic Pd catalyst, for which only 1.5% conversion of glucose was observed (Table 5). Therefore, a volcano-type plot was observed across the range of bimetallic catalyst compositions tested. This confirmed the presence of a synergistic effect between Pd and Au. The selectivity to gluconic acid was always around 75% except for the 1%Au/TiO2 catalyst, where the selectivity to gluconic acid was only 53%. The oxidation reaction at 80 °C exhibited the same activity trend, across the range of Au–Pd catalyst composition tested. The selectivity to gluconic acid was maintained at ca. 75% without significant influence of the Pd content in the catalyst. In contrast, at 100 °C, a linear relation between catalyst activity and gold content was observed. This could be partly explained by the fact that, at this temperature, glucose conversion reached 100% over all catalysts. The selectivity to gluconic acid was kept around 65%, which is less than that observed at lower temperature, while around 10% selectivity to fructose was observed. This suggests that increasing the temperature will increase the conversion of glucose but the selectivity to desired gluconic acid will be decreased because the isomerization of glucose to fructose occurred. The activity results for 0.1%Au0.9%Pd/TiO2 catalyst were not shown in Fig. 5 because the conversion was nearly null and very close to the blank test. For example, at 60 °C the conversion of glucose was 4.3% and the selectivity to gluconic acid was 38.8%.
 | ||
| Fig. 5 Oxidation of glucose over a series of mono- and bi-metallic catalysts containing Au and Pd supported on TiO2, reaction conditions: 2 mL of a 1 wt% glucose aqueous solution, 1 wt% bimetallic catalyst (21.9 mg), air pressure = 5 bar, 5 h of reaction (details in ESI Tables S1–S3†). | ||
| Temperature/°C | Glucose conversion% | Gluconic acid select% | Glucuronic acid select% | Fructose select% | Carbon balance |
|---|---|---|---|---|---|
a Reaction conditions: 2 mL of a 1 wt% glucose aqueous solution (metal![[thin space (1/6-em)]](https://www.rsc.org/images/entities/char_2009.gif) : :![[thin space (1/6-em)]](https://www.rsc.org/images/entities/char_2009.gif) glucose ratio of 100), catalyst (21.9 mg), air pressure = 5 bar, 5 h of reaction. glucose ratio of 100), catalyst (21.9 mg), air pressure = 5 bar, 5 h of reaction. |
|||||
| 60 | 1.2 | 35.3 | 0.0 | 0.0 | 98.9 |
| 80 | 3.8 | 53.6 | 0.0 | 0.0 | 98.2 |
| 100 | 13.5 | 53.6 | 0.0 | 13.2 | 95.5 |
Au–Cu/TiO2 catalysts
Au–Cu/TiO2 catalysts were prepared by precipitation-reduction (PR) method. ICP-OES technique was used to determine the amounts of metal actually present in the synthesized catalysts (Table 6). The actual loadings were generally close but a little bit less than the theoretical ones. Comparing to what was obtained for Pd, Cu seems to be more easily reduced and hence the actual content is close to the theoretical values. However, as the metal loading increased, copper was not loaded as well as gold. For example, for 1 wt% Au in theory, the actual ICP-OES loading was 0.92 wt%, while for the copper loading of 1 wt% in theory, the actual ICP-OES loading was 0.81 wt%.| Catalysts | Theoretical metal loading (wt%) | Measured metal loading (wt%) – ICP-OES | Particles size (nm) | ||||||
|---|---|---|---|---|---|---|---|---|---|
| Au | Cu | Au/Cu | Au/Cud | Au | Cu | Au/Cu | Au/Cud | ||
| a 59 particles counted.b 18 particles counted.c Not detected.d Molar ratio. | |||||||||
| 1%Au | 1 | 0 | — | — | 0.92 | NDc | — | — | 4.3 ± 1.9 |
| 0.9%Au0.1%Cu | 0.9 | 0.1 | 9 | 2.90 | 0.86 | 0.09 | 9.56 | 3.08 | 3.3 ± 1.0 |
| 0.7%Au0.3%Cu | 0.7 | 0.3 | 2.33 | 0.75 | 0.72 | 0.29 | 2.48 | 0.80 | 3.1 ± 1.0 |
| 0.5%Au0.5%Cu | 0.5 | 0.5 | 1 | 0.32 | 0.45 | 0.41 | 1.10 | 0.35 | 3.4 ± 1.0 |
| 0.3%Au0.7%Cu | 0.3 | 0.7 | 0.43 | 0.14 | 0.30 | 0.64 | 0.47 | 0.15 | 2.7 ± 1.0 |
| 0.1%Au0.9%Cua | 0.1 | 0.9 | 0.11 | 0.04 | 0.09 | 0.76 | 0.12 | 0.04 | 2.4 ± 1.0 |
| 1%Cub | 0 | 1 | — | — | ND | 0.81 | — | — | 2.2 ± 0.5 |
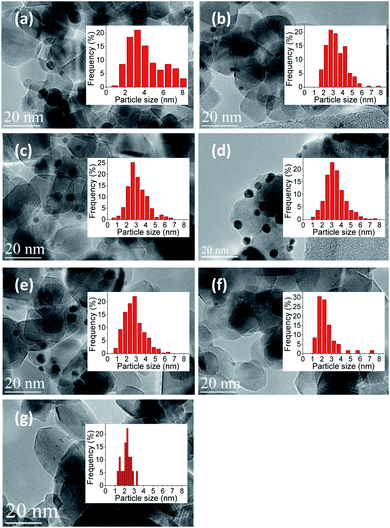
Au–Cu nanoparticles were dispersed relatively homogeneously in all samples. The mean size of the Au–Cu nanoparticles in 0.9%Au0.1%Cu/TiO2, 0.7%Au0.3%Cu/TiO2, 0.5%Au0.5%Cu/TiO2 and 0.3%Au0.7%Cu/TiO2 samples were found very close, in the range of 2.7 to 3.4 nm. However, the mean size of gold nanoparticles in 1%Au/TiO2 catalyst was a bit higher with a value of 4.3 nm (Table 6).
TEM was used to investigate the metal particle size and their distributions, as the size of Au–Cu bimetallic particles is a key parameter determining the catalytic performance. Fig. 6 presents TEM images for different Au/Cu ratios supported on TiO2.
At least 300 particles were counted. Average size of the particles and distributions of the size were calculated. As observed, the metal nanoparticles were well distributed on the support in most of the cases. However, in case of 0.1%Au0.9%Cu/TiO2 (Fig. 6f) and 1%Cu/TiO2 (Fig. 6g) it was very difficult to distinguish the nanoparticles. This is most probably because the molar masses of Ti and Cu are very close, so the contrast between each element is not good. Another possibility is that the metal nanoparticles were too small to be observed. ICP-OES results showed that there was 0.09 wt% of gold and 0.76 wt% of copper in 0.1%Au0.9%Cu/TiO2 catalysts and 0.81 wt% of Cu in 1%Cu/TiO2 catalyst. It suggests that the size of the nanoparticles had reached the resolution limitation of the TEM technique.
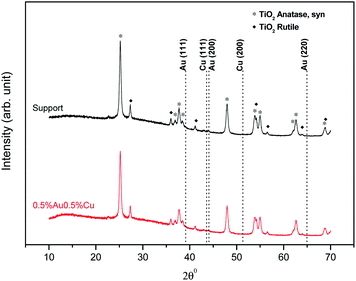
XRD analysis of the samples was carried out to determine potential crystallinity of the gold and copper species. 0.5%Au0.5%Cu/TiO2, prepared by precipitation-reduction method and fresh support TiO2 as a benchmark were chosen (Fig. 7). However, due to the sensitivity of the technique, only the presence of pure TiO2 could be observed (metal content is a bit too low compared to the detection limit).
The HAADF image and EDX mapping showed the co-existence of alloyed Cu and Au within the nanoparticles in 0.5%Au0.5%Cu/TiO2 catalyst (Fig. 8).
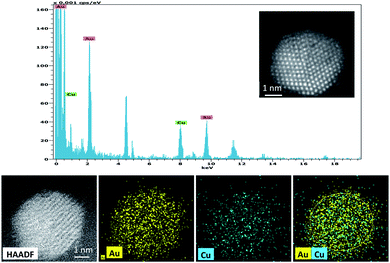 | ||
| Fig. 8 EDX spectrum and HAADF images of 0.5%Au0.5%Cu/TiO2 catalyst from a single Au–Cu bimetallic nanoparticle. | ||
The bimetallic Au–Cu catalysts with different ratio between gold and copper supported on TiO2 were characterized by X-ray photoelectron spectroscopy (XPS) to get information about chemical state of the surface species.
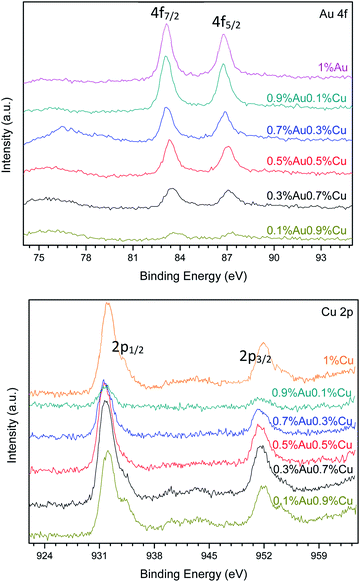
Fig. 9 shows the XPS spectra of Au 4f and Cu 2p levels of the bimetallic Au–Cu/TiO2 series. Tables 7 and 8 show the results of chemical composition of all the investigated catalysts in details. As an example, Fig. S1 and S2 (see ESI†) show the XPS peak fitting of 0.3%Au0.7%Cu/TiO2. In all the Au–Cu/TiO2 catalysts prepared by precipitation-reduction method, the Au 4f7/2 photoelectron peak was located at a binding energy (BE) value between 83.08 and 85.74 eV. These values can be assigned to metallic Au0 and oxidized Auδ+ species, respectively.29,30 The curve fitting of the Au 4f core-level spectrum was performed as aforementioned. In Fig. 9, different Au 4f and Cu 2p photoelectron peaks of surface gold and copper species were found depending on the different Au/Cu ratio. Some shifts were also detected. That is because these two metals can easily formed alloys, which affects their respective binding energies.28,33 For example, in the 1%Au/TiO2 sample, the Au 4f curve fitting shows Au 4f7/2 components at BE = 83.08 and 85.74 eV. These two values are in good agreement with those reported in the literature for Au0 and Auδ+, respectively.29–31 In the 0.7%Au0.3%Cu/TiO2 sample, the curve fitting of Au 4f7/2 spectrum indicated two Au 4f7/2 components at BE = 83.15 and 84.97 eV that could also be attributed to Au0 and Auδ+ species, respectively. But there was a shift of BE values in comparison with the gold monometallic catalyst. As more Cu and less gold were introduced in the catalysts, the shifts of BE values became bigger. The Cu 2p XPS spectrum of 0.1%Au0.9%Cu/TiO2 showed a main signal and a satellite peak. The main signal could be deconvoluted into four contributions, indicating different oxidation states of copper. The contribution at 932.41 eV could be assigned to the presence of CuOH, the peak at 931.54 eV could be assigned to Cu1+ and metallic copper, and the last one at 934.22 eV could be attributed to the CuO species.34,35 The satellite peak confirmed the presence of CuO species on the surface of this sample. The satellite peak arises when the emitted photoelectron lost part of its kinetic energy to excite a valence electron to an unoccupied d orbital of Cu. The presence of satellite peak was, therefore, an indication of the existence of d9 partially filled orbitals in Cu fundamental state, and thus it appeared only when Cu2+ species was present.33,35–38 When Cu loading was less than 0.5 wt%, the satellite peak was almost not observed because the signal intensity was very low, but CuO existed in most samples. Table 8 also reveals that CuOH was present when Cu loading was less than 0.9 wt%. In the case of 1%Cu/TiO2 catalyst, only Cu1+/Cu0 and CuO could be observed.
| Catalysts | Au 4f7/2 | Cu 2p3/2 | Au/Cu | Au/Cua | Au/Cub | Ti | O | C |
|---|---|---|---|---|---|---|---|---|
| a Weight ratio between gold and copper.b Weight ratio by ICP-OES. | ||||||||
| 1%Au | 0.26 | — | — | — | — | 24.75 | 57.34 | 17.65 |
| 0.9%Au0.1%Cu | 0.24 | 0.17 | 1.44 | 4.45 | 9.56 | 23.32 | 57.04 | 19.23 |
| 0.7%Au0.3%Cu | 0.18 | 0.58 | 0.31 | 0.96 | 2.48 | 22.37 | 56.91 | 19.96 |
| 0.5%Au0.5%Cu | 0.17 | 0.83 | 0.21 | 0.64 | 1.10 | 22.94 | 56.91 | 19.15 |
| 0.3%Au0.7%Cu | 0.12 | 1.27 | 0.09 | 0.29 | 0.47 | 23.59 | 57.65 | 17.36 |
| 0.1%Au0.9%Cu | 0.05 | 1.22 | 0.04 | 0.13 | 0.12 | 18.41 | 51.35 | 28.97 |
| 1%Cu | — | 1.16 | — | — | — | 17.20 | 49.96 | 31.67 |
| Catalysts | Au 4f7/2 BE (eV) | Surface Au species | Cu 2p3/2 BE (eV) | Surface Cu species |
|---|---|---|---|---|
| a δ represents 1 and/or 3. | ||||
| 1%Au | 83.08 | Au0 (93.5%) | — | — |
| 85.74 | Auδ+ (6.5%) | |||
| 0.9%Au0.1%Cu | 83.07 | Au0 (100%) | 931.45 | Cu0/Cu1+ (56.0%) |
| 932.34 | CuOH (44.0%) | |||
| 0.7%Au0.3%Cu | 83.15 | Au0 (92.1%) | 931.44 | Cu0/Cu1+ (65.0%) |
| 84.97 | Auδ+ (7.9%) | 932.51 | CuOH (30.7%) | |
| 934.13 | CuO (4.3%) | |||
| 0.5%Au0.5%Cu | 83.34 | Au0 (92.0%) | 931.46 | Cu0/Cu1+ (52.4%) |
| 84.91 | Auδ+ (8.0%) | 932.48 | CuOH (34.0%) | |
| 934.21 | CuO (13.6%) | |||
| 0.3%Au0.7%Cu | 83.45 | Au0 (93.6%) | 931.42 | Cu0/Cu1+ (49.9%) |
| 85.06 | Auδ+ (6.4%) | 932.40 | CuOH (36.0%) | |
| 934.04 | CuO (14.1%) | |||
| 0.1%Au0.9%Cu | 83.64 | Au0 (87.2%) | 931.54 | Cu0/Cu1+ (36.5%) |
| 85.56 | Auδ+ (12.8%) | 932.41 | CuOH (40.3%) | |
| 934.22 | CuO (23.2%) | |||
| 1%Cu | — | — | 932.05 | Cu0/Cu1+ (85.0%) |
| 934.23 | CuO (15.0%) | |||
The Au/Cu atomic ratio on the surface of 0.9%Au0.1%Cu/TiO2 was 1.44 (Table 7), which indicated that the bulk of the particles was rich in gold. On the contrary, other catalysts were rich in copper. This is in good agreement with the results obtained by ICP-OES (Table 6). Comparing the value of Au/Cu bulk weight ratio, the Au/Cu ratio on the surface was smaller. It reveals that more copper stayed on the surface of the catalysts rather than in the bulk of the catalyst.
Similarly to what was done with the Au–Pd series catalysts, catalytic tests for the Au–Cu/TiO2 series catalysts were carried out at 60, 80 and 100 °C, respectively (Fig. 10). The other reaction conditions were the same as those used for the Au–Pd series.
 | ||
| Fig. 10 Base-free oxidation of glucose over a series of mono- and bi-metallic catalysts containing Au and Cu supported on TiO2, reaction conditions: 2 mL of a 1 wt% of glucose aqueous solution, 1 wt% catalyst (21.9 mg), air pressure = 5 bar, 5 h of reaction (details in Tables S4–S6†). | ||
At 60 °C, as the introduced quantity of Au was increased, the catalytic activity also increased to reach a maximum at 0.3–0.45 wt% of Au before decreasing with further increase in the Au proportion. The least active catalyst tested was the monometallic Cu catalyst, which exhibited only 1.5% conversion of glucose, forming a volcano plot across the range of bimetallic catalyst compositions tested. This confirmed the presence of a synergistic effect. The selectivity to gluconic acid was always around 50% except over the 0.1%Au0.9%Cu/TiO2 catalyst for which selectivity to gluconic acid was roughly ca. 10 points lower.
The same observation was done at 80 °C but as the temperature increased, the activity and selectivity increased as well. The trend of activity was very close to that observed at 60 °C except for 0.1%Au0.9%Cu/TiO2, for which there was a remarkable increase of activity when the temperature was increased from 60 to 80 °C. As reaction temperature was increased to 100 °C, an almost linear inverse relation between catalyst activity and gold content was observed. This was because at this temperature, the glucose conversion was close to or reached 100% over all the catalysts. The selectivity to gluconic acid was maintained at roughly 60%. When the gold content was more than 0.1 wt%, the selectivity to gluconic acid was maintained more or less at the same level irrespective of the Au content in the catalyst at a given temperature. This suggests that gold played a decisive role in the selectivity to gluconic acid in the oxidation of glucose. This effect was not obvious over 0.1%Au0.9%Cu/TiO2 because the content of gold was too low to be the only key factor.
Mechanism
The mechanism of carbohydrates oxidation in basic medium is already well known. Several roles for O2 during the oxidation reactions in water at high pH have been already proposed. The most important of them include (i) the formation and direct participation of atomic O during reaction, (ii) the reduction of atomic O to water through H atoms adsorbed on the surface, (iii) the direct oxidation of the intermediates with atomic O to form the O-insertion product acids, (iv) and the removal of strongly bound organic adsorbates from the surface.39As reported in the study of alcohols oxidation mechanisms over heterogeneous catalysts reviewed by Davis et al.,40 oxidation of an alcohol to an aldehyde on metal catalyst occurs in three main steps. The first step is the alcohol adsorption on the metal surface, which produces an adsorbed metal alkoxide and a metal hydride (or a water molecule, if metal hydroxide species are involved). After this adsorption, a carbonyl species and a metal hydride are produced via β-hydride elimination. The final step is the oxidation of metal hydride by O2 to regenerate the metal surface (or metal hydroxide species). As reported, this last step may lead also to the production of water (on metals that dissociatively adsorbed oxygen) or hydrogen peroxide (on metals that do not dissociatively adsorb oxygen such as gold).36,37 Both molecules would desorb to regenerate the active metal surface. In this way, the carboxylic acid is produced by subsequent oxidation of the aldehyde through a geminal diol intermediate. Indeed, as reported in the literature,36 aldehydes may undergo reversible hydration to geminal diols. This hydrated diol can then also adsorb to a metal surface and undergo a β-hydride elimination to form a carboxylic acid. It was observed that the presence of the surface adsorbed hydroxides, similarly to the use of an alkaline solution, facilitates both the formation of an adsorbed alkoxide (or geminal diol), and the elimination step of a β-hydride towards the production of aldehyde and carboxylic acid.36,37 A similar mechanism corresponding to a modified oxidative dehydrogenation mechanism was also suggested as the most probable for glucose oxidation to gluconic acid using gold catalysts.5,41 Concerning the reaction of glucose oxidation, a deprotonated geminal diol formed in alkaline solution is adsorbed at the catalyst surface. It may then undergo a β-hydride elimination to form gluconic acid. It was showed, that after gluconic acid desorption, both the non-dissociatively adsorb oxygen species and a metal hydride reacted to form an adsorbed peroxide species. This peroxide species desorbs subsequently from the catalyst surface.5,41 In the same way the adsorption, of sugar molecules on a metal surface is facilitated by surface hydroxyl species. It is possible due to the hydrogen bonds with the aldehyde (or geminal diol intermediate). As could be expected various transformations are involved in the process. The formation of enediol intermediate is with no doubt, crucial for more further oxidations of glucose.42 A lot of attention has been also paid to the mechanism of the oxidation of alcohols during homogeneous catalytic reaction using gold catalysts. Rossi et al.43 developed one of the most sophisticated molecular models for carbohydrates oxidation in the presence of gold catalysts. Since, as showed above, the oxidation of an aldehyde to a carboxylic acid proceeds via an aldehyde hydrate, it should be the same during the oxidation of an alcohol. On the basis of various kinetic results obtained for oxidation of glucose to gluconic acid, an activation energy of 47 ± 1.7 kJ mol−1 was obtained, which is quite similar to the value of 49.6 ± 4.4 kJ mol−1 obtained in the case of the enzymatic oxidation. Moreover taking into account that this reaction is considered as being of the first order reaction (relative to oxygen), the authors suggested a fast adsorption of glucose on gold. In this way, the rate-determining step would be glucose oxidation by oxygen dissolved in the liquid (aqueous) phase. Hydrogen peroxide could be detected, but it decomposed quickly under reaction conditions. Such glucose oxidations can reach an initial TOF of 50![[thin space (1/6-em)]](https://www.rsc.org/images/entities/char_2009.gif) 120 h−1. In a subsequent investigation, Rossi et al.5,43 showed that these oxidations do not proceed via a radical pathway, but deliver gluconate and hydrogen peroxide by a two-electron mechanism. Hydrogen peroxide decomposes because of the basic medium before it reaches a concentration at which it would efficiently compete with oxygen as an oxidant. Scheme 1 shows the mechanism for this oxidation reaction. In aqueous medium the two cyclic diastereomers of glucose and the acyclic aldehyde form are in equilibrium. Nucleophilic addition of hydroxide will form (a), which is adsorbed onto the catalyst (b). Oxygen then reacts with (a) to form the peroxy complex (c), and the hydrogen atom of the coordinated aldehyde hydrate is eliminated as a proton. The produced gluconic acid (e) then leaves the catalyst and hydrogen peroxide is also released. With gold colloids with a mean particle diameter of 3.6 nm lie on the border between heterogeneous and homogeneous catalysis, Shi and co-workers recently described the selective oxidation of alcohols to aldehydes or ketones using complexes of gold soluble in toluene. This reaction also works under air atmosphere; for example, with benzyl alcohol, a 100% conversion and a 99% selectivity towards benzaldehyde were obtained.44
120 h−1. In a subsequent investigation, Rossi et al.5,43 showed that these oxidations do not proceed via a radical pathway, but deliver gluconate and hydrogen peroxide by a two-electron mechanism. Hydrogen peroxide decomposes because of the basic medium before it reaches a concentration at which it would efficiently compete with oxygen as an oxidant. Scheme 1 shows the mechanism for this oxidation reaction. In aqueous medium the two cyclic diastereomers of glucose and the acyclic aldehyde form are in equilibrium. Nucleophilic addition of hydroxide will form (a), which is adsorbed onto the catalyst (b). Oxygen then reacts with (a) to form the peroxy complex (c), and the hydrogen atom of the coordinated aldehyde hydrate is eliminated as a proton. The produced gluconic acid (e) then leaves the catalyst and hydrogen peroxide is also released. With gold colloids with a mean particle diameter of 3.6 nm lie on the border between heterogeneous and homogeneous catalysis, Shi and co-workers recently described the selective oxidation of alcohols to aldehydes or ketones using complexes of gold soluble in toluene. This reaction also works under air atmosphere; for example, with benzyl alcohol, a 100% conversion and a 99% selectivity towards benzaldehyde were obtained.44
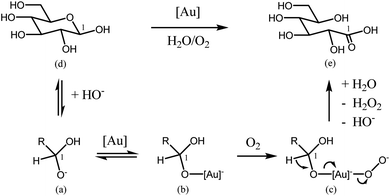 | ||
| Scheme 1 Mechanistic model by Rossi et al. for glucose oxidation. Adapted from ref. 5. | ||
All of these routes require O2 dissociation on the catalyst surface. This process is actually not favored on Au catalysts.45,46 The production of peroxide during oxidation reactions over Au47,48 indicates that O2 is first reduced during these reactions before dissociation. Then, the activation of O2 should occur through dissociation of peroxide (OOH*) and hydrogen peroxide (HOOH*) intermediates.39 The steady-state coverage of hydroxide on the surface is probably limited by the ability of the metal to accommodate the excess negative charge. As demonstrated by Davis et al.,39 the peroxide that forms can subsequently dissociate on Au to form atomic O and hydroxide, with an energetic barrier of 83 kJ mol−1. However, as the authors concluded, the more probable step is the further reduction of OOH* to H2O2*, with an energetic barrier of only 48 kJ mol−1. The decomposition of hydrogen peroxide over Pd has an energetic barrier of only 5 kJ mol−1. Such a low value for peroxide decomposition on Pd as compared to Au could explain the synergistic effect observed in our work for Au–Pd catalysts tested under identical reaction conditions.
The role of O2 during selective oxidation is an indirect one and does not involve incorporation into the acid product but it participates in the regeneration of the hydroxide ions. Zope et al.47,49 proposed that O2 played an indirect role in the mechanism by removing electrons from the metal surface generated by substrate oxidation.50 Thus, O2 closes the catalytic cycle by serving as an electron scavenger and regenerating hydroxide ions that are consumed in the reaction to produce acid products. Obviously, the role of the basic site on the catalyst surface is important. It activates O–H and C–H bonds. Thus, the activity of the catalysts will be related to the optimum number of metal-support interfacial sites, which may contain hydroxyl groups (surface basic sites). If hydroxyl groups are supplied through the solution medium (basic solution), the metal-support interface is much less important so that even bulk gold becomes an active catalyst. The mechanism of the oxidation in base-free conditions is still unknown and under debate. Adapted advanced characterization methods and operando studies would be needed to elucidate it.
Discussion
In case of Cu-containing samples the activity was much higher for Au-rich catalysts. Au–Cu alloy systems supported on different materials were already explored as catalysts for oxidation reactions.51,52 Generally, Au0 is believed to be the active site while, Cu0 plays an important role in activation of oxygen molecules.53 However, it was observed that Au0–Cu0 nanoparticles alone are not catalytically active in their original form. The formation of an Au–CuOx structure has been found to be essential to obtain high activity. As suggested in the literature54 the Cu0 component enriched the surface of the alloy nanoparticles while CuOx can provide active oxygen species. Moreover, Zhan et al.55 have also pointed out that the thickness of the CuOx layer on the surface is also crucial because a thick CuOx layer will prevent O2 from approaching Au0 active sites and slowing down activation. In our case, four different Cu species were detected (Table 8 and Fig. 9): Cu0, Cu+, CuOH and CuO. For all catalysts the Cu is mostly in Cu0/Cu+ state. Indeed, the BE energy corresponds well to the metallic and/or Cu+ states. However, due to the very low Cu loadings, it was impossible to properly record and discuss the Auger Cu LVV region. The discussion was made using the CuOH and Cu2+ species that are considered as active sites in the oxidation reaction (as discussed above). As presented in Fig. 11, glucose conversion increased when the total% of oxidized Cu increased (i.e., considering CuOH and CuO).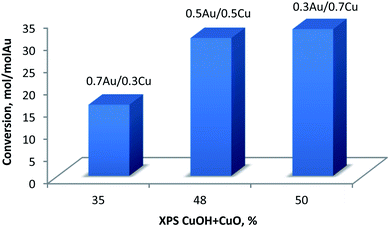 | ||
| Fig. 11 Conversion of glucose at 60 °C versus total% of oxidized copper (CuOH + CuO) as obtained from XPS. | ||
The presence of CuOH on the catalyst surface was confirmed by the absence of the satellite peaks and the presence of the third component in the Cu 2p3/2 region (Fig. 9).
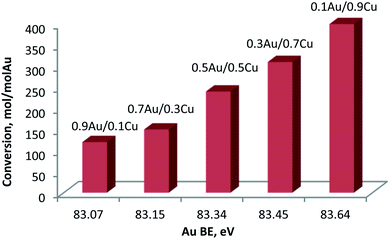
One can expect that the higher content of surface Cu oxidized species will affect the metallic character of the gold due to the electron transfer from Au to Cu (Fig. 12).
Indeed, an almost linear correlation was found between glucose conversion and the chemical state of gold (expressed as BE of the Au 4f7/2 level). The 4f7/2 BE of gold shifted progressively to higher values with the increase of the Cu content in the sample. This could be explained by the strong interaction between Au and Cu in the formed alloy. Higher contents of Cu enable formation of a larger quantity of Cu oxidized species on the surface. This induces the transfer of electrons from Au to Cu, yielding an increase in the Au 4f7/2 BE. Specifically, the Auδ+ character increased with the increase of the Cu content. Previous experimental and theoretical investigations on supported Au catalysts have indicated that the most catalytically active sites in oxidation reactions correspond to surface Auδ+ species,56–58 making this material particularly attractive. It is important to emphasize that the Au–Cu alloys presented the highest concentration of this species in comparison to the other studied supported Au–Me bimetallic catalysts displaying good performances towards oxidation transformations.
Moreover, as generally accepted, the catalytic rate exponentially depends on the adsorption energy between the active sites and reactants. Adsorption energy is determined by the composition, size and facet of the nanocrystals. In addition, ligands and metal alloy may undergo a charge transfer process, tuning the surface electronic structure of the nanoparticles, and therefore affecting their catalytic activity.59 Also, the influence of crystal structure and atomic ordering (intermetallic vs. random alloy) on the catalytic activity is very important. It has been demonstrated that ordered Au–Cu alloys exhibited enhanced catalytic properties.60 However, the mechanism of how atomic ordering affects catalytic performance still needs to be elucidated.
In the case of the Au–Pd bimetallic catalysts, the remarkable increase in catalytic oxidation activity is already well established.3,61–65 For alcohols oxidation, Au–Pd nanoparticles were found to be twice as active as Pd alone. It was proposed that Au is an electronic promoter of Pd.61 Composition effect was also reported, where a progressive increase in catalytic activity was observed upon increasing the Pd content, with an optimum Au![[thin space (1/6-em)]](https://www.rsc.org/images/entities/char_2009.gif) :
:![[thin space (1/6-em)]](https://www.rsc.org/images/entities/char_2009.gif) Pd ratio of ca. 1
Pd ratio of ca. 1![[thin space (1/6-em)]](https://www.rsc.org/images/entities/char_2009.gif) :
:![[thin space (1/6-em)]](https://www.rsc.org/images/entities/char_2009.gif) 1.86, and a progressive decrease in activity with further increase in the Pd content.66 In our case, from the XPS data it could be deduced that gold was mostly reduced and the metallic character decreased with the increase in Pd content in the samples. In the same time the oxidation state of Pd progressively moved from Pd0 to Pd2+ with the increase of gold content in the sample. It could be concluded that there should be an optimum ratio between Pd0 and Pd2+ species that will maintain a high activity as well as high selectivity.
1.86, and a progressive decrease in activity with further increase in the Pd content.66 In our case, from the XPS data it could be deduced that gold was mostly reduced and the metallic character decreased with the increase in Pd content in the samples. In the same time the oxidation state of Pd progressively moved from Pd0 to Pd2+ with the increase of gold content in the sample. It could be concluded that there should be an optimum ratio between Pd0 and Pd2+ species that will maintain a high activity as well as high selectivity.
Conclusion
The understanding of the structure and composition of the Au–Pd bimetallic catalysts is key for designing more active catalysts and to find robust structure–activity relationships. However, the exact characterization of these samples is often difficult due to interference of the support (metal support interactions) or low metal loadings. For glucose oxidation, the activity of the Au–Pd nanoparticles depends on the composition: gold-rich nanoparticles presented a lower activity when compared with the palladium-rich nanoparticles, but a maximum of activity (at 60 °C and 80 °C) was reached with 0.5wt%Au0.5wt%Pd bimetallic composition. It could be firstly concluded that the gold-rich samples continue in their alloyed forms with a small increase in surface Pd content, as deduced from the XPS data. Secondly, the Pd-rich samples present metal segregation (Pd rich surface) with an increasing presence of palladium oxide. Surface Pd helps in the adsorption of glucose.13In case of Au–Cu/TiO2 samples the synergetic effect was also observed with the highest activity observed for 0.5%Cu0.5%Au/TiO2 sample at 60 °C. Generally, Au0 is believed to be the active site while, Cu0 plays an important role in activation of oxygen molecules. In our case, four different Cu species were detected. For all Au–Cu bimetallic catalysts the Cu was mostly in Cu0/Cu+ state. A linear correlation between catalytic activity and CuOH and Cu2+ species content was observed which strongly indicated that CuOH species are active sites in the glucose oxidation reaction.
Conflicts of interest
There are no conflicts of interest to declare.Acknowledgements
We gratefully acknowledge Dr Ahmed Addad for providing with HAADF images and Dr Pardis Simon for the XPS analysis. We would like to thank the China Scholarship Council (CSC, 201504490079) for financial support. We also thank the REALCAT platform for providing with reaction and analysis equipment.References
- M. Haruta, T. Kobayashi, H. Sano and N. Yamada, Chem. Lett., 1987, 405–408 CrossRef CAS.
- G. J. Hutchings, J. Catal., 1985, 96, 292–295 CrossRef CAS.
- T. A. G. Silva, E. Teixeira-Neto, N. López and L. M. Rossi, Sci. Rep., 2014, 4, 5766 CrossRef CAS PubMed.
- L. Prati and A. Villa, Catalysts, 2012, 2, 24–37 CrossRef CAS.
- M. Comotti, C. Della Pina, E. Falletta and M. Rossi, Adv. Synth. Catal., 2006, 348, 313–316 CrossRef CAS.
- L. Prati, A. Villa, A. Jouve, A. Beck, C. Evangelisti and A. Savara, Faraday Discuss., 2018, 208, 395–407 RSC.
- G. J. Hutchings, Catal. Today, 2005, 100, 55–61 CrossRef CAS.
- C. L. Bianchi, P. Canton, N. Dimitratos, F. Porta and L. Prati, Catal. Today, 2005, 102–103, 203–212 CrossRef CAS.
- N. Dimitratos, F. Porta, L. Prati and A. Villa, Catal. Lett., 2005, 99, 181–185 CrossRef CAS.
- T. Benkó, A. Beck, K. Frey, D. F. Srankó, O. Geszti, G. Sáfrán, B. Maróti and Z. Schay, Appl. Catal., A, 2014, 479, 103–111 CrossRef.
- T. Haynes, V. Dubois and S. Hermans, Appl. Catal., A, 2017, 542, 47–54 CrossRef CAS.
- R. Wojcieszak, C. P. Ferraz, J. Sha, S. Houda, L. M. Rossi and S. Paul, Catalysts, 2017, 7, 352 CrossRef.
- T. A. G. Silva, C. P. Ferraz, R. V. Gonçalves, E. Teixeira-Neto, R. Wojcieszak and L. M. Rossi, ChemCatChem, 2019, 11, 1–8 CrossRef.
- M. Comotti, C. D. Pina and M. Rossi, J. Mol. Catal. A: Chem., 2006, 251, 89–92 CrossRef CAS.
- H. Zhang and N. Toshima, Appl. Catal., A, 2011, 400, 9–13 CrossRef CAS.
- Y. Cao, X. Liu, S. Iqbal, P. J. Miedziak, J. K. Edwards, R. D. Armstrong, D. J. Morgan, J. Wang and G. J. Hutchings, Catal. Sci. Technol., 2016, 6, 107–117 RSC.
- T. Ishida, N. Kinoshita, H. Okatsu, T. Akita, T. Takei and M. Haruta, Angew. Chem., Int. Ed., 2008, 47, 9265–9268 CrossRef CAS PubMed.
- D. Ferrer, A. Torres-Castro, X. Gao, S. Sepúlveda-Guzmán, U. Ortiz-Méndez and M. José-Yacamán, Nano Lett., 2007, 7, 1701–1705 CrossRef CAS PubMed.
- R. Mu, Q. Fu, H. Xu, H. Zhang, Y. Huang, Z. Jiang, S. Zhang, D. Tan and X. Bao, J. Am. Chem. Soc., 2011, 133, 1978–1986 CrossRef CAS PubMed.
- K. Heidkamp, M. Aytemir, K.-D. Vorlop and U. Prüße, Catal. Sci. Technol., 2013, 3, 2984–2992 RSC.
- S. Hermans, A. Deffernez and M. Devillers, Catal. Today, 2010, 157, 77–82 CrossRef CAS.
- X. Zhang, K. Wilson and A. F. Lee, Chem. Rev., 2016, 116, 12328–12368 CrossRef CAS PubMed.
- A. Villa, D. Wang, G. M. Veith, F. Vindigni and L. Prati, Catal. Sci. Technol., 2013, 3, 3036–3041 RSC.
- Y. Wang and H. Gao, J. Phys. Chem. B, 2017, 121, 2132–2141 CrossRef CAS PubMed.
- R. Wojcieszak, I. M. Cuccovia, M. A. Silva and L. M. Rossi, J. Mol. Catal. A: Chem., 2016, 422, 35–42 CrossRef CAS.
- Y. Cao, S. Iqbal, P. J. Miedziak, D. R. Jones, D. J. Morgan, X. Liu, J. Wang and G. J. Hutchings, J. Chem. Technol. Biotechnol., 2017, 92, 2246–2253 CrossRef CAS.
- M. Zieliński, R. Wojcieszak, S. Monteverdi, M. Mercy and M. M. Bettahar, Catal. Commun., 2005, 6, 777–783 CrossRef.
- A. R. Wilson, K. Sun, M. Chi, R. M. White, J. M. LeBeau, H. H. Lamb and B. J. Wiley, J. Phys. Chem. C, 2013, 117, 17557–17566 CrossRef CAS.
- M. P. Casaletto, A. Longo, A. Martorana, A. Prestianni and A. M. Venezia, Surf. Interface Anal., 2006, 38, 215–218 CrossRef CAS.
- J. F. Moulder, W. F. Stickle, P. E. Sobol and K. D. Bomben, Handbook of X-ray Photoelectron Spectroscopy, Perkin Elmer, Eden Prairie, MN, 1992 Search PubMed.
- E. D. Park and J. S. Lee, J. Catal., 1999, 186, 1–11 CrossRef CAS.
- J. P. Mathew and M. Srinivasan, Eur. Polym. J., 1995, 31, 835–839 CrossRef CAS.
- Ş. Neaţu, J. A. Maciá-Agulló, P. Concepción and H. Garcia, J. Am. Chem. Soc., 2014, 136, 15969–15976 CrossRef PubMed.
- http://https://srdata.nist.gov/xps/main_search_menu.aspx, accessed July 15, 2019.
- I. Onal, D. Düzenli, A. Seubsai, M. Kahn, E. Seker and S. Senkan, Top. Catal., 2010, 53, 92–99 CrossRef CAS.
- A. Amorós-Pérez, L. Cano-Casanova, M. Á. Lillo-Ródenas and M. C. Román-Martínez, Catal. Today, 2017, 287, 78–84 CrossRef.
- Z. Hai, N. El Kolli, D. Bahena, P. Beaunier, M. Yacaman, J. Vigneron, A. Etcheberry, S. Sorgues, C. Colbeau-Justin, J. Chen and H. Remita, J. Mater. Chem. A, 2013, 1, 10829–10835 RSC.
- Q. Jia, D. Zhao, B. Tang, N. Zhao, H. Li, Y. Sang, N. Bao, X. Zhang, X. Xu and H. Liu, J. Mater. Chem. A, 2014, 2, 16292–16298 RSC.
- M. S. Ide and R. J. Davis, Acc. Chem. Res., 2014, 47, 825–833 CrossRef CAS PubMed.
- S. E. Davis, M. S. Ide and R. J. Davis, Green Chem., 2013, 15, 17–45 RSC.
- U. Prüße, S. Heidinger and C. Baatz, Landbauforschung – vTI Agriculture and Forestry Research, 2011, 61(3), 161–174 Search PubMed.
- L. A. Larew and D. C. Johnson, J. Electroanal. Chem. Interfacial Electrochem., 1989, 262, 167–182 CrossRef CAS.
- P. Beltrame, M. Comotti, C. Della Pina and M. Rossi, Appl. Catal., A, 2006, 297, 1–7 CrossRef CAS.
- B. Guan, D. Xing, G. Cai, X. Wan, N. Yu, Z. Fang, L. Yang and Z. Shi, J. Am. Chem. Soc., 2005, 127, 18004–18005 CrossRef CAS PubMed.
- M. M. Schubert, S. Hackenberg, A. C. van Veen, M. Muhler, V. Plzak and R. J. Behm, J. Catal., 2001, 197, 113–122 CrossRef CAS.
- M. M. Schubert, A. Venugopal, M. J. Kahlich, V. Plzak and R. J. Behm, J. Catal., 2004, 222, 32–40 CrossRef CAS.
- B. N. Zope and R. J. Davis, Green Chem., 2011, 13, 3484 RSC.
- M. C. Kung, R. J. Davis and H. H. Kung, J. Phys. Chem. C, 2007, 111, 11767–11775 CrossRef CAS.
- B. N. Zope, S. E. Davis and R. J. Davis, Top. Catal., 2012, 55, 24–32 CrossRef CAS.
- B. N. Zope, D. D. Hibbitts, M. Neurock and R. J. Davis, Science, 2010, 330, 74–78 CrossRef CAS PubMed.
- X. Liu, A. Wang, X. Wang, C.-Y. Mou and T. Zhang, Chem. Commun., 2008, 3187–3189, 10.1039/B804362K.
- C. Della Pina, E. Falletta and M. Rossi, J. Catal., 2008, 260, 384–386 CrossRef CAS.
- S. Thota, Y. Wang and J. Zhao, Mater. Chem. Front., 2018, 2, 1074–1089 RSC.
- X. Liu, A. Wang, L. Li, T. Zhang, C.-Y. Mou and J.-F. Lee, J. Catal., 2011, 278, 288–296 CrossRef CAS.
- W. Zhan, J. Wang, H. Wang, J. Zhang, X. Liu, P. Zhang, M. Chi, Y. Guo, Y. Guo, G. Lu, S. Sun, S. Dai and H. Zhu, J. Am. Chem. Soc., 2017, 139, 8846–8854 CrossRef CAS PubMed.
- C. Ferraz, A. Da Silva, T. Rodrigues, P. Camargo, S. Paul and R. Wojcieszak, Appl. Sci., 2018, 8, 1246 CrossRef.
- M. Yang, L. F. Allard and M. Flytzani-Stephanopoulos, J. Am. Chem. Soc., 2013, 135, 3768–3771 CrossRef CAS PubMed.
- A. G. M. da Silva, H. V. Fajardo, R. Balzer, L. F. D. Probst, A. S. P. Lovón, J. J. Lovón-Quintana, G. P. Valença, W. H. Schreine and P. A. Robles-Dutenhefner, J. Power Sources, 2015, 285, 460–468 CrossRef CAS.
- K. D. Gilroy, A. Ruditskiy, H.-C. Peng, D. Qin and Y. Xia, Chem. Rev., 2016, 116, 10414–10472 CrossRef CAS PubMed.
- D. Kim, C. Xie, N. Becknell, Y. Yu, M. Karamad, K. Chan, E. J. Crumlin, J. K. Nørskov and P. Yang, J. Am. Chem. Soc., 2017, 139, 8329–8336 CrossRef CAS PubMed.
- D. I. Enache, J. K. Edwards, P. Landon, B. Solsona-Espriu, A. F. Carley, A. A. Herzing, M. Watanabe, C. J. Kiely, D. W. Knight and G. J. Hutchings, Science, 2006, 311, 362–365 CrossRef CAS PubMed.
- N. Dimitratos, A. Villa, D. Wang, F. Porta, D. Su and L. Prati, J. Catal., 2006, 244, 113–121 CrossRef CAS.
- W. C. Ketchie, M. Murayama and R. J. Davis, J. Catal., 2007, 250, 264–273 CrossRef CAS.
- L. Kesavan, R. Tiruvalam, M. H. A. Rahim, M. I. bin Saiman, D. I. Enache, R. L. Jenkins, N. Dimitratos, J. A. Lopez-Sanchez, S. H. Taylor, D. W. Knight, C. J. Kiely and G. J. Hutchings, Science, 2011, 331, 195–199 CrossRef CAS PubMed.
- T. A. G. Silva, R. Landers and L. M. Rossi, Catal. Sci. Technol., 2013, 3, 2993–2999 RSC.
- J. Pritchard, L. Kesavan, M. Piccinini, Q. He, R. Tiruvalam, N. Dimitratos, J. A. Lopez-Sanchez, A. F. Carley, J. K. Edwards, C. J. Kiely and G. J. Hutchings, Langmuir, 2010, 26, 16568–16577 CrossRef CAS PubMed.
Footnote |
| † Electronic supplementary information (ESI) available. See DOI: 10.1039/c9ra06001d |
| This journal is © The Royal Society of Chemistry 2019 |

