 Open Access Article
Electrical, magnetic and magnetotransport properties of Na and Mo doped Ca3Co4O9 materials
Uzma
Hira
ab,
Jean-Claude
Grivel
b,
Dennis Valbjørn
Christensen
b,
Nini
Pryds
b and
Falak
Sher
 *a
*a
aDepartment of Chemistry and Chemical Engineering, SBA School of Science and Engineering, Lahore University of Management Sciences (LUMS), Lahore, Pakistan. E-mail: fsher@lums.edu.pk; Tel: +92 42 3560 8131
bDepartment of Energy Conversion and Storage, Technical University of Denmark, Risø DTU, Denmark
First published on 2nd October 2019
Abstract
We report the electrical, magnetic and magnetotransport properties of Na and Mo dual doped Ca3−2xNa2xCo4−xMoxO9 (0 ≤ x ≤ 0.15) polycrystalline samples. The results indicate that the strength of ferrimagnetic interaction decreases with increase in doping, as is evident from the observed decrease in Curie temperatures (TC). The substitution of non-magnetic Mo6+ ions (4d0) in CoO2 layers and the presence of oxygen vacancies are responsible for decrease in ligand field strength, which results in an enhanced magnetization in the low doped x = 0.025 sample due to a change from the low spin to partial high spin electron configuration. The electrical resistivity of samples exhibits a semiconducting-like behavior in the low temperature range, a strongly correlated Fermi liquid-like behavior in the intermediate temperature range, and an incoherent metal-like behavior in the temperature range 210–300 K. All the samples show a large negative magnetoresistance (MR) at low temperature with a maximum MR value of −59% for the x = 0.025 sample at 2 K and 16 T applied field. The MR values follow the observed trend in magnetization at 5 K and sharply increase below the Curie temperatures of the samples, suggesting that the ferrimagnetic interactions are mainly responsible for the decrease in electrical resistivity under an applied magnetic field.
1. Introduction
Layered cobaltites have attracted considerable attention from the scientific community after the discovery of a large thermoelectric (TE) response in NaCo2O4, Bi2Sr2Co2Ox and Ca3Co4O9 compounds.1–3 In this family of cobalt oxides, misfit-layered Ca3Co4O9 is especially interesting due to its structural and chemical stabilities at relatively higher temperatures,4 unusual thermoelectric properties: coexistence of a large Seebeck coefficient and a low metallic-like electrical resistivity,5 and ferrimagnetic or very weak ferromagnetic-like properties at low temperatures.6 In conventional TE materials, a large Seebeck coefficient is associated with low carrier concentrations, typically in the range of ∼1019 cm−3.7 However, the carrier concentration in the Ca3Co4O9 system can reach up to ∼1021 cm−3 and yet it exhibits a significantly large Seebeck coefficient, in the range ∼100–150 μV K−1 at 300 K. The unusual thermoelectric properties of cobaltites may be attributed to the entropy of localized spins,8 the electronic correlations,9 spin and charge frustrations,10 and large effective mass in the vicinity of Mott metal–insulator transition.11 Nevertheless, the interplay between electron correlations and transport properties of cobaltites is a very complex issue and is still not well understood.The crystal structure of Ca3Co4O9 consists of two alternating structural subsystems stacking along the c-axis: rocksalt-type Ca2CoO3 layers (with regular stacking of CaO–CoO–CaO sheets) and CdI2-type CoO2 sheets.3 The two subsystems have the same lattice parameters a, c and β but different b, suggesting a “misfit” between the two subsystems. The b-axis length of rocksalt-type Ca2CoO3 subsystem is referred to as b1 whereas the b-axis length of CdI2-type CoO2 subsystem is labeled as b2.12 The CoO2 sheet consists of two-dimensional triangular lattice of Co ions formed by a network of edge-sharing CoO6 octahedra, and is believed to dominate the transport and magnetic properties of Ca3Co4O9 system. As a consequence of misfit layered structure, this system shows highly anisotropic physical properties.13 It has been reported previously that doping at Ca-site of Ca3Co4O9 only increases/decreases the carrier concentration and has little effect on the band structure of the system.14 On the other hand, doping at Co-site, especially in CoO2 layer, causes large changes in the band structure, transport and magnetic properties.15
In addition to unusual thermoelectric properties, the misfit layered Ca3Co4O9 also exhibits complex and interesting magnetic and magnetotransport properties.4,16 The temperature dependent susceptibility measurements showed two magnetic transitions in Ca3Co4O9 system: a ferrimagnetic transition at 19 K and a spin-state transition around 380 K.17 The Muon spin rotation and relaxation (μSR) experiments revealed the existence of an incommensurate spin-density-wave (IC-SDW) state with onset temperature TSDW ≈ 100 K and transition width ΔT = 70 K. It was reported in literature that the ferrimagnetism is caused by the interlayer coupling whereas the IC-SDW propagates in-plane.18 The electrical resistivity of Ca3Co4O9 showed a metal–insulator (MI) transition at TMI ≈ 80 K with a semiconducting-like behavior below TMI.3 Limelette et al. reported a large negative magnetoresistance of −70% at 9 T applied field in single-crystal Ca3Co4O9.19 The magnetotransport properties of this system were interpreted in terms of superexchange and double exchange mechanisms between Co3+ and Co4+ ions in CoO2 layers. However, the underlying physics of strongly correlated electron properties in Ca3Co4O9 and related cobaltites is still debatable and needs to be explored further.
The electrical transport and magnetic properties of materials are closely related to each other due to the coupling between the charge and spin degrees of freedom. There are few studies on the effect of doping on magnetic and magnetotransport properties of Ca3Co4O9. For example, the substitution of Sr, Y and Bi for Ca was reported to suppress the ferrimagnetism in Ca3Co4O9;18 the substitution of Ti for Co lead to an enhanced spin fluctuation and spin-glass behavior;14 the substitution of Ag for Ca altered the correlated electron properties of Ca3Co4O9;20 and the substitution of rare-earth ions (R3+) resulted in an increase of thermopower (S) due to the enhanced electron correlation.13 In another study, it was reported that magnetic behavior of Ca3Co4O9 changes from a ferrimagnetic to a spin-glass state with Mo doping.21 Although the electrical transport and magnetic properties of materials are closely related to each other due to the coupling between the charge and spin degrees of freedom, there are not many research investigations on the magnetotransport properties of doped Ca3Co4O9 cobaltites. In this context, we have studied the low-temperature magnetization, electrical resistivity and magnetoresistance of Na and Mo dual doped Ca3Co4O9-based ceramic materials.
2. Experimental section
Polycrystalline samples of Ca3-2xNa2xCo4-xMoxO9 (0 ≤ x ≤ 0.15) were prepared by conventional solid-state reaction method. The stoichiometric quantities of CaCO3 (≥99.5%; Sigma-Aldrich), Co3O4 (≥99.5%; Sigma-Aldrich) and Na2MoO4·2H2O (≥99.5%; Sigma-Aldrich) were thoroughly mixed and pressed into pellets and initially sintered at 700 °C for 8 h. The sintered pellets were ground into powders, pressed into pellets again and sintered twice at 900 °C for 8 h, with intermediate grinding and pelletizing, in air at a heating rate of 10 °C min−1 and then cooled down slowly to the room temperature.The powder X-ray diffraction data (XRD) of all samples were collected using a Bruker D8 Advance diffractometer (Bruker, Germany) with Cu Kα (λ = 1.5406 Å) radiation at room temperature. The data were collected over an angular range 5° ≤ 2θ ≤ 65° with a step size of 0.02°. The microstructure of samples was examined with a FEI Nova NanoSEM 450 scanning electron microscope (SEM). The chemical compositions of all the samples were inspected through energy dispersive X-ray spectrometer (EDS, AZtec Oxford) coupled through scanning electron microscope.
Magnetic properties were measured using a cryogen-free vibrating sample magnetometer (VSM). The zero-field cooling (ZFC) and field cooling (FC) magnetizations were measured in the temperature range of 5 to 320 K under an applied field 0.1 T. The magnetic hysteresis loops of all samples were measured at 5 K in the magnetic field range of 0 to ±5 T. The Hall effect measurement setup from the Cryogenics was used to collect the transport data of samples in magnetic fields of up to 16 T and at various temperatures ranging from 2 to 300 K. The samples were cooled down in absence of an applied magnetic field, and the warm-up was performed in steps where the magnetic field was varied from 0 to ±16 T at stabilized temperatures while measuring the magnetoresistance and Hall effect. Samples were contacted electrically at the corners using silver paste, and the van der Pauw method was used to extract the resistivity. In all cases the Hall coefficient was found to be linear.
3. Results and discussion
The crystal structures of Ca3−2xNa2xCo4−xMoxO9 (0 ≤ x ≤ 0.15) samples were analyzed by collecting powder X-ray diffraction data at room temperature. The XRD patterns (Fig. 1(a)) show that all samples are phase pure. All diffraction peaks could be indexed to the standard JCPDS card (21-139) and match well with the previously reported monoclinic crystal symmetry for Ca3Co4O9 system.3,5 The diffraction data was Rietveld analyzed in the super space group X2/m(0b0)s0 using a computer program JANA 2006.22 The refined XRD pattern for Ca2.95Na0.05Co3.975Mo0.025O9 sample is presented in Fig. 1(b) as an example, and the resulting structural parameters are summarized in Table 1. We have observed that diffraction peaks shift to lower angle values with increase in doping content (x). This result is consistent with the fact that ionic radii of the substituent Na+ (1.02 Å) and Mo6+ (0.59 Å) ions are larger than ionic radii of the corresponding Ca2+ (1.00 Å) ions, and Co3+ (0.545 Å)/Co4+ (0.53 Å) ions in the six coordination number, respectively.23Fig. 2 shows the lattice parameters a, b1, b2, c and unit cell volume V1 and V2 as a function of doping content (x). The lattice parameters a, b1, c and unit cell volumes V1 and V2 increase linearly with increase in the doping content of Na and Mo. However, the lattice parameter b2 decreases with increase in dual doping. Overall, the refined cell parameters are in agreement with the observed shifting of diffraction peaks to lower angle values as noted above. The values of quality factors like goodness of fit (GOF), weighted residual (Rwp) and residual of the least-squares refinement (Rp) (Table 1) are all within the acceptable statistical range, suggesting that the Rietveld refinement results are reliable.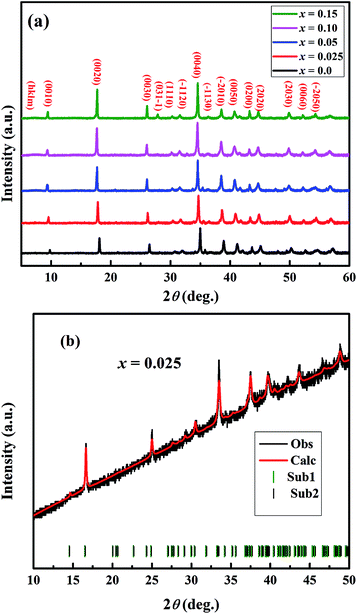 | ||
| Fig. 1 (a) Powder XRD patterns of Ca3−2xNa2xCo4−xMoxO9 (0 ≤ x ≤ 0.15) samples. (b) Rietveld refined powder XRD pattern of x = 0.025 sample. | ||
| Composition Ca3−2xNa2xCo4−xMoxO9 | x = 0.0 | x = 0.025 | x = 0.05 | x = 0.10 | x = 0.15 |
|---|---|---|---|---|---|
| a b 1 and b2 are the b-axis lattice parameter for [Ca2CoO3] and [CoO2] subsystems, respectively. | |||||
| Lattice parameters | |||||
| a (Å) | 4.8229 | 4.8242 | 4.8254 | 4.8324 | 4.8380 |
| b 1 (Å) | 4.5453 | 4.5557 | 4.5607 | 4.5646 | 4.5698 |
| b 2 (Å) | 2.8215 | 2.8210 | 2.820 | 2.8131 | 2.8050 |
| c (Å) | 10.8327 | 10.8350 | 10.8369 | 10.8531 | 10.8621 |
| β (deg.) | 98.807 | 98.202 | 98.120 | 98.110 | 98.031 |
| δ (b1/b2) | 1.61 | 1.61 | 1.62 | 1.62 | 1.63 |
| Volume, V1 (Å)3 | 234.7 | 235.7 | 236.1 | 236.7 | 237.8 |
| Volume, V2 (Å)3 | 145.2 | 146.0 | 146.1 | 146.5 | 147.7 |
![[thin space (1/6-em)]](https://www.rsc.org/images/entities/char_2009.gif) |
|||||
| Reliability factors | |||||
| R wp (%) | 3.99 | 1.93 | 2.75 | 3.89 | 3.90 |
| R p (%) | 3.25 | 1.46 | 2.23 | 3.18 | 3.21 |
| GOF | 3.29 | 1.66 | 2.49 | 2.62 | 2.43 |
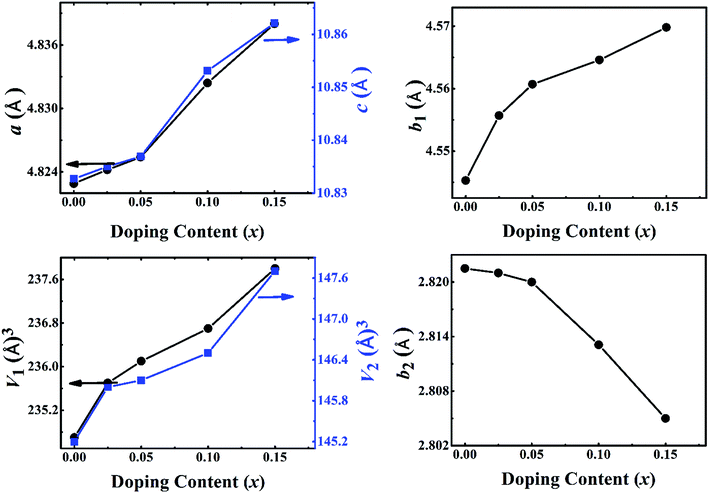 | ||
| Fig. 2 Structural parameters a, b1,b2, c, V1 and V2 as a function of doping content (x) for Ca3−2xNa2xCo4−xMoxO9 (0 ≤ x ≤ 0.15) series. | ||
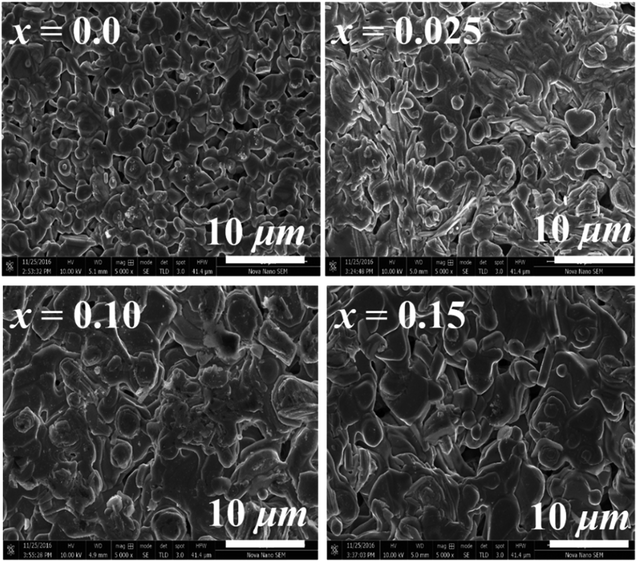
The SEM micrographs (Fig. 3) indicate that particles are well connected with each other and have no specific shape. Similar surface morphology has been reported for samples prepared by the conventional solid-state reaction method in previous research work.5 The average grain size increases from 0.83 μm (x = 0.0) to 4.50 μm (x = 0.15) with increase in doping content (x), which is in keeping with the low melting point of Na2MoO4·2H2O precursor and the expected higher diffusion rate of reacting species at the sintering temperature resulting in larger grain sizes.
The temperature dependence of magnetization (M) in Ca3−2xNa2xCo4−xMoxO9 under zero-field-cooled (ZFC) and field-cooled (FC) modes (5–300 K) at an applied field of 0.1 T are shown in Fig. 4. It is evident from plot that all samples exhibit Curie–Weiss paramagnetic behavior in the high temperature range 30–300 K. Both the ZFC and FC curves for x = 0.0 sample start to rise up sharply as the temperature is decreased below ∼19 K, suggesting a paramagnetic (PM) to ferrimagnetic (FIM) transition. The sharp rise in magnetization curves for doped samples is observed at a lower temperature range 5–7 K. The PM–FIM transition temperatures (TFIM) of samples were estimated from the points of inflection of dM/dT slopes (Fig. 4) and the obtained values are listed in Table 2. The TFIM value for x = 0.0 sample is comparable to the reported data in literature.17 The values of TFIM decrease with increase in doping content (x). We can attribute this trend to the non-magnetic nature of Mo6+ (d0) ions, and the structural distortions with increase in doping as both these factors are expected to weaken the ferromagnetic interactions. The ZFC and FC curves for the undoped sample separate from each other below 19 K which indicates the existence of magnetic inhomogeneity in the long range ferromagnetic ordering. Unlike some of the previous research studies,21,24,25 our doped samples do not show any separation between the ZFC and FC curves in the measured temperature range 5–300 K. This observation suggests the absence of spin-glass (SG) or cluster-glass (CG) state in these samples. It is important to mention that these samples may show divergence between the ZFC and FC curves at temperatures well below the PM–FIM transition.
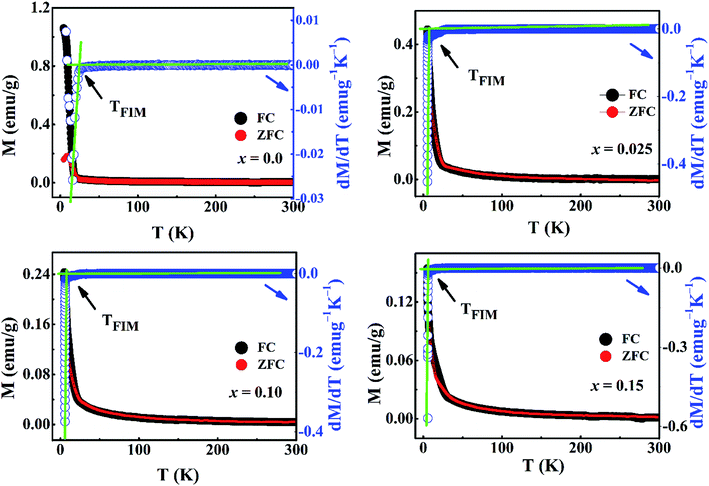 | ||
| Fig. 4 The temperature dependent zero-field-cooled (ZFC) and field-cooled (FC) magnetizations, along with slope dM/dT, for Ca3−2xNa2xCo4−xMoxO9 (0 ≤ x ≤ 0.15) samples at 0.1 T applied magnetic field. | ||
| Composition (x) | T FIM (K) | C (emu K mol−1) | θ P (K) | μ B (μB) | M S (kOe) at 5 K | M r (emu g−1) at 5 K | M 5 K (emu g−1) |
|---|---|---|---|---|---|---|---|
| 0.0 | 19.0 | 0.2113 | −55 | 1.30 | 190.0 | 2.25 | 4.64 |
| 0.025 | 6.7 | 0.6925 | −42 | 2.35 | 24.21 | 0.63 | 6.30 |
| 0.10 | 6.3 | 0.5320 | −48 | 2.06 | 21.99 | 0.47 | 4.96 |
| 0.15 | 5.3 | 0.3258 | −60 | 1.61 | 17.04 | 0.20 | 4.85 |
Fig. 5 shows the magnetic field dependent magnetization (M–H) curves (hysteresis loops) for all samples at 5 K. The maximum magnetization (M5 K), coercivity (HC) and remanent magnetization (Mr) of samples are listed in Table 2. It is evident that the magnetization does not saturate even at applied fields of up to 5 T, which suggests the presence of canted ferrimagnetism in our samples. The M–H curve of undoped sample exhibits a clear hysteresis loop, but it becomes smaller with increase in doping. The observed decrease in both coercivity and remanent magnetization suggests that our samples are becoming soft ferromagnet with Na and Mo dual doping. Similar results were reported in literature for In-doped Ca3Co4O9 samples.26 The values of M5 K for all doped samples are higher than undoped Ca3Co4O9 system, with a maximum value of 6.30 emu g−1 for x = 0.025 sample. As reported previously, ferrimagnetism in Ca3Co4O9 is caused by the interlayer coupling between Ca2CoO3 and CoO2 subsystems.5,27 Both the superexchange and double exchange interactions between Co3+ and Co4+ ions were considered to coexist in CoO2 layers. The substitution of Fe, Mn, In or Mo in Ca3Co4O9 was found to suppress the interlayer coupling and result in decrease of magnetization.5,21,27 We believe that compositional inhomogeneities and presence of oxygen vacancies, which may be induced by the substitution of higher valent Mo6+ ions at Co-sites in Ca3Co4O9 system, are responsible for the observed increase in M5 K values in our doped samples, especially x = 0.025, as discussed in the next paragraph.
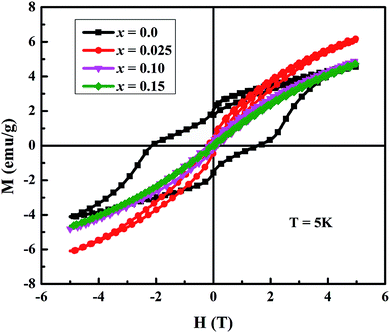 | ||
| Fig. 5 The magnetization vs. applied magnetic field plots of Ca3−2xNa2xCo4−xMoxO9 (0 ≤ x ≤ 0.15) samples at 5 K. | ||
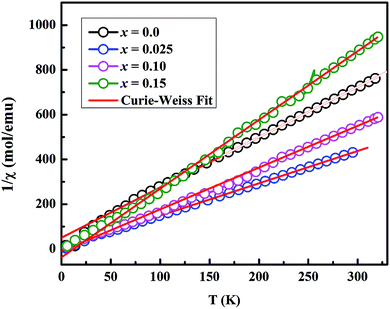
In order to analyze the magnetic data quantitatively, we fitted the inverse magnetic susceptibility with a Curie–Weiss law (Fig. 6), χ = C /(T − θP), where χ is the molar magnetic susceptibility, C is the Curie constant, and θP is the Weiss temperature. The values of effective magnetic moment, μeff were calculated using the values of C obtained from the slopes of linear fits in Fig. 6. The obtained values of θP and μeff per Co ion are listed in Table 2. The negative values of θP suggest the presence of antiferromagnetic (or ferrimagnetic) interactions in these materials. The value of μeff = 1.30 μB for x = 0.0 sample is comparable to the literature data for Ca3Co4O9 system.17 However, the μeff values of 2.35, 2.06, and 1.61 μB per Co for x = 0.025, 0.10 and 0.15 samples respectively are higher than the undoped sample. We can discuss the observed magnetic moment data in terms of the average valence state of the Co in these materials. As we know, the electron configurations of Co2+, Co3+ and Co4+ ions are 3d7, 3d6 and 3d5 respectively. In an octahedral crystal field splitting between t2g and eg states, Co ions can have either the high spin (HS) or low spin (LS) electron configuration. The HS electron configuration for Co2+, Co3+ and Co4+ ions corresponds to t2g5eg2 (S = 3/2, μeff = 3.87 μB), t2g4eg2 (S = 2, μeff = 4.90 μB) and t2g3eg2 (S = 5/2, μeff = 5.92 μB) respectively whereas the LS electron configuration for these ions gives t2g6eg1 (S = 1/2, μeff = 1.73 μB), t2g6eg0 (S = 0, μeff = 0 μB) and t2g5eg0 (S = 1/2, μeff = 1.73 μB) respectively. In previous studies, it has been reported that the average valence state of Co ions in Ca3Co4O9 system is between +3 and +4, and both Co3+ and Co4+ ions are predicted to be in LS state.3,5,26 Using this information, the calculated values of μeff for our doped samples, especially x = 0.025, could be explained by considering an intermediate spin or partial high spin electron configuration for Co3+ and Co4+ ions. This is also consistent with the low temperature (5 K) magnetization values of doped samples under an applied field of 5 T as shown in Fig. 5. We can attribute this change, from LS to partial HS electron configuration, to oxygen vacancies and the substitution of Mo6+ ions in CoO2 layers. The presence of oxygen vacancies would reduce the ligand field strength and therefore promote electrons to eg states. As the number of oxygen vacancies does not change linearly with doping, the substitution of higher concentrations of non-magnetic Mo6+ ions (4d0) would result in decrease of magnetic moment.
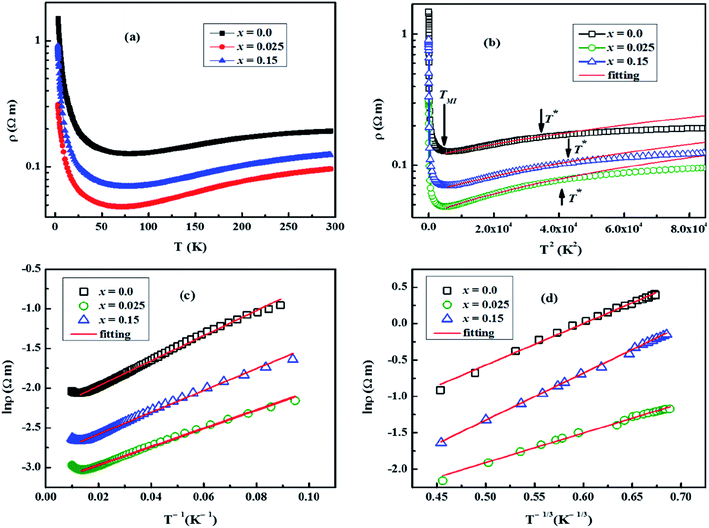
The electrical resistivity (ρ) of samples was measured as a function of temperature (2–300 K) under zero magnetic field and the obtained data are shown in Fig. 7(a). As reported elsewhere,5,28,29 the electrical resistivity of our samples can be divided into three distinct transport regimes in the measured temperature range. In the low temperature range, the electrical resistivity shows insulating behavior characterized by a negative slope (dρ/dT < 0) up to a broad minimum around the metal–insulator transition temperature (TMI), implying the existence of IC-SDW state.18 As the temperature is further increased, the electrical resistivity exhibits metallic behavior (dρ/dT > 0) with two different regimes. The first one is identified as a strongly correlated Fermi liquid regime, up to the temperature T*, with the electrical resistivity varying as ρ = ρ0 + AT2 (Fig. 7(b)), and the second one is known as an incoherent metal (or “bad metal”) regime.27 In this description, T* is the transition temperature from Fermi liquid to incoherent metal, ρ0 is the residual resistivity owing to the domain boundaries and other temperature-independent scattering mechanisms,30A is called the Fermi liquid transport coefficient, and AT2 refers to the electron–electron scattering mechanism of carriers. It has been observed that overall shapes of ρ–T curves remain almost the same, but the values of ρ, TMI and T* change with increase in doping (Table 3). It is found that ρ initially decreases with low doping (x = 0.025) and then increases with further increase in Na and Mo dual doping. We can explain this trend by variations in the particle size, carrier concentration (n), carrier mobility (μ), structural distortions, and oxygen vacancies with increase in doping. The longitudinal resistivity, ρ is a reciprocal of electrical conductivity, σ and is given by: ρ−1 = σ = neμ, where n, μ and e are the carrier concentration, carrier mobility and elementary charge, respectively. Compared to other samples, x = 0.025 has higher values of n and μ, and reasonably large average particle size, and therefore it has the lowest resistivity in this series. The values of n and μ decrease with further increase in doping content (x), and consequently the electrical resistivity increases for larger x values. The presence of oxygen vacancies and structural distortions play a detrimental role in the transport mechanism, and therefore may also be contributing factors in the observed increase of electrical resistivity for heavily doped samples.
| Composition (x) | 0.0 | 0.025 | 0.10 | 0.15 |
| ρ (300 K) (10−5 Ω m) | 22.5 | 10.5 | 14.0 | 16.0 |
| n (300 K) (1019 cm−3) | 5.09 | 6.39 | 5.23 | 3.71 |
| μ (300 K) (cm2 V−1 s−1) | 0.64 | 1.02 | 0.963 | 0.78 |
| T MI (K) | 88 | 73 | — | 76 |
| T* (K) | 186 | 202 | — | 206 |
| A (Ω m K−2) | 1.44 × 10⁻⁶ | 8.97 × 10⁻⁷ | — | 1.03 × 10⁻⁶ |
| ΔE (meV) | 1.36 | 1.18 | — | 0.99 |
| T o (K) | 67.1 | 269.6 | — | 186.2 |
| m*/mo | 9.83 | 8.94 | — | 8.74 |
| MR (%) at 2 K & 16 T | −34 | −59 | — | −49 |
| MR (%) at 2 K & 7 T | −30 | −55 | — | −46 |
In order to investigate the effect of dual doping on electronic correlation in the Fermi liquid regime, we plotted ρ(T) versus T2 as shown in Fig. 7(b). The obtained fitting parameters of A (slope) and T* (the end temperature on the ρ–T2 linear fit) are listed in Table 3. The values of TMI were taken as the temperature at which dρ/dT slope on ρ–T curves is equal to zero. It is found that the values of A and TMI initially decrease for low doping (x = 0.025 sample) and then slightly increase with higher doping content (x). On the other hand, the values of T* increase with increase in doping. The estimated values of A for all samples are comparable to the ones measured in heavy fermion compounds as reported elsewhere.29 According to the dynamical mean field theory (DMFT) picture of the Fermi liquid,5,31 a key role of effective mass m* is predicted with A ∼ (m*)2 and T* ∼ 1/m*. Compared to the undoped sample, the observed decrease in values of A and increase of T* both predict a decrease of m* with doping. These results imply that the bandwidth of these compounds is increasing, and the electronic correlation is weakening with increase in doping.5
In order to investigate the effect of dual doping on strongly correlated electronic properties of these materials, we now look at the possible transport mechanisms. The temperature dependent electrical resistivity of cobaltites follows the thermally activated transport mechanism in the low-temperature insulating regime, as reported in literature.32,33 It is given by
 | (1) |
As mentioned above, the thermally activated conduction mechanism does not model the ρ(T) data of our samples well below ∼15 K. The Mott's two-dimensional variable range hopping model (2D VRH) gives the best fitting to the low-temperature ρ(T) data. According to the 2D VRH model, the relation between electrical resistivity and temperature can be expressed as
 | (2) |
![[thin space (1/6-em)]](https://www.rsc.org/images/entities/char_2009.gif) ρ(T) versus T−1/3 (Fig. 7(d)) shows that 2D VRH model fits well to the low-temperature, below 15 K, ρ(T) data. The values of fitted parameter T0 for samples are listed in Table 3. We can see that the values of T0 are larger for doped samples than the undoped Ca3Co4O9 system, which implies that the values of localization length lv are smaller for doped samples. The reduction of localization length indicates stronger carrier localization or decreased carrier mobility in these materials. Similar results have been reported in previous studies on doped Ca3Co4O9 system as well.5,27 The VRH mechanism is two-dimensional, rather than the usual three-dimensional as found in many isotropic semiconductors, due to the anisotropic layered structure of these cobaltites. Moreover, the carriers gain sufficient energy as the temperature is increased, and the transport mechanism gradually changes from 2D VRH to thermally activated conduction.36
ρ(T) versus T−1/3 (Fig. 7(d)) shows that 2D VRH model fits well to the low-temperature, below 15 K, ρ(T) data. The values of fitted parameter T0 for samples are listed in Table 3. We can see that the values of T0 are larger for doped samples than the undoped Ca3Co4O9 system, which implies that the values of localization length lv are smaller for doped samples. The reduction of localization length indicates stronger carrier localization or decreased carrier mobility in these materials. Similar results have been reported in previous studies on doped Ca3Co4O9 system as well.5,27 The VRH mechanism is two-dimensional, rather than the usual three-dimensional as found in many isotropic semiconductors, due to the anisotropic layered structure of these cobaltites. Moreover, the carriers gain sufficient energy as the temperature is increased, and the transport mechanism gradually changes from 2D VRH to thermally activated conduction.36
We have measured the electrical resistivity of three samples (x = 0.0, 0.025 and 0.5) using a standard four-probe method as a function of applied magnetic field. Fig. 8 shows the field-dependent MR[={ρ(H) − ρ(0)}/ρ(0)] data of samples at various temperatures in magnetic fields up to 16 T. A large negative MR is observed in all samples (Table 3), which is comparable to the reported values in single crystal Ca3Co4O9 system. The x = 0.025 sample shows especially very large negative MR value of −59% at ∼2 K and 16 T applied field. This is consistent with the observed larger magnetization of this sample. The large negative MR is a result of reduced spin scattering in the ferromagnetic state, which reflects a spin polarized electronic transport. The reduction of spin scattering originates from the strong electron correlation, which can be anticipated to increase below the ferrimagnetic transition. Our samples show noticeable magnetoresistances at all temperatures below ∼50 K and the values of MR increase with decrease in temperature, with a maximum MR value at 2 K. This is unlike the colossal magnetoresistances observed in manganites35 and LnBaCo2O5+δ,37 where a maximum of MR occurs near their Curie temperature or the metal-to-insulator transition temperature. This indicates that ferromagnetic interactions are weak in these materials. The negative MR increases abruptly below the relevant Curie temperature of samples. These results suggest that the ferrimagnetic correlation in the conducting layers is mainly responsible for the observed large negative MR in these materials.
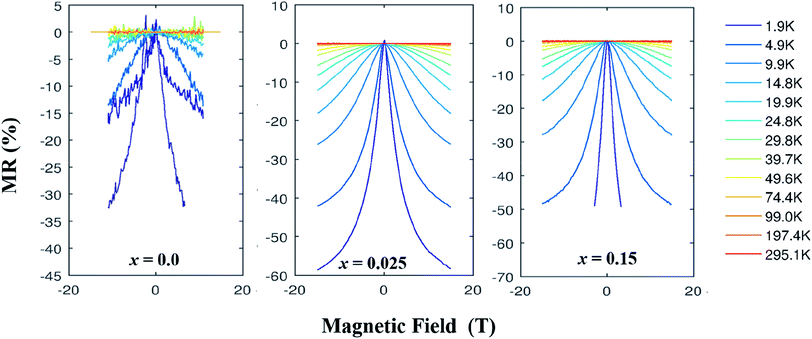 | ||
| Fig. 8 MR (%) vs. applied field plots for Ca3−2xNa2xCo4−xMoxO9 (0 ≤ x ≤ 0.15) samples at different temperatures. | ||
4. Conclusions
We have investigated the effect of Na and Mo dual doping on magnetization, electrical resistivity and magnetoresistance of Ca3−2xNa2xCo4−xMoxO9 (0 ≤ x ≤ 0.15) samples. The ZFC and FC curves reveal that the paramagnetic to ferrimagnetic transition temperature decreases with increase in doping content (x), indicating weakening of ferromagnetic interactions with increasing x. The observed increase in magnetization at low doping level can be attributed to change from low spin to partial high spin electron configuration with the substitution of non-magnetic Mo6+ ions (4d0) in CoO2 layers. The electrical resistivity of samples exhibits insulating behavior at low temperature, strongly correlated Fermi liquid type metallic behavior in the intermediate temperature range, and incoherent metal type behavior in the high temperature range. The strongly correlated electronic properties of these materials can be modeled by the Mott's two-dimensional variable range hopping model below ∼15 K, thermally activated transport mechanism in the temperature range 15–60 K, and the relation ρ = ρ0 + AT2 in the Fermi liquid regime. The values of electrical resistivity follow the observed trend in carrier concentration, carrier mobility and particle size of doped samples. Large negative MR has been observed in all samples with a maximum value of −59% for x = 0.025 sample at 2 K and 16 T applied field. The sharp increase in MR below Curie temperature indicates that the ferrimagnetic interaction in the conducting layers is mainly responsible for the observed large negative magnetoresistances in these materials.Conflicts of interest
There is no conflict of interest to declare.Acknowledgements
We are thankful to the Higher Education Commission (HEC) of Pakistan (Grant no: 1981), and the International Research Support Initiative Program of HEC for providing financial support. UH is grateful to the Department of Energy Conversion and Storage, Technical University of Denmark (DTU) for supporting her research visit at DTU.References
- I. Terasaki, Y. Sasago and K. Uchinokura, Phys. Rev. B: Condens. Matter Mater. Phys., 1997, 56, R12685 CrossRef CAS.
- F. Funahashi, I. Matsubara and S. Sodeoka, Appl. Phys. Lett., 2000, 76, 2385 CrossRef.
- A. C. Masset, C. Michel, A. Maignan, M. Hervieu, O. Toulemonde, F. Studer, B. Reveau and J. Hejtmanek, Phys. Rev. B: Condens. Matter Mater. Phys., 2000, 62, 166 CrossRef CAS.
- H. Ohta, K. Sugiura and K. Koumoto, Inorg. Chem., 2008, 47, 8429 CrossRef CAS.
- Y. Wang, Y. Sui, P. Ren, L. Wang, X. Wang, W. Su and H. Fan, Chem. Mater., 2010, 22, 1155 CrossRef CAS.
- A. Pautrat, H. W. Eng and W. Prellier, Phys. Rev. B: Condens. Matter Mater. Phys., 2005, 72, 233405 CrossRef.
- G. D. Mahan, Solid State Phys., 1979, 51, 81 Search PubMed.
- W. Koshibae, K. Tsutsui and S. Maekawa, Phys. Rev. B: Condens. Matter Mater. Phys., 2000, 62, 6869 CrossRef CAS.
- P. Limelette, S. Hébert, V. Hardy, R. Frésard, C. Simon and A. Maignan, Phys. Rev. Lett., 2006, 97, 046601 CrossRef CAS.
- O. I. Motrunich and P. A. Lee, Phys. Rev. B: Condens. Matter Mater. Phys., 2004, 69, 214516 CrossRef.
- G. Pálsson and G. Kotliar, Phys. Rev. Lett., 1998, 80, 4775 CrossRef.
- U. Hira, L. Han, K. Norrman, D. V. Christensen, N. Pryds and F. Sher, RSC Adv., 2018, 8, 12211 RSC.
- J. Sugiyama, C. Xia and T. Tani, Phys. Rev. B: Condens. Matter Mater. Phys., 2003, 67, 104410 CrossRef.
- Y. Wang, L. Xu, Y. Sui, X. Wang, J. Cheng and W. Su, Appl. Phys. Lett., 2010, 97, 062114 CrossRef.
- B. C. Zhao, Y. P. Sun, W. J. Lu, X. B. Zhu and W. H. Song, Phys. Rev. B: Condens. Matter Mater. Phys., 2006, 74, 144417 CrossRef.
- T. Yamamoto, K. Uchinokura and I. Tsukada, Phys. Rev. B: Condens. Matter Mater. Phys., 2002, 65, 184434 CrossRef.
- J. Sugiyama, J. H. Brewer, E. J. Ansaldo, H. Itahara, K. Dohmae, Y. Seno, C. Xia and T. Tani, Phys. Rev. B: Condens. Matter Mater. Phys., 2003, 68, 134423 CrossRef.
- J. Sugiyama, H. Itahara, T. Tani, J. H. Brewer and E. J. Ansaldo, Phys. Rev. B: Condens. Matter Mater. Phys., 2002, 66, 134413 CrossRef.
- P. Limelette, J. C. Soret, H. Muguerra and D. Grebille, Phys. Rev. B: Condens. Matter Mater. Phys., 2008, 77, 245123 CrossRef.
- Y. Wang, Y. Sui, J. G. Cheng, X. J. Wang and W. H. Su, J. Phys.: Condens. Matter, 2007, 19, 356216 CrossRef.
- Y. Fu, B. Zhao, Y. Huang, J. Yang, J. Dai, M. Zhou and Y. Sun, Solid State Commun., 2011, 151, 933 CrossRef CAS.
- M. D. Petricek and L. Palatinous, JANA2006, The Crstallographic Computing System, Institute of Physics, Praha, Czech Republic, 2006 Search PubMed.
- R. D. Shannon, Acta Crystallogr., Sect. A: Cryst. Phys., Diffr., Theor. Gen. Crystallogr., 1976, 32, 751 CrossRef.
- B. C. Zhao, Y. P. Sun and W. H. Song, J. Appl. Phys., 2006, 99, 073906 CrossRef.
- Y. Huang, B. Zhao, R. Ang, S. Lin, W. Song and Y. Sun, J. Alloys Compd., 2013, 574, 233 CrossRef CAS.
- Y. Huang, B. Zhao, R. Ang, S. Lin, Z. Huang, L. Yin, S. Tan, Y. Liu, W. Song and Y. Sun, J. Am. Ceram. Soc., 2013, 96, 791 CrossRef CAS.
- Y. Wang, Y. Sui, J. Cheng, X. Wang, W. Su, X. Liu and H. J. Fan, J. Phys. Chem. C, 2010, 114, 5174 CrossRef CAS.
- M. Shikano and R. Funahashi, Appl. Phys. Lett., 2003, 82, 1851 CrossRef CAS.
- P. Limelette, V. Hardy, P. Auban-Senzier, D. Jérome, D. Flahaut, S. Hebert, R. Frésard, C. Simon, J. Noudem and A. Maignan, Phys. Rev. B: Condens. Matter Mater. Phys., 2005, 71, 233108 CrossRef.
- P. Schiffer, A. P. Ramirez, W. Bao and S.-W. Cheong, Phys. Rev. Lett., 1995, 75, 3336 CrossRef CAS.
- A. Georges, G. Kotliar, W. Krauth and M. J. Rozenberg, Rev. Mod. Phys., 1996, 68, 13 CrossRef CAS.
- U. Hira, N. Pryds and F. Sher, J. Electron. Mater., 2019, 48, 4618 CrossRef CAS.
- T. Fujii and I. Terasaki, Chemistry, Physics, and Materials Science of Thermoelectric Materials: Beyond Bismuth Telluride, Kluwer Academic/Plenum Publishers, New York, 2003 Search PubMed.
- G. Yang, Q. Ramasse and R. F. Klie, Phys. Rev. B: Condens. Matter Mater. Phys., 2008, 78, 153109 CrossRef.
- J. L. Lan, Y. H. Lin, G. J. Li, S. L. Xu, Y. Liu, C. W. Nan and S. Zhao, Appl. Phys. Lett., 2010, 96, 192104 CrossRef.
- B. Raveau, A. Maignan, C. Martin and M. Hervieu, Chem. Mater., 1998, 10, 2641 CrossRef CAS.
- C. Martin, A. Maignan, D. Pelloquin, N. Nguyen and B. Raveau, Appl. Phys. Lett., 1997, 71, 1421 CrossRef CAS.
| This journal is © The Royal Society of Chemistry 2019 |

