 Open Access Article
Effect of template type on the preparation of the emeraldine salt form of polyaniline (PANI-ES) with horseradish peroxidase isoenzyme C (HRPC) and hydrogen peroxide†
Tomoyuki Fujisaki ab,
Keita Kashima
 ab,
Sandra Serrano-Luginbühla,
Reinhard Kissner
 c,
Danica Bajuk-Bogdanović
 d,
Maja Milojević-Rakićd,
Gordana Ćirić-Marjanović
 d,
Stephan Busato
 e,
Erlantz Lizundia
 afg and
Peter Walde
 *a
*a
aDepartment of Materials, Laboratory for Multifunctional Materials, ETH Zurich, Vladimir-Prelog-Weg 5, 8093 Zürich, Switzerland. E-mail: peter.walde@mat.ethz.ch
bDepartment of Materials Chemistry and Bioengineering, National Institute of Technology, Oyama College, 771 Ohaza-Nakakuki, Oyama, Tochigi 323-0806, Japan
cDepartment of Chemistry and Applied Biosciences, Laboratory of Inorganic Chemistry, Vladimir-Prelog-Weg 2, 8093 Zürich, Switzerland
dFaculty for Physical Chemistry, University of Belgrade, Studentski trg 12-16, 11158 Belgrade, Serbia
eDepartment of Materials, Laboratory for Soft Materials, ETH Zurich, Vladimir-Prelog-Weg 5, 8093 Zürich, Switzerland
fDepartment of Graphic Design and Engineering Projects, Bilbao Faculty of Engineering, University of the Basque Country (UPV/EHU), Bilbao 48103, Spain
gBCMaterials, Basque Center for Materials, Applications and Nanostructures, UPV/EHU Science Park, 48940 Leioa, Spain
First published on 16th October 2019
Abstract
Horseradish peroxidase isoenzyme C (HRPC) is often used as catalyst for the preparation of the conductive emeraldine salt form of polyaniline (PANI-ES) from aniline and hydrogen peroxide (H2O2) in the presence of anionic templates in aqueous solution. Here, a direct comparison of three types of soft templates was made, (i) the sodium salt of sulfonated polystyrene (SPS), (ii) micelles from sodium dodecylbenzenesulfonate (SDBS), and (iii) vesicles from either a 1![[thin space (1/6-em)]](https://www.rsc.org/images/entities/char_2009.gif) :
:![[thin space (1/6-em)]](https://www.rsc.org/images/entities/char_2009.gif) 1 molar mixture of SDBS and decanoic acid or from AOT (sodium bis(2-ethylhexyl)sulfosuccinate). Based on UV/vis/NIR, EPR and Raman spectroscopy measurements all three types of templates are similarly suitable, with advantages of the two vesicle systems in terms of aniline conversion degree and radical content in the final PANI-ES product. First experiments with sulfated cellulose nanocrystals (CNCs) indicate that they are promising rigid templates for the preparation of electroconductive PANI-ES-coated cellulose materials or devices.
1 molar mixture of SDBS and decanoic acid or from AOT (sodium bis(2-ethylhexyl)sulfosuccinate). Based on UV/vis/NIR, EPR and Raman spectroscopy measurements all three types of templates are similarly suitable, with advantages of the two vesicle systems in terms of aniline conversion degree and radical content in the final PANI-ES product. First experiments with sulfated cellulose nanocrystals (CNCs) indicate that they are promising rigid templates for the preparation of electroconductive PANI-ES-coated cellulose materials or devices.
1. Introduction
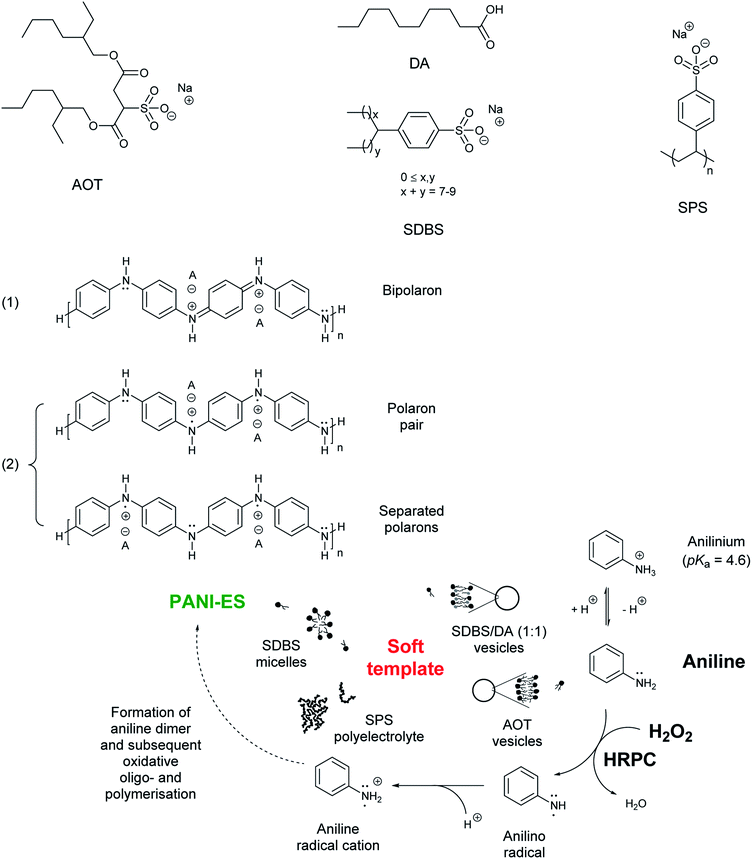
Despite its simple chemical structure, the oxidation of aniline often results in the formation of complex heterogeneous mixtures consisting of oligomeric and/or polymeric products whose composition, chemical structures, degree of oligo- or polymerisation, oxidation states and the resulting product morphologies depend on the conditions under which the oxidation is carried out.1–11 One of the challenges is to find reaction conditions for obtaining exclusively – or as dominating product – polyaniline (PANI) molecules in their linear, electroconductive, emeraldine salt form, abbreviated as PANI-ES.1,2,12–16 The ideal PANI-ES molecules consist of tetraaniline repeating units in their half-reduced and half-oxidised, protonated state, see Scheme 1. The chemical structure of the counter anion (also called dopant, A− in Scheme 1) has an influence on the conductivity and processibility of materials prepared from PANI-ES molecules.17 Bulky dopants with sulfonate groups were found to be particularly good dopants to improve the dispersibility of PANI-ES in water, e.g., camphor sulfonate18,19 or bis(2-ethylhexyl)sulfosuccinate (the sodium salt is known as AOT, Scheme 1).20,21 Standard methods for preparing PANI-ES are based on the chemical oxidation of aniline with a strong oxidant (e.g. ammonium peroxodisulfate) at strongly acidic conditions (pH < 2.5).1,22In 1998/1999 the HRP/H2O2-catalysed polymerisation of aniline to PANI-ES was attempted as environmentally friendly approach, and it was shown that the presence of anionic additives, so-called “templates” is important for obtaining products with PANI-ES features.23–25 The templates are additives which have a positive influence on the desired outcome of the reaction in terms of chemical structure and colloidal product stability (and processability), acting in the case of PANI-ES formation also as counter ions (dopants). The first template used was sulfonated polystyrene (SPS) and the reaction was carried out successfully at pH = 4.0 or 4.3 and at room temperature (RT).24,25 Since this pioneering work, SPS26,27 and other anionic polyelectrolytes28–30 were used by different research groups with variation of the type of peroxidase and experimental conditions. In terms of template type, micelles formed from sodium dodecylbenzenesulfonate (SDBS)26,31 or other related amphiphiles,32 and vesicles from a 1![[thin space (1/6-em)]](https://www.rsc.org/images/entities/char_2009.gif) :
:![[thin space (1/6-em)]](https://www.rsc.org/images/entities/char_2009.gif) 1 molar mixture of SDBS and decanoic acid (DA)33 or from AOT34–37 were found to be particularly promising. For the chemical structures, see Scheme 1. Although micelles and vesicles differ from polyelectrolytes, in the sense that they are polymolecular assemblies, which are constituted by amphiphilic molecules and only form above a certain critical concentration, both mentioned amphiphilic molecules, SDBS and AOT, have a sulfonate head group, and their micellar/vesicular self-assemblies are rich in sulfonate groups, similarly to the many sulfonate groups present in a single SPS molecule. In a broader sense, all three templates are soft, dynamic “sulfonate clusters”. “Non-clustered” sulfonate groups do not act as templates.31,35
1 molar mixture of SDBS and decanoic acid (DA)33 or from AOT34–37 were found to be particularly promising. For the chemical structures, see Scheme 1. Although micelles and vesicles differ from polyelectrolytes, in the sense that they are polymolecular assemblies, which are constituted by amphiphilic molecules and only form above a certain critical concentration, both mentioned amphiphilic molecules, SDBS and AOT, have a sulfonate head group, and their micellar/vesicular self-assemblies are rich in sulfonate groups, similarly to the many sulfonate groups present in a single SPS molecule. In a broader sense, all three templates are soft, dynamic “sulfonate clusters”. “Non-clustered” sulfonate groups do not act as templates.31,35
The aim of the first part of the work presented here was to make a direct comparison of the effect of four different soft sulfonate templates, which were used so far in the literature for the HRP/H2O2-catalysed oxidation of aniline towards the formation of products which have a high content of PANI-ES repeating units. The templates used in our work were the polyelectrolyte SPS, micelles formed from SDBS, and vesicles formed either from a 1![[thin space (1/6-em)]](https://www.rsc.org/images/entities/char_2009.gif) :
:![[thin space (1/6-em)]](https://www.rsc.org/images/entities/char_2009.gif) 1 (mol mol−1) mixture of SDBS and DA or from AOT. All reactions were carried out at pH = 4.3 and at RT (T ≈ 25 °C), and for all reactions the same batch of HRP isoenzyme C (HRPC) was used. Furthermore, for each template type, the best template concentration was first determined. The reaction mixtures were analysed by in situ UV/vis/NIR, electron paramagnetic resonance (EPR), and Raman spectroscopy measurements, and the optimised, as-obtained solutions and dispersions were tested for their inkjet-printability. Finally, we investigated for the first time whether sulfated cellulose nanocrystals (abbreviated as CNCs), rod-like nanoscale particles which can be obtained upon a controlled hydrolysis of cellulose with sulfuric acid,38–40 could also be used as rigid template; and if this would be the case, how the performance of this rigid sulfate template would compare with the four chosen soft sulfonate templates.
1 (mol mol−1) mixture of SDBS and DA or from AOT. All reactions were carried out at pH = 4.3 and at RT (T ≈ 25 °C), and for all reactions the same batch of HRP isoenzyme C (HRPC) was used. Furthermore, for each template type, the best template concentration was first determined. The reaction mixtures were analysed by in situ UV/vis/NIR, electron paramagnetic resonance (EPR), and Raman spectroscopy measurements, and the optimised, as-obtained solutions and dispersions were tested for their inkjet-printability. Finally, we investigated for the first time whether sulfated cellulose nanocrystals (abbreviated as CNCs), rod-like nanoscale particles which can be obtained upon a controlled hydrolysis of cellulose with sulfuric acid,38–40 could also be used as rigid template; and if this would be the case, how the performance of this rigid sulfate template would compare with the four chosen soft sulfonate templates.
The first part of this work is directly related to our previous work on the effect of different soft template types on the Trametes versicolor laccase (TvL)/O2-catalysed oligomerisation of the linear para-NC-coupled aniline dimer PADPA (p-aminodiphenylamine) to oligo(PADPA), carried out at pH = 3.5 and T ≈ 25 °C.41 This previous work was also aimed at obtaining products with a high content of PANI-ES repeating units. In the present work we wanted to know whether the template which appeared most ideal among the tested template types for the PADPA/TvL/O2 reaction, AOT vesicles,41 is also the “best” one for the aniline/HRPC/H2O2 reaction. Finally, we show first evidences on the use of CNC as rigid template for the synthesis of PANI-ES.
2. Materials and methods
2.1. Commercial materials
Horseradish peroxidase isoenzyme C (HRPC, product PEO-131, Grade I, 287 U mg−1, RZ ≥ 3, lot number 2131616000) was from Toyobo Enzymes and aniline (M = 93.13 g mol−1; 99.8%) was from Acros Organics. Acetonitrile (≥99.5%). Docusate sodium salt (=bis(2-ethylhexyl) sulfosuccinate sodium salt, aerosol OT, AOT, M = 444.56 g mol−1, BioUltra ≥ 99.0%), poly(sodium 4-styrenesulfonate) (SPS, average Mw = 70![[thin space (1/6-em)]](https://www.rsc.org/images/entities/char_2009.gif) 000 g mol−1), microcrystalline cellulose (μ-cellulose) with a particle size of 20 μm, sodium phosphate monobasic (NaH2PO4, ≥99.0%), hydrogen peroxide (for analysis, 35 wt% solution in water, corresponding to 11.4 mol L−1), hydrochloric acid, (HCl, ≥37%), sulfuric acid (95–98%), pinacyanol chloride (2,2′-trimethinequinocyanine chloride, M = 388.9 g mol−1), and chloroform (≥99.0%) were purchased from Sigma-Aldrich. Dodecylbenzenesulfonic acid sodium salt (hard type) (SDBS, M = 348.48 g mol−1; >95%) was from TCI Europe. ortho-Phosphoric acid (H3PO4, 85%), decanoic acid (DA, M = 172.26 g mol−1; ≥99.0%), and glycidyltrimethylammonium chloride (also known as epoxypropyltrimethylammonium chloride, EPTMAC) were purchased from Fluka. Deionised water prepared with a Millipore Synergy system was used for all experiments.
000 g mol−1), microcrystalline cellulose (μ-cellulose) with a particle size of 20 μm, sodium phosphate monobasic (NaH2PO4, ≥99.0%), hydrogen peroxide (for analysis, 35 wt% solution in water, corresponding to 11.4 mol L−1), hydrochloric acid, (HCl, ≥37%), sulfuric acid (95–98%), pinacyanol chloride (2,2′-trimethinequinocyanine chloride, M = 388.9 g mol−1), and chloroform (≥99.0%) were purchased from Sigma-Aldrich. Dodecylbenzenesulfonic acid sodium salt (hard type) (SDBS, M = 348.48 g mol−1; >95%) was from TCI Europe. ortho-Phosphoric acid (H3PO4, 85%), decanoic acid (DA, M = 172.26 g mol−1; ≥99.0%), and glycidyltrimethylammonium chloride (also known as epoxypropyltrimethylammonium chloride, EPTMAC) were purchased from Fluka. Deionised water prepared with a Millipore Synergy system was used for all experiments.
2.2. Sulfated cellulose nanocrystal (CNC) synthesis and analysis
Cellulose nanocrystals (CNCs) were obtained by hydrolysis of 20 g of μ-cellulose using 400 mL of a 64 wt% sulfuric acid solution at 45 °C for 30 min under vigorous magnetic stirring (300 rpm).42 The reaction was quenched by adding 2 L of cold water and the remaining dispersion was centrifuged at 4000 rpm with a Hettich Universal 320 table centrifuge for 10 min to remove excess aqueous acid. Nanosized cellulose was obtained after sonication (Vibracell Sonicator (Sonicsand Materials Inc., Danbury, CT)) at 40% output energy for 5 min using volumes of 50 mL. The suspension was dialyzed against water for 7 days using a Visking dialysis membrane with a molecular weight cut off of 12![[thin space (1/6-em)]](https://www.rsc.org/images/entities/char_2009.gif) 000–14
000–14![[thin space (1/6-em)]](https://www.rsc.org/images/entities/char_2009.gif) 000 Da from Medicell Membranes Ltd. to obtain an aqueous CNC dispersion of pH = 1.9 and 2 wt%. If not indicated otherwise, CNCs stands for cellulose nanocrystals consisiting of sulfate groups (Scheme 2).
000 Da from Medicell Membranes Ltd. to obtain an aqueous CNC dispersion of pH = 1.9 and 2 wt%. If not indicated otherwise, CNCs stands for cellulose nanocrystals consisiting of sulfate groups (Scheme 2).
 | ||
| Scheme 2 Chemical structures of the repeating units of a CNC chain and of a cationic analogue. For both structures the case of a single modification of the cellobiose repeating unit is shown. | ||
For control purposes, (sulfated) CNCs were rendered cationic through a reaction with EPTMAC.43,44 Water-dispersed CNCs were desulfated using a 7 wt% NaOH solution at 65 °C for 5 h. After washing, cationization of the water-dispersed CNCs was carried out at 2 wt% NaOH at RT followed by the addition of EPTMAC (1.554 mmol g−1 with respect to CNC) at 65 °C.45 After 5 h, the product was precipitated in ethanol and then washed several times with water. A final purification step using a Pur-A-Lyzer™ (Sigma) 3500-MW cut-off dialysis membrane for 4 d was carried out. For the chemical structures of the repeating units of an anionic CNC chain and its cationic analogue, see Scheme 2.
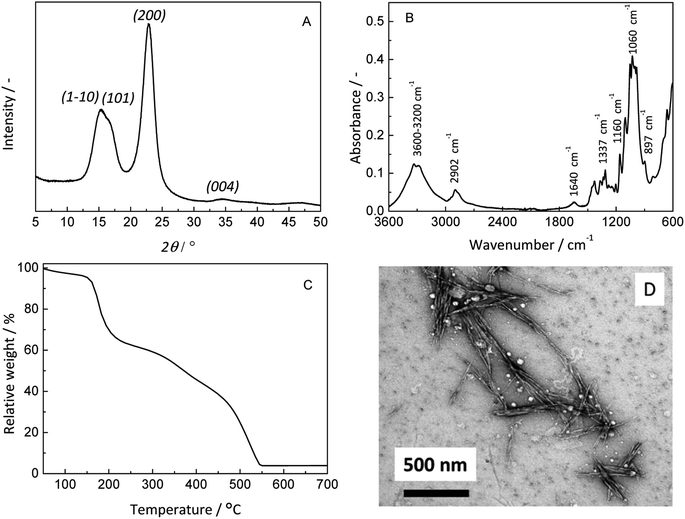
The synthesised CNCs were characterised by X-ray powder diffraction (XRD) using a PANalytical Empyrean powder diffractometer in reflection mode with Cu Kα radiation and operation at 45 kV and 40 mA. Attenuated total reflectance Fourier transform infrared spectroscopy (ATR-FTIR) measurements were performed on a Bruker Alpha FT-IR spectrometer equipped with diamond ATR optics. Elemental analysis was performed at the Microanalytic Laboratory of the Laboratory of Organic Chemistry at the Department of Chemistry and Applied Sciences (D-CHAB), ETH Zurich. Zeta-potential measurements of CNC suspensions at different pH values were performed on a Malvern Zetasizer Nano-ZS with a CNC concentration of 0.1 mg mL−1. The measurements were made at RT in a folded capillary cell (DTS1070). The thermal stability was assessed by thermal gravimetric analysis (with a Mettler Toledo TGA/SDTA851e instrument) in alumina pans under nitrogen atmosphere by heating the samples from 25 to 1100 °C at 10 °C min−1. The morphology of the CNC particles was determined by transmission electron microscopy (TEM) with a Philips CM120 Biofilter apparatus with a STEM module at an acceleration voltage of 120 kV. A droplet of a 0.1 wt% suspension of CNCs in water was deposited onto carbon-coated grids and then negatively stained with 1% (w/v) uranyl acetate (UO2(CH3COO)2) for 1 min. Scanning electron microscopy (SEM) analyses were performed on a LEO Gemini 1530 instrument (from Zeiss).
2.3. Preparation of stock solutions and suspensions
![[thin space (1/6-em)]](https://www.rsc.org/images/entities/b_char_2009.gif) :
:![[thin space (1/6-em)]](https://www.rsc.org/images/entities/b_char_2009.gif) 1) vesicle stock suspension. A vesicle suspension consisting of equimolar amounts of SDBS and DA, each 20 mM and mainly unilamellar vesicles of about 100 nm was prepared in the same way as described before by using the pH = 4.3 solution instead of the pH = 3.5 solution, with cvc ≈ 0.4 mM.41 The vesicle suspension was stored at RT and used within three weeks.
1) vesicle stock suspension. A vesicle suspension consisting of equimolar amounts of SDBS and DA, each 20 mM and mainly unilamellar vesicles of about 100 nm was prepared in the same way as described before by using the pH = 4.3 solution instead of the pH = 3.5 solution, with cvc ≈ 0.4 mM.41 The vesicle suspension was stored at RT and used within three weeks.2.4. Preparation and analysis of reaction mixtures containing soft templates
| Template type | pH = 4.3 solutiona (μL) | Template stock solution or suspensionb (μL) | Aniline stock solutionc (μL) | HRPC stock solutiond (μL) | H2O2 stock solutione (μL) |
|---|---|---|---|---|---|
| a pH = 4.3 solution: [NaH2PO4] + [H3PO4] = 0.1 M.b 20 mM AOT; or 20 mM SDBS and 20 mM DA; or 20 mM SDBS; or 20 mM SPS r.u. in pH = 4.3 solution.c 40 mM aniline in pH = 4.3 solution (adjusted to pH = 4.3 with HCl).d 67.7 μM HRPC (dissolved in deionised water).e 200 mM H2O2 (dissolved in deionised water). | |||||
| AOT vesicles | 357.2 | 75.0 (→3.0 mM) | 49.9 (→4.0 mM) | 6.8 (→0.92 μM) | 11.3 (→4.5 mM) |
SDBS/DA (1![[thin space (1/6-em)]](https://www.rsc.org/images/entities/char_2009.gif) : :![[thin space (1/6-em)]](https://www.rsc.org/images/entities/char_2009.gif) 1) vesicles 1) vesicles |
379.7 | 52.5 (→2.1 mM) | |||
| SDBS micelles | 374.7 | 57.5 (→2.3 mM) | |||
| SPS polyelectrolyte | 374.7 | 57.5 (→2.3 mM r.u.) | |||
![[thin space (1/6-em)]](https://www.rsc.org/images/entities/char_2009.gif) 600 ± 300 M−1 cm−1 as molar absorbance.35 The percentile aniline conversion was calculated for each reaction mixture by comparing ΔA238 (t = 24 h) with ΔA238 (t = 0 h), see Fig. S-1–S-3, ESI.†
600 ± 300 M−1 cm−1 as molar absorbance.35 The percentile aniline conversion was calculated for each reaction mixture by comparing ΔA238 (t = 24 h) with ΔA238 (t = 0 h), see Fig. S-1–S-3, ESI.†2.5. Preparation and analysis of reaction mixtures containing rigid CNC templates
![[thin space (1/6-em)]](https://www.rsc.org/images/entities/char_2009.gif) :
:![[thin space (1/6-em)]](https://www.rsc.org/images/entities/char_2009.gif) 1 with deionised water (0.05 M NaH2PO4 + H3PO4), (b) CNC stock suspension, (c) aniline stock solution, (d) HRPC stock solution diluted with water 1
1 with deionised water (0.05 M NaH2PO4 + H3PO4), (b) CNC stock suspension, (c) aniline stock solution, (d) HRPC stock solution diluted with water 1![[thin space (1/6-em)]](https://www.rsc.org/images/entities/char_2009.gif) :
:![[thin space (1/6-em)]](https://www.rsc.org/images/entities/char_2009.gif) 9 (0.34 mg HRPC mL−1, 6.67 μM), and (e) H2O2 stock solution diluted 1
9 (0.34 mg HRPC mL−1, 6.67 μM), and (e) H2O2 stock solution diluted 1![[thin space (1/6-em)]](https://www.rsc.org/images/entities/char_2009.gif) :
:![[thin space (1/6-em)]](https://www.rsc.org/images/entities/char_2009.gif) 9 with water (20 mM H2O2). The total volume was 400 μL. The volumes used for the “optimal” conditions are given in Table 2. For other reaction mixtures prepared and analysed in this work, see Table S-1, ESI.†
9 with water (20 mM H2O2). The total volume was 400 μL. The volumes used for the “optimal” conditions are given in Table 2. For other reaction mixtures prepared and analysed in this work, see Table S-1, ESI.†
| Template type | Diluted pH 4.3 solutiona (μL) | CNC stock suspensionb (μL) | Aniline stock solutionc (μL) | HRPC stock solutiond (μL) | H2O2 stock solutione (μL) |
|---|---|---|---|---|---|
| a [NaH2PO4] + [H3PO4] = 0.05 M.b 2 wt%.c 40 mM aniline in pH = 4.3 solution (adjusted to pH = 4.3) with HCl.d 6.67 μM HRPC (dissolved in deionised water).e 20 mM H2O2 (dissolved in deionised water). | |||||
| CNC: sulfated cellulose nanocrystals | 169.9 | 92.8 (→0.46 wt%) | 80.0 (→8.0 mM) | 21.3 (→0.36 μM) | 36.0 (→1.8 mM) |
![[thin space (1/6-em)]](https://www.rsc.org/images/entities/char_2009.gif) 000 rpm for 10 min to remove excess salt. For the FTIR and DSC measurements, the suspension was allowed to dry at RT for 48 h, followed by vacuum drying at 60 °C for 24 h.
000 rpm for 10 min to remove excess salt. For the FTIR and DSC measurements, the suspension was allowed to dry at RT for 48 h, followed by vacuum drying at 60 °C for 24 h.3. Results and discussion
3.1. Specification of “optimal reaction conditions” and criteria used for template comparison
For any type of reaction optimisation, one has to specify defining criteria. Direct comparison of the influence of a single component of a complex reaction mixture, the template in our case, requires keeping all other components in the reaction mixtures with identical concentrations at the beginning. Initial conditions were selected as follows: pH = 4.3 ([NaH2PO4] + [H3PO4] = 0.1 M), [aniline] = 4.0 mM, [HRPC] = 0.92 μM, and [H2O2] = 4.5 mM. These conditions originate from previous work with AOT vesicles where the reaction was found to be optimal at [AOT] = 3.0 mM.35 Under these conditions, the reaction can be followed by in situ UV/vis/NIR absorption measurements with cells of path length l = 0.1 cm, requiring no dilution of the mixture until equilibrium is reached; the absorbance (Aλ) between 250 and 1200 nm never exceeds Aλ ≈ 1.5 and therefore remains in the linear A vs. concentration range of the spectrophotometer used. For a comparison of the effects of the soft templates used, the above mentioned “standard concentrations” were used. In the case of CNC, however, modifications were necessary since the final reaction mixtures did not show the desired properties in terms of colour and physical state, see later Section 3.3.The criteria for the optimal conditions with the soft templates were as follows. The products obtained should have (i) high absorption at 1000 nm (A1000) and a band centred around ≈420 nm, which both is indicative for the formation of PANI-ES (Scheme 1);19,47 (ii) low absorption at 500–600 nm (absence of unwanted branching or phenazine formation);25,48 (iii) an EPR spectrum, indicative for the presence of unpaired electrons;1,49,50 (iv) Raman bands at ≈1320–1380 cm−1 assigned to polaronic structures;1,51,52 and the as-obtained reaction mixture must be (iv) an inkjet-printable, colloidally stable solution or dispersion.
3.2. Comparison of AOT vesicles, SDBS/DA (1![[thin space (1/6-em)]](https://www.rsc.org/images/entities/h3_char_2009.gif) :
:![[thin space (1/6-em)]](https://www.rsc.org/images/entities/h3_char_2009.gif) 1) vesicles, SDBS micelles, and SPS polyelectrolyte as soft templates
1) vesicles, SDBS micelles, and SPS polyelectrolyte as soft templates
![[thin space (1/6-em)]](https://www.rsc.org/images/entities/char_2009.gif) :
:![[thin space (1/6-em)]](https://www.rsc.org/images/entities/char_2009.gif) 1) vesicles, SDBS micelles, or SPS polyelectrolyte are given in Fig. S-4, ESI.†
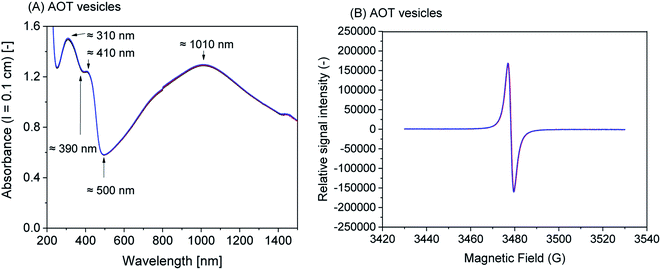
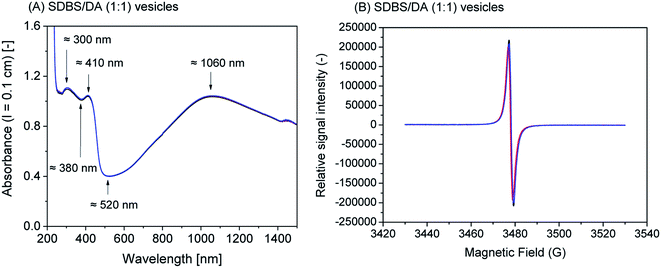
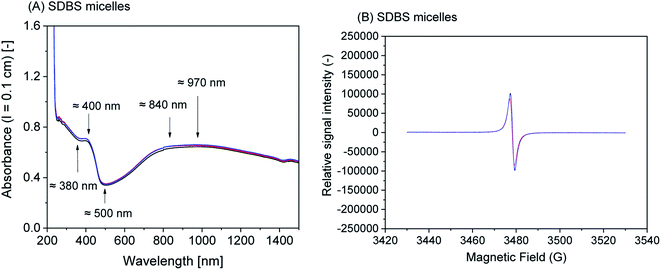
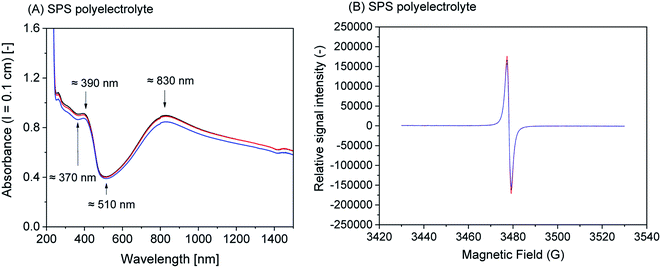
1) vesicles, SDBS micelles, or SPS polyelectrolyte are given in Fig. S-4, ESI.†Although all reaction mixtures turned dark green with very similar product spectra for all four templates, significant differences among the absorption spectra still exist. With SPS polyelectrolyte, for example, the absorption maximum in the vis/NIR region is found at ≈830 nm (Fig. 4A), while with the two vesicle systems it is at ≈1010 nm (AOT, Fig. 1A) or ≈1060 nm (SDBS![[thin space (1/6-em)]](https://www.rsc.org/images/entities/char_2009.gif) :
:![[thin space (1/6-em)]](https://www.rsc.org/images/entities/char_2009.gif) DA (1
DA (1![[thin space (1/6-em)]](https://www.rsc.org/images/entities/char_2009.gif) :
:![[thin space (1/6-em)]](https://www.rsc.org/images/entities/char_2009.gif) 1), Fig. 2A). With SDBS micelles, the band is very broad, ranging from ≈800 nm to ≈1100 nm (Fig. 3A). Moreover, with SDBS micelles, the EPR spectrum is rather broad, indicating that a large fraction of the radicals is present in a less ordered state, compared to the products formed in the other three systems. The absorbance values at 1000 nm (A1000, Fig. 4A) are correlated to the integrals of the EPR spectrum (Fig. 5B). For products obtained with AOT vesicles, both values of A1000 and EPR signal integral (i.e., radical content) were highest, while both of these values were lowest for the products obtained with SDBS micelles (Fig. 5A and B). If A500 is taken into account as well (Fig. 5C), it is lowest for the SDBS micelle system and highest for the AOT vesicle system. This may be due to the slight turbidity of the AOT vesicle suspension compared to the SDBS micellar solution. In terms of the A1000/A500 ratio, the products obtained with SDBS/DA (1
1), Fig. 2A). With SDBS micelles, the band is very broad, ranging from ≈800 nm to ≈1100 nm (Fig. 3A). Moreover, with SDBS micelles, the EPR spectrum is rather broad, indicating that a large fraction of the radicals is present in a less ordered state, compared to the products formed in the other three systems. The absorbance values at 1000 nm (A1000, Fig. 4A) are correlated to the integrals of the EPR spectrum (Fig. 5B). For products obtained with AOT vesicles, both values of A1000 and EPR signal integral (i.e., radical content) were highest, while both of these values were lowest for the products obtained with SDBS micelles (Fig. 5A and B). If A500 is taken into account as well (Fig. 5C), it is lowest for the SDBS micelle system and highest for the AOT vesicle system. This may be due to the slight turbidity of the AOT vesicle suspension compared to the SDBS micellar solution. In terms of the A1000/A500 ratio, the products obtained with SDBS/DA (1![[thin space (1/6-em)]](https://www.rsc.org/images/entities/char_2009.gif) :
:![[thin space (1/6-em)]](https://www.rsc.org/images/entities/char_2009.gif) 1) vesicles give the highest value, higher than for the products obtained with AOT vesicles or SDBS micelles (Fig. 5D).
1) vesicles give the highest value, higher than for the products obtained with AOT vesicles or SDBS micelles (Fig. 5D).
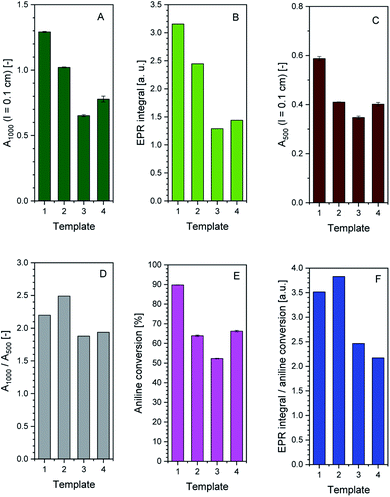 | ||
Fig. 5 Comparison of the effect the four soft templates – AOT vesicles (1), SDBS/DA (1![[thin space (1/6-em)]](https://www.rsc.org/images/entities/char_2009.gif) : :![[thin space (1/6-em)]](https://www.rsc.org/images/entities/char_2009.gif) 1) vesicles (2), SDBS micelles (3), or SPS polyelectrolyte (4) – have on the HRP/H2O2-catalysed polymerisation of aniline in terms of UV/vis/NIR and EPR spectroscopic properties and aniline conversion. The reaction time was 24 h, at T ≈ 25 °C, for a summary of the experimental details, see Table 1. Comparison is made on the basis of A1000 (A), EPR signal integral (B), A500 (C), A1000/A500 (D), aniline conversion (E) and ratio of EPR signal integral/aniline conversion (F). 1) vesicles (2), SDBS micelles (3), or SPS polyelectrolyte (4) – have on the HRP/H2O2-catalysed polymerisation of aniline in terms of UV/vis/NIR and EPR spectroscopic properties and aniline conversion. The reaction time was 24 h, at T ≈ 25 °C, for a summary of the experimental details, see Table 1. Comparison is made on the basis of A1000 (A), EPR signal integral (B), A500 (C), A1000/A500 (D), aniline conversion (E) and ratio of EPR signal integral/aniline conversion (F). | ||
The highest conversion degree of aniline after 24 h was determined for the reaction with AOT vesicles (90%). For the reactions with SPS polyelectrolyte (66%), SDBS/DA (1![[thin space (1/6-em)]](https://www.rsc.org/images/entities/char_2009.gif) :
:![[thin space (1/6-em)]](https://www.rsc.org/images/entities/char_2009.gif) 1) vesicles (64%), and SDBS micelles (52%), the aniline conversion was lower, see Fig. 5E. According to the EPR integral normalised by the extent of aniline conversion, products obtained with SDBS/DA (1
1) vesicles (64%), and SDBS micelles (52%), the aniline conversion was lower, see Fig. 5E. According to the EPR integral normalised by the extent of aniline conversion, products obtained with SDBS/DA (1![[thin space (1/6-em)]](https://www.rsc.org/images/entities/char_2009.gif) :
:![[thin space (1/6-em)]](https://www.rsc.org/images/entities/char_2009.gif) 1) vesicles give the highest relative radical content, followed by products from AOT vesicles (Fig. 5F).
1) vesicles give the highest relative radical content, followed by products from AOT vesicles (Fig. 5F).
Based on the UV/vis/NIR and EPR measurements and on the conversion degree of aniline, we conclude that the use of AOT or SDBS/DA (1![[thin space (1/6-em)]](https://www.rsc.org/images/entities/char_2009.gif) :
:![[thin space (1/6-em)]](https://www.rsc.org/images/entities/char_2009.gif) 1) vesicles provides advantages in terms of desired product properties (EPR intensity and A1000/A500 ratio) over SDBS micelles or SPS polyelectrolyte. Since aniline conversion in the presence of SDBS micelles is rather limited, these micellar templates appear the least attractive from an economic point of view.
1) vesicles provides advantages in terms of desired product properties (EPR intensity and A1000/A500 ratio) over SDBS micelles or SPS polyelectrolyte. Since aniline conversion in the presence of SDBS micelles is rather limited, these micellar templates appear the least attractive from an economic point of view.
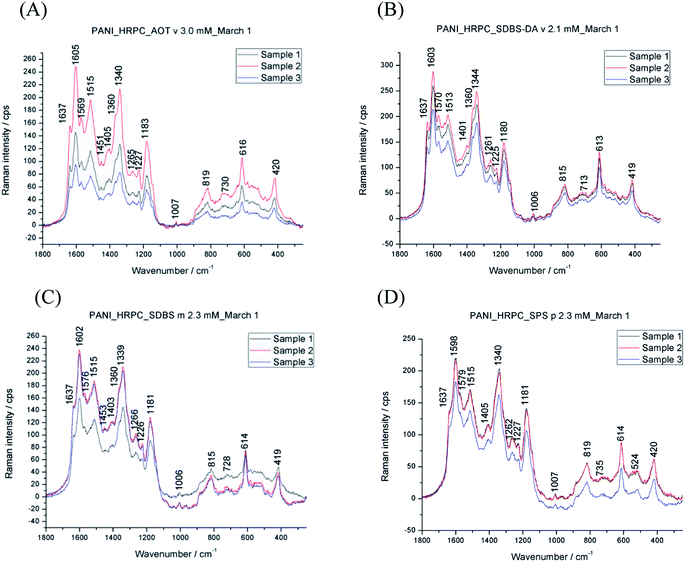 | ||
Fig. 6 Raman spectra of the different reaction mixtures run for t = 4 d at T ≈ 25 °C, either in the presence of AOT vesicles (A), SDBS/DA (1![[thin space (1/6-em)]](https://www.rsc.org/images/entities/char_2009.gif) : :![[thin space (1/6-em)]](https://www.rsc.org/images/entities/char_2009.gif) 1) vesicles (B), SDBS micelles (C), or SPS polyelectrolyte (D) and aniline, HRPC and H2O2 at pH = 4.3. For a summary of the experimental details, see Table 1. Three spectra are shown as obtained from three separate reactions to illustrate the reproducibility. 1) vesicles (B), SDBS micelles (C), or SPS polyelectrolyte (D) and aniline, HRPC and H2O2 at pH = 4.3. For a summary of the experimental details, see Table 1. Three spectra are shown as obtained from three separate reactions to illustrate the reproducibility. | ||
All spectra confirm the presence of conductive PANI-ES units in the final products. The bands which are characteristic for PANI-ES are observed at 1605–1598 cm−1 (C![[double bond, length as m-dash]](https://www.rsc.org/images/entities/char_e001.gif) C and C–C stretching vibrations of quinonoid (Q) and semiquinonoid (SQ) rings, ν(C
C and C–C stretching vibrations of quinonoid (Q) and semiquinonoid (SQ) rings, ν(C![[double bond, length as m-dash]](https://www.rsc.org/images/entities/char_e001.gif) C)Q and ν(C–C)SQ), 1515–1513 cm−1 (N–H bending vibration, δ(N–H), in SQ units), 1344–1339 cm−1 with a shoulder at ≈1360 cm−1 (C–N˙+ stretching vibrations in polaronic SQ structures, ν(C–N˙+)SQ), 1267–1259 cm−1 and 1233–1225 cm−1 (C–N stretching in benzenoid (B) rings, ν(C–N)B), 1183–1178 cm−1 (C–H bending in-plane vibrations of B rings, δ(C–H)B), 824–815 cm−1 (C–H wagging out-of-plane in polaronic structure/Q ring deformation in bipolaronic structure), and at ≈730 cm−1 (C–C ring deformation vibration, out-of-plane, in polaronic/bipolaronic PANI-ES structures).51,53 The band observed at 616–613 cm−1 is due to B ring deformation (in-plane) of PANI-ES polaronic structure51,53 combined with δ(SO2) vibrations in sulfonate (–SO3−) groups of all template molecules.54,55
C)Q and ν(C–C)SQ), 1515–1513 cm−1 (N–H bending vibration, δ(N–H), in SQ units), 1344–1339 cm−1 with a shoulder at ≈1360 cm−1 (C–N˙+ stretching vibrations in polaronic SQ structures, ν(C–N˙+)SQ), 1267–1259 cm−1 and 1233–1225 cm−1 (C–N stretching in benzenoid (B) rings, ν(C–N)B), 1183–1178 cm−1 (C–H bending in-plane vibrations of B rings, δ(C–H)B), 824–815 cm−1 (C–H wagging out-of-plane in polaronic structure/Q ring deformation in bipolaronic structure), and at ≈730 cm−1 (C–C ring deformation vibration, out-of-plane, in polaronic/bipolaronic PANI-ES structures).51,53 The band observed at 616–613 cm−1 is due to B ring deformation (in-plane) of PANI-ES polaronic structure51,53 combined with δ(SO2) vibrations in sulfonate (–SO3−) groups of all template molecules.54,55
The coexistence of the two bands attributed to ν(C–N˙+) vibrations, observed at ≈1340 cm−1 and 1360 cm−1, indicates two types of polarons present in the PANIs prepared enzymatically with different templates (Ćirić-Marjanović et al. (2008)51 and references therein). The very strong band at 1340 cm−1 is attributed to highly delocalised polaronic sites, while the shoulder at higher wavenumber, ≈1360 cm−1, corresponds to localised polarons (with possible contribution of ν(C–N+) vibrations in substituted N-phenylphenazine-type structural units).51,56,57 This means that the distribution of SQ radical cations (polarons) in PANIs is not uniform, and that delocalised polarons prevail. Similar spectral characteristic was found in the case of oligo(PADPA) produced with HRPC in the presence of AOT vesicles as templates,47 however, in that case the wavenumbers and the intensity ratio of the two ν(C–N˙+)SQ bands were different: the Raman spectra of the final oligo(PADPA) products (at t = 3 d and t = 19 d) exhibited a strong ν(C–N˙+)SQ band at higher wavelength (≈1350 cm−1), attributed to polarons with low delocalisation, and the weaker shoulder at lower wavelength (at ≈1330 cm−1) that corresponds to highly delocalised polarons, see Fig. S2 in the ESI† of Luginbühl et al. (2017).48
Besides the bands characteristic for PANI-ES, the systems for all templates also show Raman bands related to structural units atypical for PANI-ES, such as phenazine (Phz)-like, N-phenylphenazine (safranine, Saf)-like or phenoxazine (Pho)-like units (formed by the oxidative intramolecular cyclisation of branched structures), or branched structures. These bands are observed at ≈1637 cm−1 (ring ν(C–C) vibrations in Phz-, Saf or Pho-type units, mixed with ν(C–C)B vibration in ordinary PANI units), 1579–1569 cm−1 (attributable to Phz-type units), ≈1454 cm−1 (attributable to ring C![[double bond, length as m-dash]](https://www.rsc.org/images/entities/char_e001.gif) C stretching vibrations, possibly in short branches/chains and in substituted Phz- and N-phenylphenazine-type structures), and 1419–1401 cm−1 (attributed to Phz-type units).51
C stretching vibrations, possibly in short branches/chains and in substituted Phz- and N-phenylphenazine-type structures), and 1419–1401 cm−1 (attributed to Phz-type units).51
Based on the Raman spectroscopy measurements alone, we are unable to make any convincing conclusion on which of the chosen templates is most suited in terms of the desired products obtained. In all cases bands which are characteristic for PANI-ES are observed as dominant bands, accompanied by bands which are atypical for PANI-ES.
 | ||
Fig. 7 Photographs of inkjet-printed patterns of aniline on white paper using the different reaction mixtures obtained from the HRPC/H2O2-catalysed polymerisation of aniline at pH = 4.3 and T = 25 °C in the presence of either AOT vesicles (A), SDBS/DA (1![[thin space (1/6-em)]](https://www.rsc.org/images/entities/char_2009.gif) : :![[thin space (1/6-em)]](https://www.rsc.org/images/entities/char_2009.gif) 1) vesicles (B), SDBS micelles (C), or SPS polyelectrolyte (D). The different reaction mixtures were used as ink after a reaction time of 44 h. For a summary of the experimental details, see Table 1. To improve the visibility of the printed structure, the contrast of all images was modified (−50%) by using the standard tool of MS PowerPoint. The length of the carbon–carbon bonds in the benzene ring of the printed chemical structures of aniline was in all cases 11.5 mm. 1) vesicles (B), SDBS micelles (C), or SPS polyelectrolyte (D). The different reaction mixtures were used as ink after a reaction time of 44 h. For a summary of the experimental details, see Table 1. To improve the visibility of the printed structure, the contrast of all images was modified (−50%) by using the standard tool of MS PowerPoint. The length of the carbon–carbon bonds in the benzene ring of the printed chemical structures of aniline was in all cases 11.5 mm. | ||
3.3. Possible use of cellulose nanocrystals (CNCs) as rigid templates
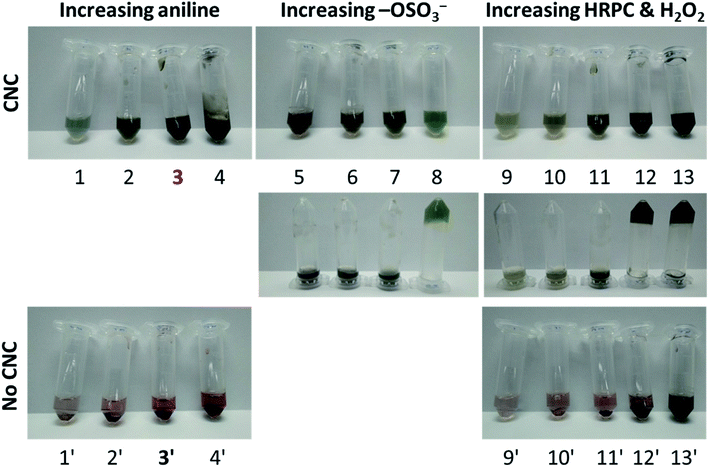 | ||
| Fig. 9 Digital photographs showing the colour and appearance of some of the reaction mixtures tested (rxn # 1–13, 1′–4′, and 9′–13′) after a reaction time of 24 h for different experimental conditions at T ≈ 25 °C, see Table S-1, ESI.† In Table 2, the preparation and initial composition for the reaction mixture, which we considered optimal (rxn # 3) are listed: 8.0 mM aniline, 0.36 μM HRPC, 1.8 mM H2O2, 0.46 wt% CNC (pH = 4.3). Reaction mixture 3′ (rxn # 3′) had the same composition as rxn # 3, but without CNCs. The two photographs in the second row show reaction mixtures 5–13 (rxn # 5–13) after turning them upside down. | ||
In order to provide insights into the spectroscopic properties of the products obtained from aniline with HRPC and H2O2 in the presence of CNC, UV/vis/NIR absorption spectra of the reaction mixtures shown in Fig. 9 were recorded. They are shown in Fig. 10, together with spectra of several control mixtures. Notable differences are observed depending on the concentrations of CNCs, aniline, HRPC and H2O2. Spectra with absorption bands in the NIR region and at about 420 nm – characteristic for the formation of PANI-ES19,47 – were only observed for reaction mixtures containing CNCs. The best (“optimal”) conditions for CNC in terms of PANI-ES formation we found with our preliminary screening were those of reaction mixture 3 (rxn # 3). The spectrum has a clear absorption maximum at ≈1100 nm and at ≈420 nm, but also a small peak at ≈550 nm (most likely originating from undesired phenazine formation).48 The reaction is highly reproducible, as shown with three samples of the same composition, see Fig. S-10, ESI.† The kinetics of the reaction under optimal CNC conditions was monitored by recording the UV/vis/NIR spectrum as a function of reaction time, see Fig. 11A. The changes are qualitatively the same as observed with AOT vesicles as soft templates,34,35 with the initial fast formation of a peak at ≈750 nm, followed by a decrease in A750 and an increase in absorption in the NIR region, at ≈1000 nm and at higher wavelength. In the absence of CNC, the changes in the absorption spectrum are very different, although at the beginning a peak at ≈750 nm occurred as well (rxn # 3′; Fig. 11B).
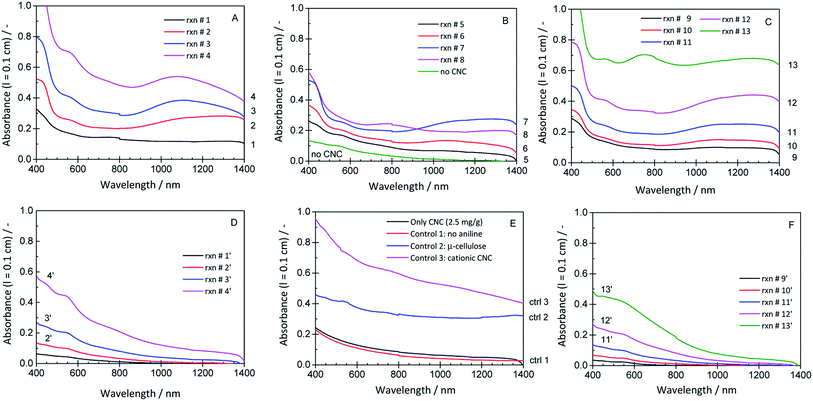 | ||
| Fig. 10 UV/vis/NIR absorption spectra of the same reaction mixtures shown in Fig. 9, recorded after a reaction time of 24 h at T ≈ 25 °C. | ||
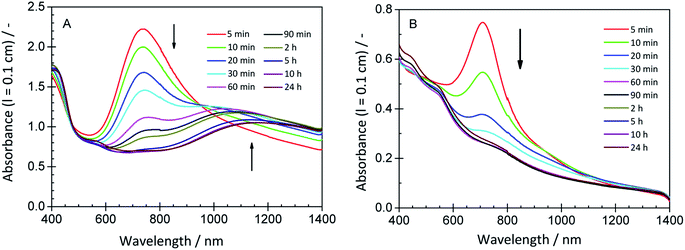 | ||
| Fig. 11 Changes of the UV/vis/NIR spectrum of (A) reaction mixture 3 (rxn # 3 of Fig. 9, “optimal” conditions for CNCs as templates) and (B) reaction mixture 3′ (rxn # 3′ of Fig. 9, absence of CNC) during the course of the reaction run at T ≈ 25 °C. | ||
The products in rxn # 3 after t = 24 h have an EPR spectrum (3 in Fig. 12), as expected for the unpaired electrons present in the polaron forms of PANI-ES. For the reference reaction run without CNC (rxn # 3′), an EPR spectrum could also be measured (3′ in Fig. 12). The integral, i.e., the amount of radicals, was, however, only about one third of the one for the reaction mixture with CNCs (Fig. S-11, ESI†). In the case of the soft templates, the difference in EPR signal intensity between the PANI-ES products obtained under optimal conditions in the presence of template and the PANI products obtained without template is much larger.33
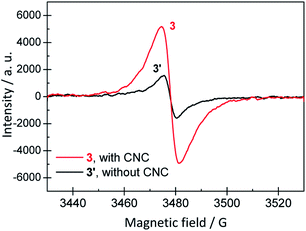 | ||
| Fig. 12 EPR spectrum of the reaction mixture 3 (rxn # 3 of Fig. 9, “optimal” conditions for CNCs as templates), recorded after a reaction time of 24 h at T ≈ 25 °C. For comparison, a reaction mixture of identical initial composition, but without CNC (3′) was also analysed after 24 h at T ≈ 25 °C. | ||
Determination of the amount of unreacted aniline after 24 h showed that the aniline conversion was only about 28%, see Fig. S-12, ESI.† The reason for this low yield currently is not clear. It may, however, be related to the inactivation of HRPC by the formed products.35
The synthesised CNCs consisting of surface adsorbed PANI-ES (abbreviated as CNC/PANI-ES) (products of rxn # 3, see Table 2 and Fig. 9) were washed with deionised water – to get rid of the buffer salt – and then analysed by HR-SEM. For this, a drop of rxn # 3 was casted onto a silicon wafer (Fig. 13). The washed CNC/PANI-ES particles were also characterised by FTIR spectroscopy after drying (Fig. S-13, ESI†). Compared to untreated CNCs (Fig. 13A), the morphology of the CNC/PANI-ES product is very similar. Higher magnification images reveal the formation of a core-sheath structure with diameters of about 20 nm, where the PANI molecules remain wrapped around individual CNC particles, similarly to what has been observed previously for a CNC/polypyrrole system,44 whereby in that case polypyrrole was synthesised through non-enzymatic, chemical oxidation. The morphology of the CNC/PANI-ES particles is in clear contrast to the morphologies determined for PANI polymerised under the same experimental conditions in a CNC-free solution (see Fig. S-14A, ESI†) or for a mixture of CNCs with aniline before addition of HRP and H2O2 (Fig. S-14B, ESI†).
 | ||
| Fig. 13 Representative HR-SEM images of (A) the prepared CNCs and (B) CNCs containing surface adsorbed PANI-ES products, as obtained after a reaction time of 24 h at T ≈ 25 °C from reaction mixture 3 (rxn # 3 of Fig. 9, “optimal” conditions for CNCs as templates). (C) is a magnification of a part of image (B). | ||
Concerning the FTIR spectrum of CNC/PANI-ES product (Fig. S-14, ESI†), there is no notable difference to CNC. The spectrum is dominated by vibrational bonds originating from CNC.
3.4. Concluding remarks
From our previous comparative investigations of the Trametes versicolor laccase/O2-catalysed, template-assisted oxidation of PADPA to PANI-ES-like oligo(PADPA) products at pH = 3.5, we concluded that AOT vesicles are somewhat superior soft templates if compared to SDBS/DA (1![[thin space (1/6-em)]](https://www.rsc.org/images/entities/char_2009.gif) :
:![[thin space (1/6-em)]](https://www.rsc.org/images/entities/char_2009.gif) 1) vesicles, and more so if compared to SPS polyelectrolyte, or SDBS micelles. The use of SDBS micelles appeared particularly disadvantageous because considerably higher amounts of laccase were required as compared to the other templates used.41 This earlier finding agrees to some extent with what we found in the present work for the HRPC/H2O2-catalysed polymerisation of aniline to PANI-ES products. The two types of vesicles were again superior if compared to SDBS micelles; the presence of the micelles resulted in a lower extent of aniline conversion (Fig. 5E). The reason for this is probably the lower operational stability of HRPC (and laccase) in the presence of SDBS micelles as compared to AOT or SDBS/DA (1
1) vesicles, and more so if compared to SPS polyelectrolyte, or SDBS micelles. The use of SDBS micelles appeared particularly disadvantageous because considerably higher amounts of laccase were required as compared to the other templates used.41 This earlier finding agrees to some extent with what we found in the present work for the HRPC/H2O2-catalysed polymerisation of aniline to PANI-ES products. The two types of vesicles were again superior if compared to SDBS micelles; the presence of the micelles resulted in a lower extent of aniline conversion (Fig. 5E). The reason for this is probably the lower operational stability of HRPC (and laccase) in the presence of SDBS micelles as compared to AOT or SDBS/DA (1![[thin space (1/6-em)]](https://www.rsc.org/images/entities/char_2009.gif) :
:![[thin space (1/6-em)]](https://www.rsc.org/images/entities/char_2009.gif) 1) vesicles. In the presence of one of the two types of vesicles, HRPC is indeed very stable if stored without aniline and H2O2,33,35 while the enzyme is considerably less stable in the presence of SDBS micelles.33 The same order of stability was also found for HRPC in the reaction mixture during the reaction (Fig. S-15†). In terms of EPR signal intensity, indicative for the formation of the polaron form of PANI-ES, the measurements indicate that the two vesicle systems are again good choices (Fig. 5B and F). Neglecting the issue of enzyme inactivation, the differences between the two vesicle systems and the SPS polyelectrolyte or SDBS micelles are, however, not as significant to show clear and convincing differences in the Raman spectra of the final reaction products (Fig. 6). Moreover, for all four soft templates, inkjet printability of the as-obtained solutions or suspensions was demonstrated (Fig. 7), confirming their suitability for processes in which finely dispersed PANI-ES particles are required. In terms of possible applications, it is the final performance of the applied products which counts at the end. In this respect, in one application – the coating of glassy carbon electrodes with electroactive PANI-ES synthesised with HRPC/H2O2 from aniline in the presence of AOT vesicles – it was shown that AOT vesicles may indeed be a good choice.37
1) vesicles. In the presence of one of the two types of vesicles, HRPC is indeed very stable if stored without aniline and H2O2,33,35 while the enzyme is considerably less stable in the presence of SDBS micelles.33 The same order of stability was also found for HRPC in the reaction mixture during the reaction (Fig. S-15†). In terms of EPR signal intensity, indicative for the formation of the polaron form of PANI-ES, the measurements indicate that the two vesicle systems are again good choices (Fig. 5B and F). Neglecting the issue of enzyme inactivation, the differences between the two vesicle systems and the SPS polyelectrolyte or SDBS micelles are, however, not as significant to show clear and convincing differences in the Raman spectra of the final reaction products (Fig. 6). Moreover, for all four soft templates, inkjet printability of the as-obtained solutions or suspensions was demonstrated (Fig. 7), confirming their suitability for processes in which finely dispersed PANI-ES particles are required. In terms of possible applications, it is the final performance of the applied products which counts at the end. In this respect, in one application – the coating of glassy carbon electrodes with electroactive PANI-ES synthesised with HRPC/H2O2 from aniline in the presence of AOT vesicles – it was shown that AOT vesicles may indeed be a good choice.37
Moving from vesicles, micelles and polyelectrolyte to the more rigid template CNCs showed that replacement of one of the soft template molecule types by CNC is not as simple as one may think at first. Although CNCs have a negatively charged surface originating from sulfate groups, it was not clear whether the charge density would be appropriate for acting as useful template, and whether the rigidity of the CNCs would favour PANI-ES formation. The preliminary results obtained indicate that the HRPC/H2O2-catalysed formation of PANI-ES products from aniline on CNCs is possible. Although there is still room for improvement, the method can be considered as alternative, enzymatic approach to the conventional methods in which PANI is synthesized chemically on cellulose nanocrystals for the development of conductive textile surfaces,62 flexible papers63 or more sophisticated conductive materials.64
Conflicts of interest
There are no conflicts to declare.Acknowledgements
Financial support for this work was provided by the Swiss National Science Foundation projects 200020_150254 and IZ73Z0_152457 (P. W., S. S.-L., G. Ć.-M., D. B.-B., and M. M.-R.), the Ministry of Education, Science and Technological Development of Serbia project OI172043 (G. Ć.-M., D. B.-B. and M. M.-R.) and through the generous fellowships given to K. K (National Institute of Technology, Faculty Research Abroad Program, Japan) and T. F. (TOBITATE! Young ambassador program from The Japan Public-Private Partnership Student Study Abroad Program) for their stay at ETH. E. L. thanks The Spanish Ministry of Education, Culture and Sport for the “José Castillejo” mobility grant and Dr Elena Tervoort-Gorokhovat for the assistance provided during the SEM analyses.Notes and references
- J. Stejskal, M. Trchová, P. Bober, P. Humpolíček, V. Kašpárková, I. Sapurina, M. A. Shishov and M. Varga, Conducting Polymers: Polyaniline, in Encyclopedia of Polymer Science and Technology, John Wiley & Sons, 4th edn, 2015 Search PubMed.
- G. G. Wallace, G. M. Spinks, L. A. P. Kane-Maguire and P. R. Teasdale, Conductive Electroactive Polymers: Intelligent Polymer Systems, CRC Press, 3rd edn, 2009 Search PubMed.
- G. Ćirić-Marjanović, Recent advances in polyaniline research: Polymerization mechanisms, structural aspects, properties and applications, Synth. Met., 2013, 177, 1–47 CrossRef.
- E. M. Geniès, M. Lapowski and J. F. Penneau, Cyclic Voltammetry of Polyaniline: Interpretation of the Middle Peak, J. Electroanal. Chem., 1988, 249, 97–107 CrossRef.
- F. Lux, Properties of electronically conductive polyaniline: a comparison between well-known literature data and some recent experimental findings, Polymer, 1994, 35, 2915–2936 CrossRef CAS.
- J. P. Sadighi, R. A. Smith and S. L. Buchwald, Palladium-Catalyzed Synthesis of Monodisperse, Controlled-Length, and Functionalized Oligoanilines, J. Am. Chem. Soc., 1998, 120, 4960–4976 CrossRef CAS.
- J. Stejskal, A. Riede, D. Hlavatá, J. Prokeš, M. Helmstedt and P. Holler, The effect of polymerization temperature on molecular weight, crystallinity, and electrical conductivity of polyaniline, Synth. Met., 1998, 96, 55–61 CrossRef CAS.
- Z. D. Zujovic, L. Zhang, G. A. Bowmaker, P. A. Kilmartin and J. Travas-Sjedic, Self-Assembled, Nanostructured Aniline Oxidation Products: A Structural Investigation, Macromolecules, 2008, 41, 3125–3135 CrossRef CAS.
- S. P. Surwade, V. Dua, N. Manohar, S. K. Manohar, E. Beck and J. P. Ferraris, Oligoaniline intermediates in the aniline-peroxydisulfate system, Synth. Met., 2009, 159, 445–455 CrossRef CAS.
- I. Y. Sapurina and J. Stejskal, The effect of pH on the oxidative polymerization of aniline and the morphology and properties of products, Russ. Chem. Rev., 2010, 79, 1123–1143 CrossRef CAS.
- H. D. Tran, J. M. D'Arcy, P. J. Beltramo, V. A. Strong and R. B. Kaner, The oxidation of aniline to produce ‘‘polyaniline’’: a process yielding many different nanoscale structures, J. Mater. Chem., 2011, 21, 3534–3550 RSC.
- A. G. MacDiarmid and A. J. Epstein, Polyanilines: A Novel Class of Conducting Polymers, Faraday Discuss. Chem. Soc., 1989, 88, 317–332 RSC.
- N. Gospodinova and L. Terlemezyan, Conducting Polymers Prepared by Oxidative Polymerization: Polyaniline, Prog. Polym. Sci., 1998, 23, 1443–1484 CrossRef CAS.
- A. G. MacDiarmid, J.-C. Chiang, M. Halpern, W.-S. Huang, S.-L. Mu, N. L. D. Somasiri, W. Wu and S. I. Yaniger, Polyaniline: Interconversion of Metallic and Insulating Forms, Mol. Cryst. Liq. Cryst., 1985, 121, 173–180 CrossRef CAS.
- A. G. MacDiarmid, J.-C. Chiang, W. Huang, B. D. Humphrey and N. L. D. Somasiri, Polyaniline: Protonic Acid Doping to the Metallic Regime, Mol. Cryst. Liq. Cryst., 1985, 125, 309–318 CrossRef CAS.
- W. W. Focke, G. E. Wnek and Y. Wei, Influence of Oxidation State, pH, and Counterion on the Conductivity of Polyaniline, J. Phys. Chem., 1987, 91, 5813–5818 CrossRef CAS.
- Y. Cao, P. Smith and A. J. Heeger, Counter-ion induced processibility of conducting polyaniline and of conducting polyblends of polyaniline in bulk polymers, Synth. Met., 1992, 48, 91–97 CrossRef CAS.
- Y. Xia, A. G. MacDiarmid and A. J. Epstein, Camphorsulfonic Acid Fully Doped Polyaniline Emeraldine Salt: In Situ Observation of Electronic and Conformational Changes Induced by Organic Vapors by an Ultraviolet/Visible/Near-Infrared Spectroscopic Method, Macromolecules, 1994, 27, 7212–7214 CrossRef CAS.
- Y. Xia, J. M. Wiesinger, A. G. MacDiarmid and A. J. Epstein, Camphorsulfonic Acid Fully Doped Polyaniline Emeraldine Salt: Conformations in Different Solvents Studied by an Ultraviolet/Visible/Near-Infrared Spectroscopic Method, Chem. Mater., 1995, 7, 443–445 CrossRef CAS.
- M. Zagorska, I. Kulszewicz-Bajer, O. Blet, P. Zawirska, B. Dufour, P. Rannou and A. Pron, Solution processible poly(aniline) via doping with diesters of sulfosuccinic acid, Synth. Met., 2003, 138, 543–548 CrossRef CAS.
- K.-S. Lee, T. Hino and N. Kuramoto, Highly Conductive Polyaniline Doped with DEHSSA Synthesized in Different Protonic Acids, Chem. Lett., 2007, 36, 340–341 CrossRef CAS.
- J. Stejskal and R. G. Gilbert, Polyaniline. Preparation of a Conducting Polymer (IUPAC Technical Report), Pure Appl. Chem., 2002, 74, 857–867 CAS.
- Already in 1935 it was shown that aniline oxidation not only is possible with a strong chemical oxidant in very acidic solutions, but also by using horseradish peroxidase (HRP) and hydrogen peroxide (H2O2) at much milder pH values (pH = 4.5). However, the products obtained at the end of the reaction in the experiments carried out at that time with HRP/H2O2 were a brown solid which gradually separated and then was filtered off. The product proved to be a complex mixture of related substances…: P. J. G. Mann and B. C. Saunders, Studies in Peroxidase Action I. – The Oxidation of Aniline, Proc. R. Soc. London, Ser. B, 1935, 119, 47–60 CrossRef CAS.
- L. A. Samuelson, A. Anagnostopoulos, K. S. Alva, J. Kumar and S. K. Tripathy, Biologically Derived Conducting and Water Soluble Polyaniline, Macromolecules, 1998, 31, 4376–4378 CrossRef CAS.
- W. Liu, J. Kumar, S. Tripathy, K. J. Senecal and L. Samuelson, Enzymatically Synthesized Conducting Polyaniline, J. Am. Chem. Soc., 1999, 121, 71–78 CrossRef CAS.
- W. Liu, A. L. Cholli, R. Nagarajan, J. Kumar, S. Tripathy, F. F. Bruno and L. Samuelson, The Role of Template in the Enzymatic Synthesis of Conducting Polyaniline, J. Am. Chem. Soc., 1999, 121, 11345–11355 CrossRef CAS.
- I. Y. Sakharov, A. C. Vorobiev and J. J. Castillo Leon, Synthesis of polyelectrolyte complexes of polyaniline and sulfonated polystyrene by palm tree peroxidase, Enzyme Microb. Technol., 2003, 33, 661–667 CrossRef CAS.
- P. Nickels, W. U. Dittmer, S. Beyer, J. P. Kotthaus and F. C. Simmel, Polyaniline nanowire synthesis templated by DNA, Nanotechnology, 2004, 15, 1524–1529 CrossRef CAS.
- Y. Shen, J. Sun, J. Wu and Q. Zhou, Synthesis and Characterization of Water-Soluble Conducting Polyaniline by Enzyme Catalysis, J. Appl. Polym. Sci., 2005, 96, 814–817 CrossRef CAS.
- A. V. Caramyshev, E. G. Evtushenko, V. F. Ivanov, A. R. Barceló, M. G. Roig, V. L. Shnyrov, R. B. van Huystee, I. N. Kurochkin, A. K. Vorobiev and I. Y. Sakharov, Synthesis of Conducting Polyelectrolyte Complexes of Polyaniline and Poly(2-acrylamido-3-methyl-1-propanesulfonic acid) Catalyzed by pH-Stable Palm Tree Peroxidase, Biomacromolecules, 2005, 6, 1360–1366 CrossRef CAS PubMed.
- W. Liu, J. Kumar, S. Tripathy and L. A. Samuelson, Enzymatic Synthesis of Conducting Polyaniline in Micelle Solutions, Langmuir, 2002, 18, 9696–9704 CrossRef CAS.
- V. Rumbau, J. A. Pomposo, J. A. Alduncin, H. Grande, D. Mecerreyes and E. Ochoteco, A new bifunctional template for the enzymatic synthesis of conducting polyaniline, Enzyme Microb. Technol., 2007, 40, 1412–1421 CrossRef CAS.
- Z. Guo, H. Rüegger, R. Kissner, T. Ishikawa, M. Willeke and P. Walde, Vesicles as Soft Templates for the Enzymatic Polymerization of Aniline, Langmuir, 2009, 25, 11390–11405 CrossRef CAS.
- Z. Guo, N. Hauser, A. Moreno, T. Ishikawa and P. Walde, AOT vesicles as templates for the horseradish peroxidase-triggered polymerization of aniline, Soft Matter, 2011, 7, 180–193 RSC.
- K. Junker, G. Zandomeneghi, Z. Guo, R. Kissner, T. Ishikawa, J. Kohlbrecher and P. Walde, Mechanistic aspects of the horseradish peroxidase-catalysed polymerisation of aniline in the presence of AOT vesicles as templates, RSC Adv., 2012, 2, 6478–6495 RSC.
- K. Junker, I. Gitsov, N. Quade and P. Walde, Preparation of aqueous polyaniline–vesicle suspensions with class III peroxidases. Comparison between horseradish peroxidase isoenzyme C and soybean peroxidase, Chem. Pap., 2013, 67, 1028–1047 CAS.
- I. Pašti, M. Milojević-Rakić, K. Junker, D. Bajuk-Bogdanović, P. Walde and G. Ćirić-Marjanović, Superior capacitive properties of polyaniline produced by a one-pot peroxidase/H2O2-triggered polymerization of aniline in the presence of AOT vesicles, Electrochim. Acta, 2017, 258, 834–841 CrossRef.
- J. F. Revol, H. Bradford, J. Giasson, R. H. Marchessault and D. G. Gray, Helicoidal self-ordering of cellulose microfibrils in aqueous suspension, Int. J. Biol. Macromol., 1992, 14, 170–172 CrossRef CAS.
- A. Dufresne, Nanocellulose: a new ageless bionanomaterial, Mater. Today, 2013, 16, 220–227 CrossRef CAS.
- N. Lin and A. Dufresne, Surface chemistry, morphological analysis and properties of cellulose nanocrystals with gradiented sulfation degrees, Nanoscale, 2014, 6, 5384–5393 RSC.
- K. Kashima, T. Fujisaki, S. Serrano-Luginbühl, R. Kissner, A. Janošević Ležaić, D. Bajuk-Bogdanović, G. Ćirić-Marjanović, S. Busato, T. Ishikawa and P. Walde, Effect of Template Type on the Trametes versicolor Laccase-Catalyzed Oligomerization of the Aniline Dimer p-Aminodiphenylamine (PADPA), ACS Omega, 2019, 4, 2931–2947 CrossRef CAS.
- E. Lizundia, E. Fortunati, F. Dominici, J. L. Vilas, L. M. León, I. Armentano, L. Torre and J. M. Kenny, PLLA-grafted cellulose nanocrystals: Role of the CNC content and grafting on the PLA bionanocomposite film properties, Carbohydr. Polym., 2016, 142, 105–113 CrossRef CAS.
- M. Hasani, E. D. Cranston, G. Westman and D. G. Gray, Cationic surface functionalization of cellulose nanocrystals, Soft Matter, 2008, 4, 2238–2244 RSC.
- E. Lizundia, T.-D. Nguyen, J. L. Vilas, W. Y. Hamad and M. J. MacLachlan, Chiroptical, morphological and conducting properties of chiral nematic mesoporous cellulose/polypyrrole composite films, J. Mater. Chem. A, 2017, 5, 19184–19194 RSC.
- N. Lin, A. Gèze, D. Wouessidjewe, J. Huang and A. Dufresne, Biocompatible Double-Membrane Hydrogels from Cationic Cellulose Nanocrystals and Anionic Alginate as Complexing Drugs Codelivery, ACS Appl. Mater. Interfaces, 2016, 8, 6880–6889 CrossRef CAS PubMed.
- H. B. Dunford and J. S. Stillman, On the Function and Mechanism of Action of Peroxidases, Coord. Chem. Rev., 1976, 19, 187–251 CrossRef CAS.
- G. M. do Nascimento and M. A. de Souza, Spectroscopy of Nanostructured Conducting Polymers, in Nanostructured Conductive Polymers, ed. A. Eftekhari, John Wiley & Sons, Chichester, 2010, ch. 8, pp. 341–373 Search PubMed.
- S. Luginbühl, M. Milojević-Rakić, K. Junker, D. Bajuk-Bogdanović, I. Pašti, R. Kissner, G. Ćirić-Marjanović and P. Walde, The influence of anionic vesicles on the oligomerization of p-aminodiphenylamine catalyzed by horseradish peroxidase and hydrogen peroxide, Synth. Met., 2017, 226, 89–103 CrossRef.
- V. I. Krinichnyi, H.-K. Roth, M. Schrödner and B. Wessling, EPR study of polyaniline highly doped by p-toluenesulfonic acid, Polymer, 2006, 47, 7460–7468 CrossRef CAS.
- B. Rakvin, D. Carić, M. Andreis, K. Junker and P. Walde, EPR Study of Polyaniline Synthesized Enzymatically in the Presence of Submicrometer-Sized AOT Vesicles, J. Phys. Chem. B, 2014, 118, 2205–2213 CAS.
- G. Ćirić-Marjanović, M. Trchová and J. Stejskal, The chemical oxidative polymerization of aniline in water: Raman spectroscopy, J. Raman Spectrosc., 2008, 39, 1375–1387 CrossRef.
- A. Janoševic Ležaić, S. Luginbühl, D. Bajuk-Bogdanović, I. Pašti, R. Kissner, B. Rakvin, P. Walde and G. Ćirić-Marjanović, Insight into the template effect of vesicles on the laccase-catalyzed oligomerization of N-phenyl-1,4-phenylenediamine from Raman spectroscopy and cyclic voltammetry measurements, Sci. Rep., 2016, 6, 30724 CrossRef.
- M. Cochet, G. Louarn, S. Quillard, J. P. Buisson and S. Lefrant, Theoretical and experimental vibrational study of emeraldine in salt form. Part II, J. Raman Spectrosc., 2000, 31, 1041–1049 CrossRef CAS.
- G. Socrates, Infrared and Raman Characteristic Group Frequencies, John Wiley & Sons, New York, 2001, p. 220 Search PubMed.
- H. G. M. Edwards, D. R. Brown, J. A. Dale and S. Plant, Raman spectroscopy of sulfonated polystyrene resins, Vib. Spectrosc., 2000, 24, 213–224 CrossRef CAS.
- M. Bláha, J. Zednik and J. Vohlídal, Self-doping of polyaniline prepared with the FeCl3/H2O2 system and the origin of the Raman band of emeraldine salt at around 1375 cm−1, Polym. Int., 2015, 64, 1801–1807 CrossRef.
- M. Trchová, Z. Morávková, J. Dybal and J. Stejskal, Detection of Aniline Oligomers on Polyaniline–Gold Interface using Resonance Raman Scattering, ACS Appl. Mater. Interfaces, 2014, 6, 942–950 CrossRef.
- N. Lin, C. Bruzzese and A. Dufresne, TEMPO-Oxidized Nanocellulose Participating as Crosslinking Aid for Alginate-Based Sponges, ACS Appl. Mater. Interfaces, 2012, 4, 4948–4959 CrossRef CAS.
- P. Lu and Y. Lo Hsieh, Cellulose isolation and core–shell nanostructures of cellulose nanocrystals from chardonnay grape skins, Carbohydr. Polym., 2012, 87, 2546–2553 CrossRef CAS.
- E. Lizundia, J. L. Vilas and L. M. León, Crystallization, structural relaxation and thermal degradation in Poly(L-lactide)/cellulose nanocrystal renewable nanocomposites, Carbohydr. Polym., 2015, 123, 256–265 CrossRef CAS.
- For AOT, SDBS and SPS, the calculated mass fractions of sulfur are 7.6%, ≈9%, and 15%, respectively. For the CNCs prepared it was 0.82 ± 0.15%.
- Z. Stempien, T. Rybicki, M. Kozanecki and M. I. Szynkowska, In situ deposition of polyaniline and polypyrrole electroconductive layers on textile surfaces by the reactive ink-jet printing technique, Synth. Met., 2015, 202, 49–62 CrossRef CAS.
- D. A. Gopakumar, A. R. Pai, Y. B. Pottathara, D. Pasquini, L. C. de Morais, M. Luke, N. Kalarikkal, Y. Grohens and S. Thomas, Cellulose Nanofiber-Based Polyaniline Flexible Papers as Sustainable Microwave Absorbers in the X-Band, ACS Appl. Mater. Interfaces, 2018, 10, 20032–20043 CrossRef CAS.
- X. Wu, C. Hu, H. Xu, X. Zhang and Z. Zhou, Biotemplate Synthesis of Polyaniline@Cellulose Nanowhiskers/Natural Rubber Nanocomposites with 3D Hierarchical Multiscale Structure and Improved Electrical Conductivity, ACS Appl. Mater. Interfaces, 2014, 6, 21078–21085 CrossRef CAS.
Footnote |
| † Electronic supplementary information (ESI) available. See DOI: 10.1039/c9ra06168a |
| This journal is © The Royal Society of Chemistry 2019 |

