 Open Access Article
Preparation of SiO2@TiO2:Eu3+@TiO2 core double-shell microspheres for photodegradation of polyacrylamide†
Haoyang
Zou
a,
Lan
Wang
d,
Huaizhi
Tao
d,
Yi
Liu
 *a,
Meiqi
Chang
*b and
Shiyu
Yao
 *c
*c
aState Key Laboratory of Supramolecular Structure and Materials, Jilin University, Changchun 130012, P. R. China. E-mail: yiliuchem@jlu.edu.cn
bState Key Laboratory of High Performance Ceramics and Superfine Microstructure, Shanghai Institute of Ceramics, Chinese Academy of Sciences, Shanghai 200050, P. R. China. E-mail: changmeiqi@mail.sic.ac.cn
cCollege of Physics, Jilin University, Changchun 130012, P. R. China. E-mail: yaoshiyu@jlu.edu.cn
dResearch Institute of Drilling and Production Engineering Technology, CNPC Chuanqing Drilling Engineering Co., Ltd, Guanghan 618300, P. R. China
First published on 30th September 2019
Abstract
Recently, polyacrylamide (PAM) has been widely used in polymer flooding technology to enhance oil recovery and oil production. However, the difficulty in removing hydrolysed PAM (HPAM) from wastewater still seriously blocks the further application of polymer flooding in the oilfields. Herein, we demonstrate the preparation of SiO2@TiO2:Eu3+@TiO2 core double-shell microspheres (STT) through a two-step solvothermal and sol–gel coating strategy. The as-prepared STT exhibits an ideal photocatalytic activity for the photodegradation of HPAM. More importantly, by using STT as the model, the correlation between fluorescence intensity and photocatalytic activity of the photocatalysts is investigated. The results suggest their oppositional relationship. Since many kinds of photocatalysts are utilized in the degradation of organic pollutants, it is believed that our work will not only promote the development of photocatalysis in the field of oil extraction, but also offer a convenient method for evaluating the photocatalytic activity of the photocatalysts.
Introduction
Recently, the emergence of energy shortages is forcing people to explore new extraction strategies to expand oil output. With the development of extraction technology, traditional water flooding technology is being replaced by polymer flooding technology to exploit the remaining oil and the collection of a high permeability layer.1–3 Until now, polymer flooding has been widely applied in the eastern oilfields of China due to its convenient and wide adaptability.4,5 Despite that the application of polymer flooding can efficiently enhance oil recovery and oil production, a large amount of waste water containing a quantity of residual hydrolyzed polyacrylamide (HPAM) is produced as well.6 The presence of HPAM not only increases the viscosity of water, seriously impeding the oil–water separation, but also sets barriers for the post-processing of the wastewater by current wastewater treatment strategies.7–9 As a result, the effluent cannot reach the reinjection standards of oilfields. In the meantime, serious environmental pollution may be created if the wastewater is discharged to the land surface. Thus, how to remove HPAM from wastewater is still a bottleneck for the further application of polymer flooding in oilfields.Nowadays, semiconductor-based photocatalysis as an advanced oxidation process has been widely applied in the degradation of organic pollutants.10–13 Many semiconductor nanomaterials are explored as the promising photocatalysts.6,14–16 Among these nanomaterials, TiO2 has received much attention due to its non-toxicity, chemical stability, and excellent photocatalytic activity. However, currently available TiO2 still suffers from some problems in practical utilization. On one hand, these nanoscale TiO2 nanoparticles (NPs) prefer to aggregate in the reaction system, which significantly decreases the effective surface area, resulting in a decay of photocatalytic activity.17–19 On the other hand, complicated and difficult processes are required to separate ultrafine NPs from aqueous or gaseous pollutants while reclaiming the photocatalysts. Owing to the low cost, thermal stability, and chemical inertness of SiO2, the fabrication of TiO2 NPs on submicron SiO2 is a simple and convenient way to enhance the immobility/separability of TiO2 NPs.17,20,21 In addition, it is reported that the photogenerated electrons can transfer from rutile to anatase under irradiation.22,23 Thus, the coexistence of anatase and rutile phases may strongly promote the charge separation, then significantly improve the photocatalytic activity of TiO2.24 Based on the points above, submicron SiO2 covered by TiO2 NPs with different crystal phases will be an ideal kind of photocatalysts for the degradation of HPAM in the wastewater from polymer flooding.
Photoluminescence (PL) spectra are usually utilized to understand the separation and migration efficiency of photogenerated charge carrier in a photocatalyst. Since PL emission mainly originates from the recombination of photogenerated electrons and holes, while the photocatalytic process depends on their separation. It is reasonable to conclude that the lower PL intensity of the photocatalyst can lead to a higher photocatalytic activity.25–28 However, many previous reports show that the catalytic performances of the photocatalysts are not inversely related to their fluorescence intensities.29–31 Thus, the correlation between fluorescence and photocatalytic properties is still worth discussing. Because of the unique optical properties, including long decay time, narrow emission lines, and large Stokes shift, rare earth (RE)-doped nanophosphors offer us an ideal model to investigate the correlation between fluorescence intensities and photocatalytic activities of the photocatalysts.32,33
Herein, we demonstrate the preparation of SiO2@TiO2:Eu3+@TiO2 core double-shell microspheres (STT) through a two-step solvothermal and sol–gel coating method. Effects of preparation conditions, such as the thickness of the outer layer TiO2 and the calcination temperature, on the fluorescence properties of STT are discussed firstly. Then, the photocatalytic activities of STT on the photodegradation of HPAM are evaluated as well. More importantly, the correlation between the fluorescence intensity and photocatalytic activity of the photocatalysts is investigated by using STT as the model. Our results identify the promising photocatalytic activity of STT on the photodegradation of HPAM. Meanwhile, some evidences on disclosing the opposite relation between the fluorescence intensity of the photocatalyst and their photocatalytic activity are provided. Thus, it is believed that this work will not only promote the development the photocatalysis in field of oil extraction, but also offer a convenient method on evaluating the photocatalytic activity of the photocatalysts.
Experimental section
Materials
Tetraethyl orthosilicate (TEOS), hydrolyzed polyacrylamide is from Internet Aladdin Reagent Database Inc., tetrabutyl titanate (TBOT), aluminum sulfate octadecahydrate (99%), sodium formate (99%), absolute ethanol, acetonitrile, isopropyl alcohol (IPA), ammonium hydroxide (NH4OH, 28%), and Eu2O3 (99.99%) are purchased from Beijing Chemical Co. All chemicals are analytical-grade and used directly without further purification.Preparation of SiO2@TiO2:Eu3+ core–shell microspheres (ST)
SiO2@TiO2:Eu3+ core–shell microspheres are prepared according to the previous work without calcination process.34 The product is designated as ST.Preparation of SiO2@TiO2:Eu3+@TiO2 core double-shell structure (STT)
In a typical procedure, 0.3 g ST are dispersed in a mixture of 19 mL ethanol and 7 mL acetonitrile (the role of acetonitrile: adjusting the dielectric constant and viscosity of the solution to inhibit the independent nucleation of TiO2), followed by the addition of 0.2 mL ammonia aqueous solution (28%) (solution A). Then the stoichiometric amount of TBOT (0.4, 0.8, 1.2, 1.6 mL) is added dropwise to the mixture of 3 mL ethanol and 1 mL acetonitrile under vigorous stirring (solution B). After that, solution B is dropped into solution A and the mixture is stirred for 4 h. And the products are washed with deionized water and absolute ethanol four times, which are designated as STT-0.4, STT-0.8, STT-1.2, and STT-1.6. Finally, STT-1.2 are calcined in a muffle furnace at the predetermined temperature (700, 800, 900 °C) for 3 h. The products are designated as STT-700, STT-800, and STT-900, respectively.Photocatalytic degradation of HPAM
HPAM aqueous solutions (100 mg L−1) are prepared and shaken before using. 0.4 g of sample is added into 40 mL of HPAM aqueous solution. Before the irradiation, the solution is magnetically stirred for 30 min in the dark to ensure the absorption/desorption equilibrium. Then, a certain amount of solution is extracted and centrifuged every 15 min under simulated solar light irradiation (a Xenon lamp (CHFXQ 500 W, Global Xenon Lamp Power)). The HPAM concentration are analyzed by starch–CdI2 spectrophotometry. The operation process is as follows:Characterization
The crystalline structures of the samples are evaluated by X-ray diffraction (XRD) analyses, carried out on a Rigaku D/max-B II X-ray diffractometer with Cu-Kα radiation (λ = 0.15405 nm), scans are made from 10° to 70° (2θ). The morphologies of the samples are characterized by scanning electron microscope (SEM) (Hitachi S-4800) and transmission electron microscopy (TEM) (FEI Tecnai G2S-Twin) with a field emission gun operating at 200 kV. The UV-vis diffuse absorbance spectra are acquired with a UV-3600 spectrophotometer (Shimadzu). The Brunauer–Emmett–Teller (BET) specific surface area of the samples are determined through nitrogen adsorption (Micromeritics, ASAP2010). X-ray photoelectron spectroscopy (XPS) spectra are obtained through a VG ESCALAB 250 spectrometer using Mg Kα radiation (1253.6 eV) as an excitation source. Excitation and emission spectra are recorded with a Jobin Yvon FluoroMax-4 fluorescence spectrophotometer (excitation source: 150 W xenon lamp).Results and discussion
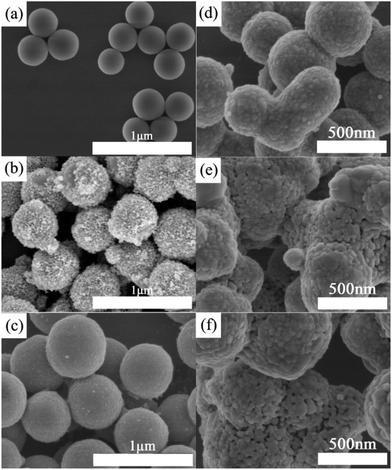
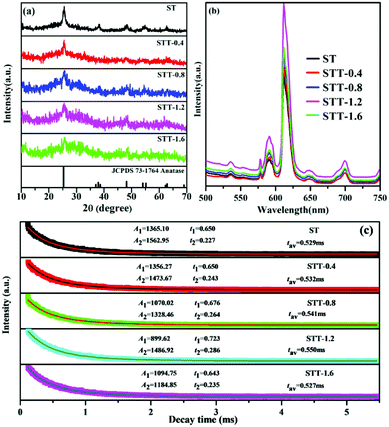
The morphologies of SiO2, ST, and STT are firstly characterized by SEM. As shown in Fig. 1a, the SiO2 are spherical with a diameter of around 310 nm. As to ST, plenty of TiO2 NPs are covering on the surface of SiO2 microspheres and the diameter of the hybrid microspheres increases to 450–550 nm (Fig. 1b). After coating with the second layer of TiO2, STT microspheres with diameters of 500–640 nm are prepared (Fig. 1c). Since the SiO2 microspheres used here are amorphous, the XRD patterns of ST and STT are closely related to the crystalline phase of TiO2.35,36Fig. 2a show the XRD patterns of ST and STT. ST exhibits obvious diffraction peaks at 2θ = 25.4°, 38.1°, 48.2°, 54.9°, and 62.6°, consisting with the (101), (004), (200), (105), and (204) planes of anatase TiO2. After coating with the second layer of TiO2, the intensity and sharpness of the diffraction peaks decrease, suggesting low crystallinity of TiO2 layer obtained through sol–gel method. Fig. 2b presents the PL spectra of ST and STT upon excitation at 393 nm. From which it can be seen that all the samples share an identical spectrum pattern with the emission peaks at 536, 578, 592, 612, 649, and 700 nm, which can be ascribed to the 5D1–7F1 and 5D0–7FJ (J = 0, 1, 2, 3, 4) transitions of Eu3+, respectively. In this context, the electric dipole transition between 5D0 and 7F2 is the strongest, corresponding to the 649 nm emission. By comparing the PL spectra of ST and STT, it is clear that the sol–gel coating process is benefit for enhancing the fluorescence from Eu3+. However, the fluorescence intensity of STT is not completely proportional to the thickness of the outer layer TiO2, which will decrease when the thickness reaches a certain value.The lifetime decay curves of ST and STT are displayed in Fig. 2c. All the curves can be well fitted into a double exponential function, implying the presence of different lattice environments of Eu3+. Eu3+ with short decay time may be situated near the defects and surfaces, whereas Eu3+ with long decay lifetime are located at ordered lattice sites.37 STT-1.2 with the strongest fluorescence exhibits the longest decay time, demonstrating the non-radiative transition probability of Eu3+ from 5D0 energy level in STT-1.2 is smallest. It is well known that Eu3+ can be used as a probe to detect the crystal field environments. According to the Judd–Ofelt theory, the parameter Ω2 representing the asymmetry of Eu3+ can be evaluated by taking the ratio of the electric dipole (5D0–7F2) transition rate (A02) to the magnetic dipole (5D0–7F2) transition rate (A01).38 As a result, the Ω2 values of ST and STT with the order of ST > STT-0.4 > STT-0.8 > STT-1.6 > STT-1.2 are listed in Table 1. Asymmetric ratio (R), which is the relative ratio of integrated area under the peak of electric dipole transition to magnetic dipole transition, can also be used to understand the symmetry and coordination environment of Eu3+.39 From Table 1 it can be clearly observed that the R decreases after coating with the second layer of TiO2. These results reveal that appropriate coating with TiO2 can improve Eu3+ coordination environment, increase the symmetric nature of Eu3+ but decrease the covalency of Eu–O bonds.
| Sample | A 0–1 (s−1) | A 0–2 (s−1) | A 0–4 (s−1) | Ω 2 (10−20 cm2) | Ω 4 (10−20 cm2) | R |
|---|---|---|---|---|---|---|
| ST | 50 | 164.5 | 38.5 | 3.76 | 1.90 | 3.29 |
| STT-0.4 | 50 | 164.0 | 36.0 | 3.75 | 1.77 | 3.28 |
| STT-0.8 | 50 | 161.5 | 38.0 | 3.70 | 1.87 | 3.23 |
| STT-0.12 | 50 | 157.0 | 37.5 | 3.59 | 1.85 | 3.14 |
| STT-0.16 | 50 | 157.5 | 39.0 | 3.60 | 1.92 | 3.15 |
The surface compositions and valence states of ST and STT are further studied by XPS. As shown in Fig. S1,† the Ti spectrum of STT consists of two peaks at 464.6 and 458.9 eV, corresponding to 2p1/2 and 2p3/2 binding energy of Ti2+. However, these two peaks shift to 464.9 and 459.2 eV in the spectrum of ST, which may be attributed to the change of the local chemical environment influenced by Eu3+ incorporation.40 The O 1s spectrum of ST are wide and asymmetric, which can be divided into three peaks. The major peak centered at 530.8 eV is ascribed to Ti–O–Ti bond. The peaks position at 532.4 and 533.3 eV can be assigned to the Ti–O–Si and Si–O–Si, respectively. As to STT, all peaks possess relative low binding energy compared with ST, which may be attributed to the less effect of Si on the binding energy of O in the outer layer TiO2.41 The percentage surface content and apparent surface coverage (ASC) of Ti–O–Ti are calculated to investigate the unsaturated bond repair degree of the surface of the core–shell structure.42 As shown in Table 2, the ASC value increases from 84.3 to 162.74 m2 g−1 after coating with the second layer of TiO2, which indicates that the presence of outer layer TiO2 not only improve the symmetry of Eu3+, but also repair the unsaturated bonds along with the elimination of defects on the surface of ST. However, despite the surface defects and unsaturated bonds have been almost repaired, the fluorescence intensity of STT can still be weakened when the outer layer TiO2 is too thick. This is mainly due to the part absorption of exciting and emitting light by outer layer TiO2.
| Sample | O 1s B.E. (eV) | % surface content | ASC (m2 g−1) | ||||
|---|---|---|---|---|---|---|---|
| Ti–O–Ti | Ti–O–Si | Si–O–Si | Ti–O–Ti | Ti–O–Si | Si–O–Si | ||
| ST | 530.8 | 532.4 | 533.3 | 53.3 | 11.1 | 35.6 | 84.3 |
| STT-1.2 | 530.5 | 531.7 | 532.6 | 43.7 | 20.3 | 36.0 | 162.74 |
STT with strong fluorescence offers us an ideal model to study the correlation between fluorescence intensity and photocatalytic activity of photocatalysts. Before using as the photocatalyst for photodegradation of HPAM, calcination is employed to enhance the crystallinity of STT. Fig. 1d–f illustrates the SEM images of STT calcinated under different temperatures. As shown in Fig. 1d, STT microspheres become rough along with the emergence of isolated domains on their surfaces after calcination at 700 °C. With increasing the calcination temperature from 700 to 900 °C, these isolated domains grow accompanied by the formation of many pores between adjacent domains. N2 adsorption/desorption experiment is carried out to characterize the specific surface area of STT, STT-700, STT-800, and STT-900, which are calculated to be 372.42, 45.50, 29.64, and 18.51 m2 g−1 based on the BET model (Fig. 3). Accordingly, their pore sizes are evaluated to be increased by raising the calcination temperature, consisting with the results exhibited by the SEM images.
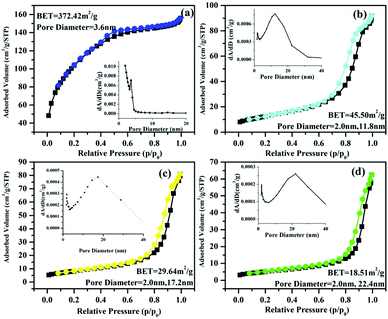 | ||
| Fig. 3 N2 adsorption/desorption isotherms of STT (a), STT-700 (b), STT-800 (c), and STT-900 (d). The insets are corresponding pore size distribution. | ||
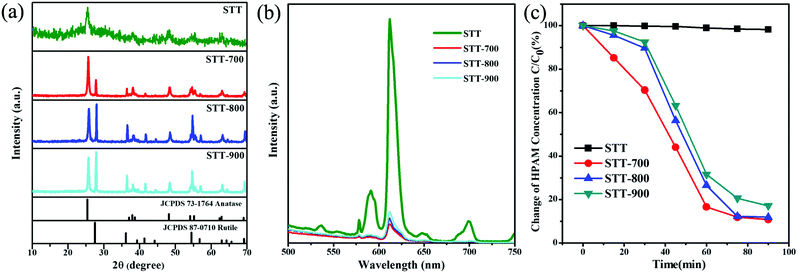
The crystallization behavior and optical property of the calcined STT are investigated by XRD and PL spectra. Fig. 4a shows the XRD patterns of STT with and without calcination. Unlike non-calcined STT, new peaks corresponding to the (110), (101), (210), and (211) planes of the rutile phase emerge in the XRD pattern of STT-700. Compared with the XRD pattern of ST-700, it can be concluded that the presence of rutile phase in calcined STT is derived from the outer layer TiO2 (Fig. S2†). Further raising the calcination temperature to 900 °C, the peaks related to both anatase and rutile phases become sharper due to the enhancement of TiO2 crystallization. At the same time, the dominant crystalline phase of STT changes from anatase to rutile (Table 3). Besides, the fluorescence intensities of calcined STT decrease significantly compared with the non-calcined counterpart, which may be ascribed to the existence of the rutile phase (Fig. 4b).43 Although the proportion of rutile increases with the elevation of the calcination temperature, the high temperature can promote the crystallization of anatase TiO2, facilitating the recombination of the photogenerated charges in STT. As a result, the fluorescence intensities of calcined STT are in the order of STT-900 > STT-800 > STT-700.
| Sample | Anatase | Retile |
|---|---|---|
| STT | 100% | 0 |
| STT-700 | 83% | 17% |
| STT-800 | 67% | 33% |
| STT-900 | 63% | 37% |
The photocatalytic behaviors of STT calcinated at different temperatures are studied upon degradation of HPAM under simulated solar light irradiation. As shown in Fig. 4c, by using STT, STT-700, STT-800, and STT-900 as the photocatalysts, the degradation efficiencies of HPAM are 1.8%, 89.2%, 88.2%, and 82.9% after irradiation for 90 min. The correspondingly HPAM concentration standard curve and time-dependent absorption spectra for the degradation of HPAM in the presence of STT, STT-700, STT-800, and STT-900 are shown in Fig. S3 and S4.† It is note that although the coexistence of anatase and rutile phases can enhance the photocatalytic activity of STT, the photocatalytic activity of calcinated STT decreases with the increase of rutile phase content, which is opposite to their fluorescence intensities.
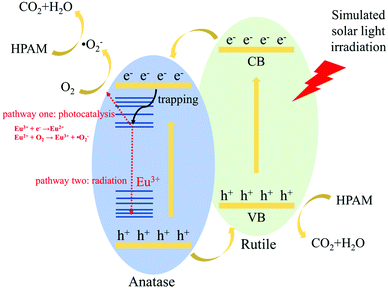
At last, the fluorescence and photocatalytic mechanism of STT are proposed in Scheme 1. In view of electronic structure, the band potentials of anatase and rutile TiO2 are compatible to form a heterojunction with a well-aligned straddling band upon their intimate contact.22,23 Under irradiation, the excited electrons in CB of rutile TiO2 can easily migrate to CB of anatase TiO2 and react with dissolved O2 to form ˙O2−. At the same time, holes left in VB of anatase TiO2 will readily transfer to VB of rutile TiO2, then decompose HPAM molecules directly. Thus, the presence of heterojunction structure may facilitate the electron–hole pair separation but inhibit the direct recombination of photogenerated charge carriers, improving the photocatalytic activity of STT. As similar as other RE ions, there will be additional states acting as electron traps located between CB and VB of anatase TiO2 after doping of Eu3+.44,45 If the trapping electrons join the reduction of O2 (pathway one in Scheme 1), the photocatalytic activity of STT should be further enhanced. Otherwise, PL emission will be detected when the electrons experience the recombination pathway of electric dipole transition of Eu3+ (pathway two in Scheme 1). Since the radiative transition relies on exciton recombination but the photocatalytic process is determined by their separation, which are totally opposite, fluorescence intensity may be used as the probe to evaluate the photocatalytic activity of the photocatalysts. Based on the data presented in Fig. 4b and c, the fluorescence intensities and photocatalytic activities of STT without and with calcination are summarized in Table 4. Our result provides some evidences to prove the concept that the fluorescence intensity of the photocatalyst is opposite to its photocatalytic activity.
| Fluorescence intensity | STT > STT-900 > STT-800 > STT-700 |
| Photocatalytic activity | STT-700 > STT-800 > STT-900 > STT |
Conclusion
In conclusion, we have demonstrated a two-step solvothermal and sol–gel route on the preparation of STT core double-shell microspheres for HPAM photodegradation. ST are firstly fabricated followed by coating with the second layer of TiO2. The presence of outer layer TiO2 can efficiently enhance the fluorescence intensity of ST by improving the symmetry of Eu3+ and repairing the unsaturated bonds in ST. Furthermore, the crystalline of outer layer TiO2 will transfer from amorphous to rutile phase after calcination, which strongly facilitate the charge separation, then improve the photocatalytic activity of STT. As a result, our STT exhibit an ideal photocatalytic activity on the photodegradation of HPAM. At last, the correlation between the fluorescence intensity and photocatalytic activity of STT is investigated. The results prove the concept that the fluorescence intensity of the photocatalyst is opposite to its photocatalytic activity. Since many kinds of photocatalysts have been widely applied in the degradation of organic pollutants, it is believed that our work will not only promote the development the photocatalysis in field of oil extraction, but also offer a convenient method on evaluating the photocatalytic activity of the photocatalysts.Conflicts of interest
There are no conflicts to declare.Acknowledgements
This work was supported by NSFC (No. 51803070, 21875086), Program for JLU Science and Technology Innovative Research Team (2017TD-06).Notes and references
- V. Alvarado and E. Manrique, Energies, 2010, 3, 1529–1575 CrossRef.
- D. K. Han, C. Z. Yang, Z. Q. Zhang, Z. H. Lou and Y. I. Chang, J. Pet. Sci. Eng., 1999, 22, 181–188 CrossRef CAS.
- G. Jing, X. Wang and C. Han, Desalination, 2008, 220, 386–393 CrossRef CAS.
- T. Chen, Z. Song, Y. Fan, C. Hu, L. Qiu and J. Tang, SPE Reservoir Eval. Eng., 1998, 1, 24–29 CrossRef CAS.
- K. C. Taylor and H. A. Nasr-El-Din, J. Pet. Sci. Eng., 1998, 19, 265–280 CrossRef CAS.
- Y. Zhou, W. Li, W. C. Wan, R. Y. Zhang and Y. H. Lin, Superlattices Microstruct., 2015, 82, 67–74 CrossRef CAS.
- M. Lu and X. Wei, Bioresour. Technol., 2011, 102, 2555–2562 CrossRef CAS.
- M. Bao, Q. Chen, Y. Li and G. Jiang, J. Hazard. Mater., 2010, 184, 105–110 CrossRef CAS.
- X. Rong, F. Qiu, C. Zhang, L. Fu, Y. Wang and D. Yang, J. Alloys Compd., 2015, 639, 153–161 CrossRef CAS.
- S. Ullah, E. P. Ferreira-Neto, A. A. Pasa, C. C. J. Alcantara, J. J. S. Acuna, S. A. Bilmes, M. L. M. Ricci, R. Landers, T. Z. Fermino and U. P. Rodrigues, Appl. Catal., B, 2015, 179, 333–343 CrossRef CAS.
- R. Miao, Z. Luo, W. Zhong, S. Y. Chen, T. Jiang, B. Dutta, Y. Nasr, Y. S. Zhang and S. L. Suib, Appl. Catal., B, 2016, 189, 26–38 CrossRef CAS.
- J. Zhao, Y. Yang, X. T. Dong, Q. L. Ma, W. S. Yu, J. X. Wang and G. X. Liu, RSC Adv., 2016, 6, 64741–64748 RSC.
- J. Zhao, Y. Yang, W. S. Yu, Q. L. Ma, X. T. Dong, X. L. Wang, J. X. Wang and G. X. Liu, J. Mater. Sci.: Mater. Electron., 2017, 28, 543–552 CrossRef CAS.
- J. H. Li, X. Yang, X. D. Yu, L. L. Xu, W. L. Kang, W. H. Yan, H. F. Gao, Z. H. Liu and Y. H. Guo, Appl. Surf. Sci., 2009, 255, 3731–3738 CrossRef CAS.
- D. Gu, Y. Wang, Z. D. Li, Y. Liu, B. H. Wang and H. J. Wu, RSC Adv., 2016, 6, 63711–63716 RSC.
- J. Al-Sabahi, T. Bora, M. Claereboudt, M. Al-Abri and J. Dutta, Chem. Eng. J., 2018, 351, 56–64 CrossRef CAS.
- Y. Yu, M. Z. Zhang, J. Chen and Y. D. Zhao, Dalton Trans., 2013, 42, 885–889 RSC.
- Q. Meng, L. Du, J. Yang, Y. Tang, Z. Han, K. Zhao and G. Zhang, Colloids Surf., A, 2018, 548, 142–149 CrossRef CAS.
- H. G. Yang, C. H. Sun, S. Z. Qiao, J. Zou, G. Liu, S. C. Smith, H. M. Cheng and G. Q. Lu, Nature, 2008, 453, 638 CrossRef CAS.
- J. L. Hu, H. S. Qian, J. J. Li, Y. Hu, Z. Q. Li and S. H. Yu, Part. Part. Syst. Charact., 2013, 30, 306–310 CrossRef CAS.
- S. H. Zhan, D. R. Chen, X. L. Jiao and Y. Song, Chem. Commun., 2007, 2043–2045 RSC.
- D. O. Scanlon, C. W. Dunnill, J. Buckeridge, S. A. Shevlin, A. J. Logsdail, S. M. Woodley, C. R. A. Catlow, M. J. Powell, R. G. Palgrave, I. P. Parkin, G. W. Watson, T. W. Keal, P. Sherwood, A. Walsh and A. A. Sokol, Nat. Mater., 2006, 12, 798 CrossRef.
- W. K. Wang, J. J. Chen, M. Gao, Y. X. Huang, X. Zhang and H. Q. Yu, Appl. Catal., B, 2016, 195, 69–76 CrossRef CAS.
- S. X. Li, J. Chen, F. Y. Zheng, Y. C. Li and F. Y. Huang, Nanoscale, 2013, 5, 12150–12155 RSC.
- L. A. Gu, J. Y. Wang, H. Cheng, Y. Z. Zhao, L. F. Liu and X. J. Han, ACS Appl. Mater. Interfaces, 2013, 5, 3085–3093 CrossRef CAS.
- H. W. Huang, K. Liu, K. Chen, Y. L. Zhang, Y. H. Zhang and S. C. Wang, J. Phys. Chem. C, 2014, 118, 14379–14387 CrossRef CAS.
- C. Y. Su, L. Liu, M. Y. Zhang, Y. Zhang and C. L. Shao, CrystEngComm, 2012, 14, 3989–3999 RSC.
- J. J. Jiang, H. T. Wang, X. D. Chen, S. Li, T. F. Xie, D. J. Wang and Y. H. Lin, J. Colloid Interface Sci., 2017, 494, 130–138 CrossRef CAS.
- J. Reszczynska, T. Grzyb, Z. S. Wei, M. Klein, E. Kowalska, B. Ohtani and A. Zaleska-Medynska, Appl. Catal., B, 2016, 181, 825–837 CrossRef CAS.
- J. Reszczynska, T. Grzyb, J. W. Sobczak, W. Lisowski, M. Gazda, B. Ohtani and A. Zaleska, Appl. Catal., B, 2015, 163, 40–49 CrossRef CAS.
- M. Q. Chang, Y. H. Song, J. Chen, L. Cui, Y. Sheng, Z. Shi and H. F. Zou, Cryst. Growth Des., 2017, 17, 6486–6497 CrossRef CAS.
- G. S. R. Raju, E. Pavitra, S. K. Hussain, D. Balaji and J. S. Yu, J. Mater. Chem. C, 2016, 4, 1039–1050 RSC.
- L. Qin, P. Cai, C. Chen, H. Cheng, J. Wang, S. I. Kim and H. J. Seo, J. Phys. Chem. C, 2016, 120, 12989–12998 CrossRef CAS.
- M. Q. Chang, Y. H. Song, J. Chen, L. Cui, Z. Shi, Y. Sheng and H. F. Zou, ACS Sustainable Chem. Eng., 2018, 6, 223–236 CrossRef CAS.
- J. B. Joo, Q. Zhang, I. Lee, M. Dahl, F. Zaera and Y. D. Yin, Adv. Funct. Mater., 2012, 22, 166–174 CrossRef CAS.
- Q. Meng, K. Wang, Y. Tang, K. Zhao, G. Zhang and L. Zhao, J. Alloys Compd., 2017, 722, 8–16 CrossRef CAS.
- F. Y. Lei, X. Zou, N. Jiang, Q. J. Zheng, K. H. Lam, L. L. Luo, Z. L. Ning and D. M. Lin, CrystEngComm, 2015, 17, 6207–6218 RSC.
- R. G. A. Kumar, S. Hata and K. G. Gopchandran, Ceram. Int., 2013, 39, 9125–9136 CrossRef CAS.
- W. A. Dar and K. Iftikhar, Dalton Trans., 2016, 45, 8956–8971 RSC.
- L. G. Wei, Y. L. Yang, X. Xia, R. Q. Fan, T. Su, Y. Shi, J. Yu, L. Li and Y. X. Jiang, RSC Adv., 2015, 5, 70512–70521 RSC.
- R. B. Jin, Z. B. Wu, Y. Liu, B. Q. Jiang and H. Q. Wang, J. Hazard. Mater., 2009, 161, 42–48 CrossRef CAS.
- S. Rasalingam, H. S. Kibombo, C. M. Wu, S. Budhi, R. Peng, J. Baltrusaitis and R. T. Koodali, Catal. Commun., 2013, 31, 66–70 CrossRef CAS.
- P. Ghosh and A. Patra, J. Phys. Chem. C, 2007, 111, 7004–7010 CrossRef CAS.
- H. Huang, K. Liu, K. Chen, Y. Zhang, Y. Zhang and S. Wang, J. Phys. Chem. C, 2014, 118, 14379–14387 CrossRef CAS.
- M. Bellardita, A. Di Paola, L. Palmisano, F. Parrino, G. Buscarino and R. Amadelli, Appl. Catal., B, 2011, 104, 291–299 CrossRef CAS.
Footnote |
| † Electronic supplementary information (ESI) available: The XPS spectra of ST and STT. The XRD patterns of ST without and with calcination at different temperature. See DOI: 10.1039/c9ra06187h |
| This journal is © The Royal Society of Chemistry 2019 |

