 Open Access Article
Quantum chemical elucidation of the turn-on luminescence mechanism in two new Schiff bases as selective chemosensors of Zn2+: synthesis, theory and bioimaging applications†
Jessica C.
Berrones-Reyes
a,
Blanca M.
Muñoz-Flores
a,
Arelly M.
Cantón-Diáz
a,
Manuel A.
Treto-Suárez
b,
Dayan
Páez-Hernández
b,
Eduardo
Schott
 ce,
Ximena
Zarate
*d and
Víctor M.
Jiménez-Pérez
 *a
*a
aUniversidad Autónoma de Nuevo León, Facultad de Ciencias Químicas, Ciudad Universitaria, 66451 Nuevo León, México. E-mail: victor.jimenezpr@uanl.edu.mx
bDoctorado en Fisicoquímica Molecular, Center of Applied Nanosciences (CENS), Universidad Andres Bello, Ave. República #275, Santiago de Chile, Chile
cDepartamento de Química Inorgánica, UC Energy Research Center, Facultad de Química de Farmacia, Pontificia Universidad Católica de Chile, Avenida Vicuña Mackenna, 4860 Macul, Santiago, Chile
dInstituto de Ciencias Químicas Aplicadas, Theoretical and Computational Chemistry Center, Facultad de Ingeniería, Universidad Autónoma de Chile, Av. Pedro de Valdivia 425, Santiago, Chile. E-mail: jazminac@gmail.com
eMillennium Nuclei on Catalytic Processes towards Sustainable Chemistry (CSC), Chile
First published on 30th September 2019
Abstract
We report the synthesis and characterization of two new selective zinc sensors (S,E)-11-amino-8-((2,4-di-tert-butyl-1-hydroxybenzylidene) amino)-11-oxopentanoic acid (A) and (S,E)-11-amino-8-((8-hydroxybenzylidene)amino)-11-oxopentanoic acid (B) based on a Schiff base and an amino acid. The fluorescent probes, after binding to Zn2+ ions, presented an enhancement in fluorescent emission intensity up to 30 times (ϕ = A 50.10 and B 18.14%). The estimated LOD for compounds A and B was 1.17 and 1.20 μM respectively (mixture of acetonitrile![[thin space (1/6-em)]](https://www.rsc.org/images/entities/char_2009.gif) :
:![[thin space (1/6-em)]](https://www.rsc.org/images/entities/char_2009.gif) water 1
water 1![[thin space (1/6-em)]](https://www.rsc.org/images/entities/char_2009.gif) :
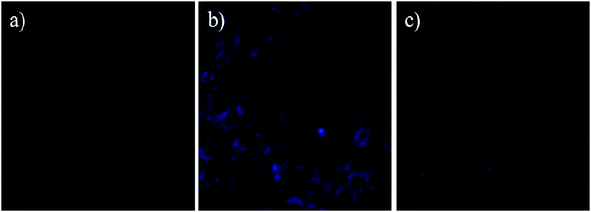
:![[thin space (1/6-em)]](https://www.rsc.org/images/entities/char_2009.gif) 1). Theoretical research has enabled us to rationalize the behaviours of the two selective sensors to Zn2+ synthesized in this work. Our results showed that in the free sensors, PET and ESIPT are responsible for the quenching of the luminescence and that the turn-on of luminescence upon coordination to Zn2+ is mainly induced by the elimination of the PET, which is deeply analysed through EDA, NOCV, molecular structures, excited states and electronic transitions via TD-DFT computations. Confocal fluorescence microscopy experiments demonstrate that compound A could be used as a fluorescent probe for Zn2+ in living cells.
1). Theoretical research has enabled us to rationalize the behaviours of the two selective sensors to Zn2+ synthesized in this work. Our results showed that in the free sensors, PET and ESIPT are responsible for the quenching of the luminescence and that the turn-on of luminescence upon coordination to Zn2+ is mainly induced by the elimination of the PET, which is deeply analysed through EDA, NOCV, molecular structures, excited states and electronic transitions via TD-DFT computations. Confocal fluorescence microscopy experiments demonstrate that compound A could be used as a fluorescent probe for Zn2+ in living cells.
1. Introduction
Zinc is the most abundant trace element essential in cellular functions of the body, and plays an important role in fundamental biological processes, such as DNA synthesis, RNA transcription, regulation of metalloenzymes, neurophysiology, and apoptosis.1,2 According to medical research, the imbalance of zinc in human bodies can result in several serious diseases, such as diabetes, neurodegenerative disorders, and certain types of cancer.3–6 Since biological systems require an adequate concentration of zinc for their optimal functioning,7–9 different methods for this detection have been proposed. Within a wide variety of methods, luminescent chemosensors have attracted the attention of researchers for their simplicity, low cost, high selectivity and sensitivity, and are applicable in many fields such as medical diagnostics, living cells, environmental control and electronics.7,10,11 Although there are other methods such as atomic absorption spectrometry, inductively coupled plasma mass spectroscopy, inductively coupled plasma-atomic emission spectrometry, UV-visible spectroscopy,12 they do not allow analyte monitoring in situ and in real time, especially in biological systems. In luminescent chemosensor, the analyte recognition can be set from a change of color or intensity of the emission from the interaction with the analyte.13 This interaction can lead to a series of transduction mechanisms that need to be understood to achieve efficiency and selectivity in the sensors. The most frequent sensing mechanisms shown by shown are Photoinduced Electron Transfer (PET),14,15 intramolecular charge transfer (ICT),9 Energy Transfer (ET),14,16 Metal–Ligand Charge Transfer (MLCT or LMCT),17 Excited State Intramolecular Proton Transfer (ESIPT),18 excimer and exciplex formation.19,20The Schiff bases have been widely studied because of their biological and structural importance, mainly for their specific and selective reactions with metal ions. Almost all metals form 1![[thin space (1/6-em)]](https://www.rsc.org/images/entities/char_2009.gif) :
:![[thin space (1/6-em)]](https://www.rsc.org/images/entities/char_2009.gif) 1 metal complexes with Schiff bases. The feature of Schiff bases gives geometric and cavity control of host–guest complexation and modulation of its lipophilicity, and produce remarkable selectivity, sensitivity and stability for a specific ion.21 Although some zinc sensors have been developed, most of them confront various problems such as low water-solubility, bad selectivity, and/or few with fluorescent enhancement, and some of them often require laborious multistep organic synthesis.22–24 Therefore, the design of effective and sensitive Zn2+ probe, especially with high water-solubility, fluorescent enhancements, and a simple synthesis method, has become crucially important.25–28 In this work, we report two selective zinc sensors (A and B) based on a Schiff base, and an amino acid (glutamine), to improve the solubility and biocompatibility of the molecules for possible biological assays.
1 metal complexes with Schiff bases. The feature of Schiff bases gives geometric and cavity control of host–guest complexation and modulation of its lipophilicity, and produce remarkable selectivity, sensitivity and stability for a specific ion.21 Although some zinc sensors have been developed, most of them confront various problems such as low water-solubility, bad selectivity, and/or few with fluorescent enhancement, and some of them often require laborious multistep organic synthesis.22–24 Therefore, the design of effective and sensitive Zn2+ probe, especially with high water-solubility, fluorescent enhancements, and a simple synthesis method, has become crucially important.25–28 In this work, we report two selective zinc sensors (A and B) based on a Schiff base, and an amino acid (glutamine), to improve the solubility and biocompatibility of the molecules for possible biological assays.
2. Experimental section
2.1. General remarks
All starting materials were purchased from Sigma-Aldrich Chemical Company. Solvents were used without further purification. Melting points were determined on an Electrothermal Mel-Temp apparatus and are not corrected. Nuclear magnetic resonance experiments as 1H and 13C NMR spectra were recorded on a Bruker advance DPX 400. Chemical shifts (ppm) are relative to (CH3)4Si for 1H and 13C. High-resolution mass spectra (HRMS) were acquired by LC/MSD TOF on an Agilent Technologies instrument with APCI as the ionization source. UV-vis absorption spectra were measured on a Shimadzu 2401 PC spectrophotometer. The emission spectra have been recorded with a Fluorolog 3 spectrofluorometer, by exciting 10 nm below the longer wavelength absorption band. Fluorescence quantum yields in solution (ϕ) were determined according to the procedure reported in the literature29 and using quinine sulphate in H2SO4 0.1 M (ϕ = 0.54 at 310 nm) as the standard. Measurements were carried out by controlling the temperature at 25.0 ± 0.5 °C with a water circulating bath. Five solutions with absorbance at an excitation wavelength lower than 0.1 were analyzed for each sample and the quantum yield was averaged.2.2. Preparation of complexes
![[double bond, length as m-dash]](https://www.rsc.org/images/entities/char_e001.gif) N), 1590, 1360, 780. TOF calc. for [(C20H31N2O4 + H)+]: 363.227834; found: 363.228060 (error = 0.225763 ppm).
N), 1590, 1360, 780. TOF calc. for [(C20H31N2O4 + H)+]: 363.227834; found: 363.228060 (error = 0.225763 ppm).
2.3. UV-vis and fluorescence spectrum measurements
Stock solutions of various metal ions (100 μM) were prepared with ultrapure water, respectively. A stock solution of each compound (20 μM) was prepared in acetonitrile. For a typical detection, the compound solution was mixed with the stock solution of one metal ion, followed by the dilution with appropriate amounts of water/acetonitrile. After the incubation at room temperature for 30 min, the corresponding fluorescence spectrum was recorded. The solutions were studied as prepared, in order to avoid any solvolysis or photodegradation effect.30 All absorption and emission spectrum were performed in a quartz optical cell of 1 cm optical path length at room temperature. All fluorescence measurements were carried out upon excitation at 370 nm for A and 316 nm for B.2.4. Theoretical models and computational details
In this study, we report a series of calculations that describe the structure and optical properties of the free sensors and coordinated with two metals ions, i.e. Ni2+ and Zn2+. The coordination number was completed incorporating explicitly some water molecules to achieve a planar square or octahedral geometry as proper for each metal ion (see below).All the structures were optimized using ORCA 4.0 code at the Density Functional Theory (DFT)31 level with B3LYP functional and def2-TZVPP basis set for all atoms. The geometry of the ground (S0) and first excited singlet (S1) states were optimized for all systems with the purpose of evaluating the changes in the UV-vis absorption and emission spectra experimentally observed, through Time-Dependent Density Functional Theory (TD-DFT) computations.32,33 The optical properties were also evaluated using Coulomb-attenuating method CAM-B3LYP functional, that was developed to minimize deviations in charge-transfer excitation energies.34
The radiative rate (krad) and radiative lifetime of the emission (τ) are determined by using the emission energy (ΔE) and the transition dipole moment (μ) (eqn (1)).35,36
 | (1) |
The interaction energy between sensor and metal ion was analyzed through the Morokuma–Ziegler energy decomposition scheme. According to this approach, the coordination compound is studied as two fragments that compose all system: the first one is the metal with the water molecules as coordination sphere and second one is the sensor or ligand. The interaction energy can be decomposed as:38,39
| ΔEInt = ΔEElec + ΔEPauli + ΔEOrb + ΔEDis | (2) |
2.5. Cell imaging methods
Human epithelial cells Hs27 (ATCC-CRL-1634) were seeded in 6-well plates at a density of 1 × 10⁵ cells per well in 2 mL of Dulbecco's Modified Eagle Media (DMEM, Invitrogen Life Technologies) supplemented with 10% fetal bovine serum (Gibco Life Technologies) 100 IU mL−1 of penicillin, and 100 g mL−1 of streptomycin. Cells were maintained at 37 °C in a controlled humid atmosphere of 5% CO2 and 95% air. Twenty-four hours later the medium was renewed and cells were loaded with Zn2+ at concentrations of 100 μM (37 °C for 60 min). After removal of free Zn2+ by washing with media, cells were exposed to the compounds (20 μM) and incubated for 30 minutes, and finally washed with PBS. Untreated cells were used as controls. Fluorescence images were collected using a confocal laser microscopy (Olympus BX61WI).3. Results and discussion
3.1. Synthetic procedures
We carried out a design of new Schiff bases ligand as a chemosensor for Zn2+, by the condensation reaction of the corresponding benzaldehyde with L-glutamine for 24 hours (Scheme 1). The products were obtained after filtration of the crude reaction and precipitation using hexane as a yellow powder (A) and yellow oil (B) and were isolated with yields of 56 and 76% respectively.3.2. Fluorescent measurements
The sensing ability of compounds A and B was evaluated upon treatment with various metal ions (Zn2+, Fe3+, Cu2+, Cd2+, Pb2+, Ni2+, Co2+, Ag+ and Hg2+) in a mixture of acetonitrile–water (1![[thin space (1/6-em)]](https://www.rsc.org/images/entities/char_2009.gif) :
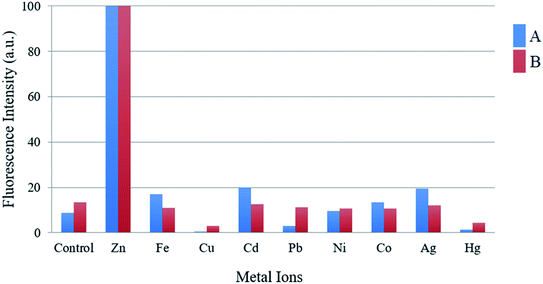
:![[thin space (1/6-em)]](https://www.rsc.org/images/entities/char_2009.gif) 1, v/v). The emission spectrum was obtained by exciting each compound 10 nm under the maximum absorbance wavelength. Compounds A and B exhibited low fluorescence emission at 475 and 445 nm respectively with low fluorescence quantum yields (ϕ = A 1.64 and B 0.77%) upon excitation at 370 nm (compound A) and 316 nm (compound B). As shown in Fig. 1 and 2 the fluorescence intensity clearly increased after the addition of Zn2+, presenting high fluorescence quantum yield (ϕ = A 50.10 and B 18.14%), an increment almost 30 times. This fluorescence increment of the compounds in presence of Zn2+ can be explained due to the inhibition of PET, which could be the process that leads the free molecules to be poor emissive systems. Also, structural rigidity of the S1 when the sensors are coordinated to the cation respect to the free sensors is expected. These facts are deeply studied through DFT computations and extend analysed in section of Computational studies. In contrast, no significant changes in the fluorescence intensity were observed in presence of metal ions such as Fe3+, Cu2+, Cd2+, Pb2+, Ni2+, Co2+, Ag+ and Hg2+. These results indicate that A and B can be useful as a fluorescent chemosensor for selective detection of Zn2+.
1, v/v). The emission spectrum was obtained by exciting each compound 10 nm under the maximum absorbance wavelength. Compounds A and B exhibited low fluorescence emission at 475 and 445 nm respectively with low fluorescence quantum yields (ϕ = A 1.64 and B 0.77%) upon excitation at 370 nm (compound A) and 316 nm (compound B). As shown in Fig. 1 and 2 the fluorescence intensity clearly increased after the addition of Zn2+, presenting high fluorescence quantum yield (ϕ = A 50.10 and B 18.14%), an increment almost 30 times. This fluorescence increment of the compounds in presence of Zn2+ can be explained due to the inhibition of PET, which could be the process that leads the free molecules to be poor emissive systems. Also, structural rigidity of the S1 when the sensors are coordinated to the cation respect to the free sensors is expected. These facts are deeply studied through DFT computations and extend analysed in section of Computational studies. In contrast, no significant changes in the fluorescence intensity were observed in presence of metal ions such as Fe3+, Cu2+, Cd2+, Pb2+, Ni2+, Co2+, Ag+ and Hg2+. These results indicate that A and B can be useful as a fluorescent chemosensor for selective detection of Zn2+.
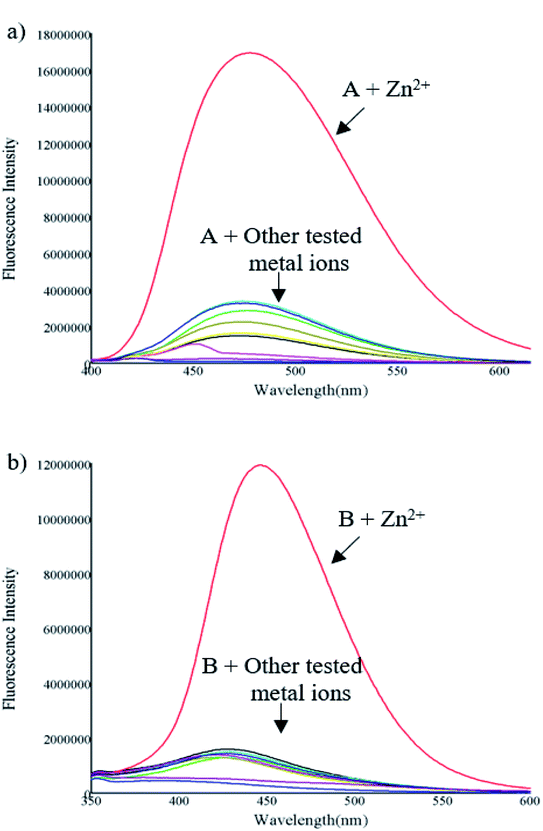 | ||
| Fig. 1 Fluorescence spectrum of compounds (10 μM) (a) A (excited at 370 nm) and (b) B (excited at 316 nm), in presence of various metal ions (50 μM). | ||
One important criterion for a chemosensor is to give a specific response to the detection of the target ion over a wide range of potentially competing analytes and to avoid interference. In order to assess the selectivity of the compounds toward Zn2+, the fluorescent competitive studies were also investigated by recording the fluorescence spectra of compounds A and B in the presence of 1 equiv. of Zn2+ ion mixed with 1 equiv. of other cations.
As shown in Fig. 3, the fluorescence emission intensity of compounds A and B in presence of Cd2+, Pb2+, Ni2+, Co2+, Ag+, and Fe3+ (only in the case of compound A) did not show significant variation by comparison with the fluorescence intensity of each compound with zinc. On the other hand, when metals such as Cu2+, Hg2+, and Fe3+ (only in the case of compound B), are present, the fluorescence is quenched up to 99% compared with the fluorescence obtained only with Zn2+. This fluorescence quenching mechanism of the compounds may be attributed to the charge transfer effect. This effect may occur when the excited compound encounters metal ions that act as electron-accepting groups, the partial electrons will be transferred to the metal cations. Therefore, the number of emitted electrons will decrease. As a result, the fluorescence is quenched.
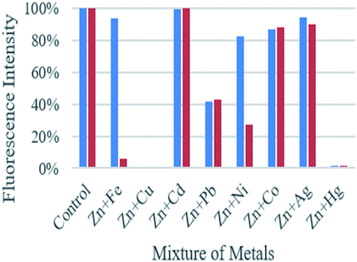 | ||
| Fig. 3 Graphic of the fluorescence intensity of compound A (blue bars) and B (red bars) upon the addition of Zn2+ (1 equiv.), in presence of various metal ions (1 equiv.). | ||
Further, fluorescence titrations of compounds A and B (10 μM) were carried out by successive incremental addition of Zn2+ ion (concentration from 0.625 to 50 μM) in a mixture of acetonitrile/water (1![[thin space (1/6-em)]](https://www.rsc.org/images/entities/char_2009.gif) :
:![[thin space (1/6-em)]](https://www.rsc.org/images/entities/char_2009.gif) 1). The fluorescence intensity of the compounds gradually increased with the progressive addition of Zn2+ due to the CHEF effect (Fig. 4).
1). The fluorescence intensity of the compounds gradually increased with the progressive addition of Zn2+ due to the CHEF effect (Fig. 4).
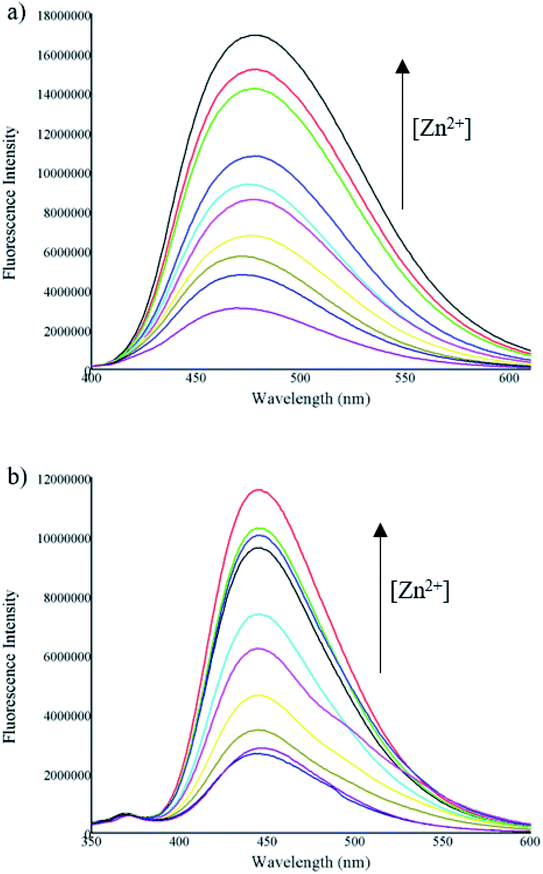 | ||
| Fig. 4 Fluorescence spectra of (a) A and (b) B (10 μM) in presence of different concentrations of Zn2+ (0.625–50 μM). | ||
Using the calibration curve from the fluorescence titration experiments, the limit of detection (LOD) of each compound was calculated according to the equation DL = 3σ/K, where σ is the standard deviation of the blank solution (measured 12 times) and K is the slope of the calibration curve. The estimated LOD for compounds A and B was 1.17 and 1.20 μM respectively. Additionally, the binding stoichiometry of compounds A and B to Zn2+ was determined by the Job's method. The fluorescence intensity was plotted against the molar fraction of the chemosensor under a constant molar concentration (Fig. 5). Results showed that the fluorescence intensity exhibited a maximum when the molar fraction of HL was ∼0.5, demonstrating a 1![[thin space (1/6-em)]](https://www.rsc.org/images/entities/char_2009.gif) :
:![[thin space (1/6-em)]](https://www.rsc.org/images/entities/char_2009.gif) 1 binding stoichiometry between the compounds A and B, and Zn2+.40
1 binding stoichiometry between the compounds A and B, and Zn2+.40
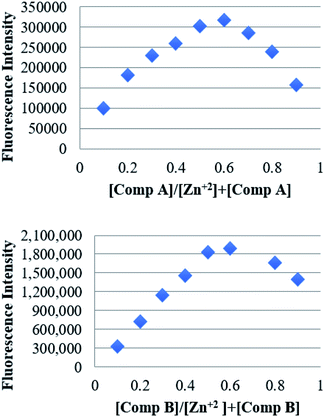 | ||
| Fig. 5 Job's plot for determining the binding stoichiometry of the compounds (above) A and (below) B, and Zn2+. The total concentration was kept 100 μM. | ||
3.3. Computational studies
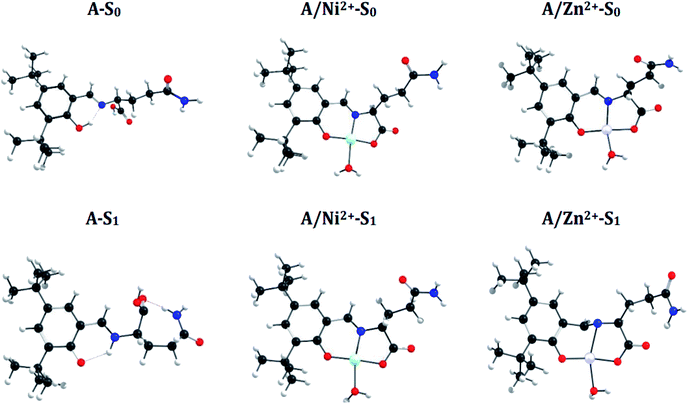
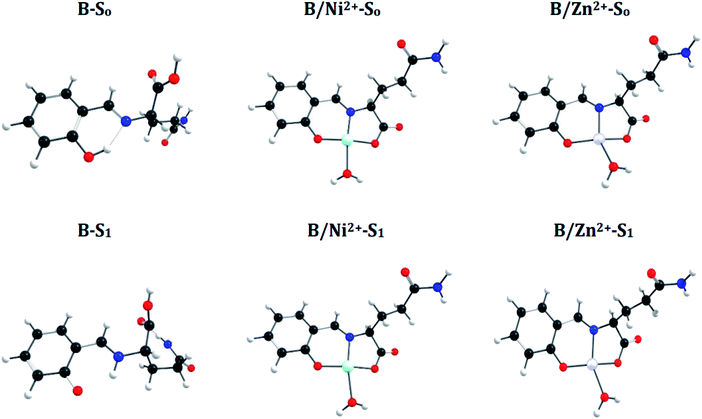
![[double bond, length as m-dash]](https://www.rsc.org/images/entities/char_e001.gif) N bond in the S1 state and manifest an Excited-State Intramolecular Proton Transfer (ESIPT), which results in a shortening of the N–H bond distance (decrease 0.74 Å) and an increase of the O–H bond (increase 1.0 Å) (see Fig. 6 and 7). These differences between both states introduce a Stokes shift in the emission spectra of the compounds in agreement with the experimentally observed bathochromic displacement of the emission bands (see Section of Fluorescent measurements).
N bond in the S1 state and manifest an Excited-State Intramolecular Proton Transfer (ESIPT), which results in a shortening of the N–H bond distance (decrease 0.74 Å) and an increase of the O–H bond (increase 1.0 Å) (see Fig. 6 and 7). These differences between both states introduce a Stokes shift in the emission spectra of the compounds in agreement with the experimentally observed bathochromic displacement of the emission bands (see Section of Fluorescent measurements).
On the other hand, metal coordination with Zn2+ and Ni2+ ions, also introduce changes in the absorption spectra, in both cases a red-shift of ∼130 nm is observed with respect to free sensors. These differences can be attributed to the structural changes in the S0 states of the free sensors and when they interact with the cations (see Fig. 6 for A and Fig. 7 for B).
A simple way to evaluate the geometrical changes between S0 and S1 states is the assignment of the root mean square deviation between them. This parameter allows quantifying the structural differences based on the comparison of the atomic positions in the molecular structure. The values show a RMSD of 2.2% for the free sensors being attributable to the elongation of the bond O–H (increase 1.0 Å), and the shortening of the H–N (decrease 0.74 Å) (see Fig. 6 and 7). For the coordination compounds, the change in terms of RMSD is of the order of 0.2%. This low deviation is due to that the interaction with the metal ions introduces rigidity in the molecular structures and that the ESIPT is not able to occur. The consideration of the solvent in the calculations of the geometrical parameters does not have a significant effect on the structural parameters since it shows a RMSD of 0.1%.
![[thin space (1/6-em)]](https://www.rsc.org/images/entities/char_2009.gif) :
:![[thin space (1/6-em)]](https://www.rsc.org/images/entities/char_2009.gif) 1) (ε = 58.5 and refraction index = 1.33)a
1) (ε = 58.5 and refraction index = 1.33)a
| System | CAM-B3LYP | B3LYP | ||||||
|---|---|---|---|---|---|---|---|---|
| λ a | F | Active MOs | Assignment | λ a | f | Active MOs | Assignment | |
| a λ a: calculated absorption wavelength in nm. f: oscillator strength. | ||||||||
| A | 294 | 0.142 | H → L | π–π* | 335 | 0.093 | H → L | π–π* |
| 239 | 0.395 | H-1 → L | π–π* | 260 | 0.428 | H-1 → L | π–π* | |
| A/Ni2+ | 336 | 0.120 | H → L | π–π* | 392 | 0.022 | H → L | π–π* |
| 254 | 0.182 | H-1 → L | π–π* | 373 | 0.044 | H-1 → L | π–π* | |
| A/Zn2+ | 324 | 0.171 | H → L | π–π* | 365 | 0.119 | H → L | π–π* |
| 243 | 0.242 | H-1 → L | π–π* | 268 | 0.320 | H-1 → L | π–π* | |
| B | 275 | 0.150 | H → L | π–π* | 303 | 0.105 | H → L | π–π* |
| 231 | 0.338 | H-1 → L | π–π* | 246 | 0.304 | H-1 → L | π–π* | |
| B/Ni2+ | 322 | 0.117 | H → L | π–π* | 365 | 0.039 | H → L | π–π* |
| 249 | 0.042 | H-1 → L | π–π* | 390 | 0.015 | H-1 → L | π–π* | |
| B/Zn2+ | 307 | 0.233 | H → L | π–π* | 341 | 0.223 | H → L | π–π* |
| 238 | 0.178 | H-1 → L | π–π* | 277 | 0.129 | H-1 → L | π–π* | |
In many theoretical studies of metal sensing mechanisms, the analysis of the light absorption process is only carried out.14 However, justifying the change of the luminescence only through the analysis of the absorption band is not enough accurate and it is not a rigorous protocol.14 In this sense, the study of the emission considering the relative energy of excited states and the oscillator strength of this process is a good complement to explain the behaviours of these systems. The employed methodology provided good results in terms of oscillator strength and of the wavelengths of emission (λe) when are compared to the experimental data.
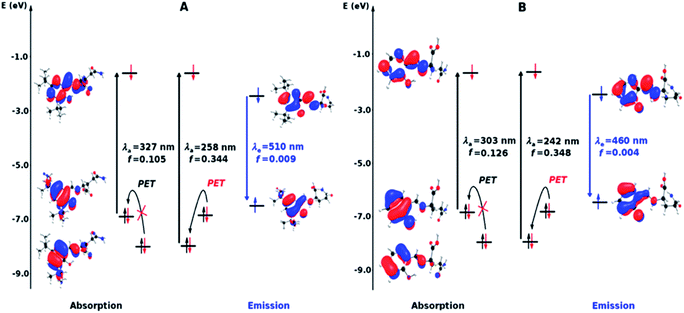
In terms of wavelength, the calculations with the B3LYP functional showed results closer to the experimental values than the CAM-B3LYP functional results and the solvent consideration do not considerably change these values (see Tables 1 and 2, S1 and S2 in ESI†). The calculated λe are 510 and 460 nm for the A and B sensors with B3LYP functional. The calculated Stokes shifts, for the sensors with metal ions, are 250 and 220 nm for A and B respectively, with the B3LYP functional. These values are distant from the experimental but in the normal range of error frequently informed for TD-DFT41,42 (see Tables 2 and S2 in ESI†).
![[thin space (1/6-em)]](https://www.rsc.org/images/entities/char_2009.gif) :
:![[thin space (1/6-em)]](https://www.rsc.org/images/entities/char_2009.gif) 1) (ε = 58.5 and refraction index = 1.33)a
1) (ε = 58.5 and refraction index = 1.33)a
| System | CAM-B3LYP | B3LYP | ||||||||
|---|---|---|---|---|---|---|---|---|---|---|
| λ e | f | k rad | τ | Assignment | λ e | f | k rad | τ | Assignment | |
| a λ e: calculated emission wavelength in nm. f: oscillator strength. krad: emission radiative rate in s−1. t: emission radiative lifetime in s. | ||||||||||
| A | 382 | 0.073 | 8.8 × 10⁸ | 1.1 × 10⁻⁹ | π–π* | 528 | 0.007 | 5.7 × 10⁹ | 1.8 × 10⁻¹⁰ | π–π* |
| A/Ni2+ | 410 | 0.004 | 1.4 × 10⁷ | 6.8 × 10⁻⁸ | dNi–π | 541 | 0.002 | 3.1 × 10⁶ | 3.3 × 10⁻⁷ | dNi–π |
| A/Zn2+ | 438 | 0.103 | 4.3 × 10⁷ | 2.3 × 10⁻⁸ | π–π* | 477 | 0.048 | 8.2 × 10⁶ | 8.2 × 10⁻⁸ | π–π* |
| B | 514 | 0.001 | 1.6 × 10⁶ | 6.4 × 10⁻⁷ | π–π* | 496 | 0.007 | 8.8 × 10⁸ | 6.5 × 10⁻⁸ | π–π* |
| B/Ni2+ | 380 | 0.007 | 2.7 × 10⁷ | 3.8 × 10⁻⁸ | dNi–π | 492 | 0.003 | 6.6 × 10⁶ | 1.5 × 10⁻⁷ | dNi–π |
| B/Zn2+ | 374 | 0.021 | 8.6 × 10⁷ | 1.2 × 10⁻⁸ | π–π* | 504 | 0.020 | 4.5 × 10⁷ | 2.2 × 10⁻⁸ | π–π* |
As it is possible to appreciate in Tables 2 and S2,† based on the oscillator strength, the intensity of the emission in the free sensors are low and the coordination with Ni2+ do not change this situation. However, the bands of the Zn2+complexes display an increment of the oscillator strength in one order of magnitude with and without solvent considerations, which agrees with the experimentally observed turn-on of the luminescence produced by this metal ion. The lower luminescence intensity of the B/Zn2+ compared to the one shown by A/Zn2+ in terms of the computed oscillator strength values, is consistent with the experiment (see Section of Fluorescent measurements).
The emission radiative lifetime (τ) and the radiative rate (krad) of the emission show magnitude orders of fluorescence decay, among 10−6 s and 106 s−1 (ref. 43) (see Tables 2 and S2 in ESI†).
The diagrams presented in Fig. 8 and 9 show the possible photophysical mechanisms responsible for the luminescent properties of the systems. When the free sensors are excited, the transition H-1 → L occurs and can set PET from the HOMO to HOMO-1 (which is a single-occupied orbital after the photoexcitation). This transfer provokes the deactivation of the emissive state and quenching of the luminescence (Fig. 8). For Ni2+ ion, also the MLCT is established in the S1 state from the LUMO located in the sensor towards d-orbitals of the metal (Fig. 9 and 10a). Various studies had reported the possibility of this mechanism in complexes of Ni2+ ion because of the energetically accessible 3d orbitals to accept electrons from the ligand.44–47 The Zn2+ ion interacts with the lone pairs of the O and N atoms responsible of the PET in the sensor, eliminating the possibility of this process and, increase the luminescence intensity of A and B (see Fig. 9 and 10b). The oscillator strength of the emissions allows corroborating these behaviors (see Fig. 8 and Table S2 in ESI†). Based on the strength of the oscillator, the A/Zn2+ system display higher emission intensity than the B/Zn2+ (see Tables 2 and S2 in ESI†). This result is consistent with the experimental evidence (see Section of Fluorescent measurements).
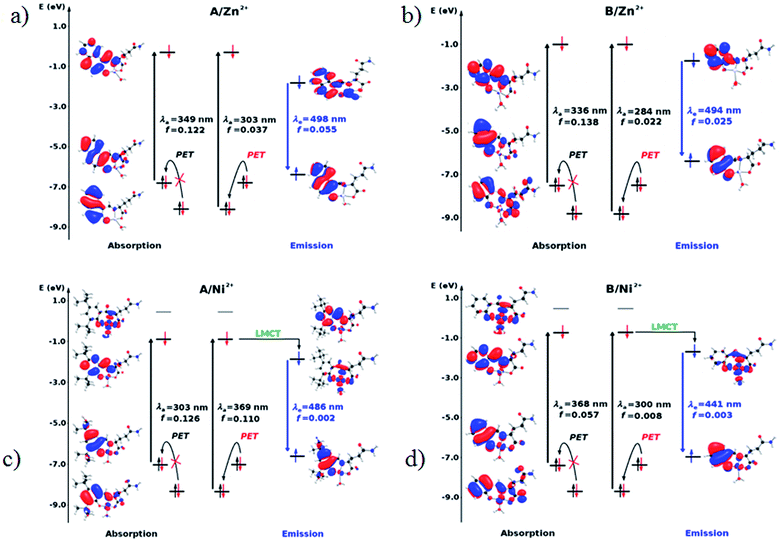 | ||
| Fig. 9 Molecular orbital diagram based on the S0 (absorption) and S1 (emission) states in the sensors coordinated with metal ions. (a) A/Zn2+, (b) B/Zn2+, (c) A/Ni2+ and (d) B/Ni2+. | ||
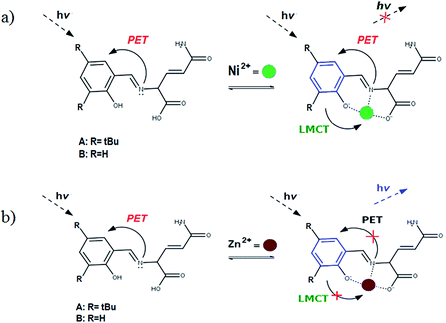 | ||
| Fig. 10 Diagram showing (a) the quenching of the luminescence due to the MLCT in the sensor with Ni2+ ion and (b) the sensing mechanism due to the PET-blocking produced by Zn2+ ion in sensors. | ||
The PET elimination can be justified with the EDA (Energy Decomposition Analysis) and NOCV (Natural Orbitals of Chemical Valence). For all systems, the charge transfer is established from the ligand to the metal ions (Table 3). In the coordination, the metal ions accept the electron pair of N and there is an ionic interaction with the deprotonated O atom. Besides, contours of the NOCV deformation density (Δρ) is revealed as the Zn2+ ion interact stronger with the electronic pair of N and O atoms (see figure in Table 3). The interaction metal–ligand is less electrostatic with Zn2+ than in the Ni2+ ion. This suggests that with Zn2+, the electron pair responsible of the PET is now more involved in the coordination with metal, favouring the elimination of PET by this coordination (see Table 3 and Fig. 10b).
| A/Ni2+ | A/Zn2+ | B/Ni2+ | B/Zn2+ | |
|---|---|---|---|---|
| a k: contribution of the presented interaction (Δρ) to the total orbital interaction is presented. | ||||
| ΔEPauli | 1019.7 | 688.9 | 1009.1 | 4159.7 |
| ΔEElec | −3176.6 | −2371.3 | −2616.0 | −3766.8 |
| ΔEOrb | −1308.6 | −908.1 | −1274.2 | −4662.1 |
| ΔEDisp | −35.0 | −31.6 | −30.1 | −41.5 |
| ΔEInt | −2894.4 | −2622.1 | −2912.2 | −4310.7 |
| %EElec | 70 | 72 | 66 | 43 |
| %EOrb | 29 | 27 | 32 | 56 |
| %EDisp | 1 | 1 | 2 | 1 |
| K | −127.3 | −57.8 | −127.6 | −57.9 |
| Δρ |

|

|

|

|
4. Conclusions
We have designed and synthesized two Schiff base fluorescent probes derived from an amino acid that exhibited selectivity and sensitivity towards Zn2+ in the aqueous solution. The 1![[thin space (1/6-em)]](https://www.rsc.org/images/entities/char_2009.gif) :
:![[thin space (1/6-em)]](https://www.rsc.org/images/entities/char_2009.gif) 1 binding stoichiometry between the compounds and Zn2+ was corroborated by the Job plot. The photophysical mechanisms cannot be rationalized based only on the molecular orbital diagram of the absorption. To properly account for the phenomenon requires contemplation of the relative energies of the electronically excited states. In the free sensors, PET and ESIPT are the quenching mechanisms of the luminescence. The coordination of the Zn2+ cations with sensors, leads to the elimination of the PET and ESIPT, inducing a turn-on effect of the luminescence. In the study of the Ni2+ ion, the PET and MLCT mechanisms are still observed, and no significant turn-on effect of the luminescence in sensors is observed. According to the Morokuma–Ziegler analysis, the charge transfer is established from the ligand (sensors) to metal ions. For systems with Zn2+ ion, the interaction metal–ligand is less electrostatic than in the system with Ni2+. This suggests that in complex with Zn2+, the electron pair responsible for the PET is more involved in the coordination with the metal, favouring the elimination of PET by coordination of this metal ion. The methodology used allows explaining the behaviour of the sensors and their differences. We have also shown that compound A can be applied to living cell imaging to detect intracellular Zn2+.
1 binding stoichiometry between the compounds and Zn2+ was corroborated by the Job plot. The photophysical mechanisms cannot be rationalized based only on the molecular orbital diagram of the absorption. To properly account for the phenomenon requires contemplation of the relative energies of the electronically excited states. In the free sensors, PET and ESIPT are the quenching mechanisms of the luminescence. The coordination of the Zn2+ cations with sensors, leads to the elimination of the PET and ESIPT, inducing a turn-on effect of the luminescence. In the study of the Ni2+ ion, the PET and MLCT mechanisms are still observed, and no significant turn-on effect of the luminescence in sensors is observed. According to the Morokuma–Ziegler analysis, the charge transfer is established from the ligand (sensors) to metal ions. For systems with Zn2+ ion, the interaction metal–ligand is less electrostatic than in the system with Ni2+. This suggests that in complex with Zn2+, the electron pair responsible for the PET is more involved in the coordination with the metal, favouring the elimination of PET by coordination of this metal ion. The methodology used allows explaining the behaviour of the sensors and their differences. We have also shown that compound A can be applied to living cell imaging to detect intracellular Zn2+.
Conflicts of interest
There are no conflicts of interest.Acknowledgements
Financial support and scholarships to J. C. Berrones-Reyes from the Consejo Nacional de Ciencia y Tecnología (CONACyT, México. Grant 240011) are acknowledged. FONDECYT 1180565, FONDECYT 1180017, FONDECYT 1161416. Manuel A. Treto-Suárez thanks to Ph.D. Program in Molecular Physical Chemistry from Universidad Andrés Bello and DGA UNAB. Millennium Science Initiative of the Ministry of Economy, Development, and Tourism-Chile, grant Nuclei on Catalytic Processes towards Sustainable Chemistry (CSC).References
- M. Patil, S. Bothra, S. K. Sahoo, H. A. Rather, R. Vasita, R. Bendre and A. Kuwar, Sens. Actuators, B, 2018, 270, 200–206 CrossRef CAS.
- L. Ma, G. Liu, S. Pu, C. Zheng and C. Fan, Tetrahedron, 2017, 73, 1691–1697 CrossRef CAS.
- A. B. Chausmer, J. Am. Coll. Nutr., 1998, 17, 109–115 CrossRef CAS.
- K. Hirzel, U. Müller, A. T. Lata, S. Hülsmann, J. Grudzinska, M. W. Seeliger, H. Betz and B. Laube, Neuron, 2006, 52, 679–690 CrossRef CAS.
- Z. Xu, K.-H. Baek, H. N. Kim, J. Cui, X. Qian, D. R. Spring, I. Shin and J. Yoon, J. Am. Chem. Soc., 2010, 132, 601–610 CrossRef CAS.
- S. K. Ghosh, P. Kim, X. A. Zhang, S. H. Yun, A. Moore, S. J. Lippard and Z. Medarova, Cancer Res., 2010, 70, 6119–6127 CrossRef CAS.
- M. Hosseini, A. Ghafarloo, M. R. Ganjali, F. Faridbod, P. Norouzi and M. S. Niasari, Sens. Actuators, B, 2014, 198, 411–415 CrossRef CAS.
- A. K. Bhanja, C. Patra, S. Mondal, D. Ojha, D. Chattopadhyay and C. Sinha, RSC Adv., 2015, 5, 48997–49005 RSC.
- T. Wei, J. Wang, Y. Chen and Y. Han, RSC Adv., 2015, 5, 57141–57146 RSC.
- A. Gupta and N. Kumar, RSC Adv., 2016, 6, 106413–106434 RSC.
- A. P. Silva, H. Q. N. Gunaratne, T. Gunnlaugsson, A. J. M. Huxley, C. P. McCoy, J. T. Rademacher and T. E. Rice, Chem. Rev., 1997, 97, 1515–1566 CrossRef.
- M. Kumar, A. Kumar, M. S. H. Faizi, S. Kumar, M. K. Singh, S. K. Sahu, S. Kishor and R. P. John, Sens. Actuators, B, 2018, 260, 888–899 CrossRef CAS.
- J. Li, C. Yin and F. Huo, Dyes Pigm., 2016, 131, 100–133 CrossRef CAS.
- A. S. Gupta, K. Paul and V. Luxami, Anal. Methods, 2013, 1, 1–9 Search PubMed.
- E. A. Briggs and N. A. Besley, J. Phys. Chem. A, 2015, 119, 2902–2907 CrossRef CAS.
- M. J. Beltrán-Leiva, D. Páez-Hernández and R. Arratia-Pérez, Inorg. Chem., 2018, 57, 5120–5132 CrossRef.
- X. Zarate, E. Schott, R. Ramirez-Tagle, D. MacLeod-Carey and R. Arratia-Pérez, Polyhedron, 2012, 37, 54–59 CrossRef CAS.
- Y. Liu, J. Zhao, Y. Wang, J. Tian, X. Fei and H. Wang, J. Mol. Liq., 2017, 233, 303–309 CrossRef CAS.
- T. Simon, M. Shellaiah, V. Srinivasadesikan, C.-C. Lin, F.-H. Ko, K. W. Sun and M.-C. Lin, Sens. Actuators, B, 2016, 231, 18–29 CrossRef CAS.
- J. Fan, M. Hu, P. Zhan and X. Peng, Chem. Soc. Rev., 2013, 42, 29–43 RSC.
- S. D. Abkenara, Z. Dahaghinb, H. B. Sadeghib, M. Hosseinia and M. Salavati-Niasari, J. Anal. Chem., 2011, 66, 612–617 CrossRef.
- G. K. Walkup, S. C. Burdette, S. J. Lippard and R. Y. Tsien, J. Am. Chem. Soc., 2000, 122, 5644–5645 CrossRef CAS.
- X. Zhang, K. S. Lovejoy, A. Jasanoff and S. J. Lippard, Proc. Natl. Acad. Sci. U. S. A., 2007, 104, 10780–10785 CrossRef CAS.
- X. Zhang, D. Hayes, S. J. Smith, S. Friedle and S. J. Lippard, J. Am. Chem. Soc., 2008, 130, 15788–15789 CrossRef CAS.
- L. Li, Y.-Q. Dang, H.-W. Li, B. Wang and Y. Wu, Tetrahedron Lett., 2010, 51, 618–662 CrossRef CAS.
- K. S. Hettie, J. L. Klockow and T. E. Glass, J. Am. Chem. Soc., 2014, 136, 4877–4880 CrossRef CAS.
- C. Yin, F. Huo, N. P. Cooley, D. Spencer, K. Bartholomew, C. L. Barnes and T. E. Glass, ACS Chem. Neurosci., 2017, 8, 1159–1162 CrossRef CAS.
- S. Pan, H. Tang, Z. Song, J. Li and Y. Guo, Chin. J. Chem., 2017, 35, 1263–1269 CrossRef CAS.
- A. T. R. Williams, S. A. Winfield and J. N. Miller, Analyst, 1983, 78, 1067–1071 RSC.
- A. Felouat, A. D'Aléo and F. Fages, J. Org. Chem., 2013, 78, 4446–4455 CrossRef CAS.
- F. Neese, Wiley Interdiscip. Rev.: Comput. Mol. Sci., 2012, 2, 73–78 CAS.
- T. Petrenko, O. Krylova, F. Neese and M. Sokolowski, New J. Phys., 2009, 11, 015001 CrossRef.
- T. Petrenko, S. Kossmann and F. Neese, J. Chem. Phys., 2011, 134, 054116 CrossRef.
- C. Adamo and D. Jacquemin, Chem. Soc. Rev., 2013, 42, 845–856 RSC.
- R. A. Marcus and N. Sutin, Biochim. Biophys. Acta, 1985, 39, 265–322 CrossRef.
- R. A. Marcus, J. Phys. Chem., 1963, 67, 853–857 CrossRef CAS.
- M. C. V. Barone, J. Phys. Chem. A, 1998, 102, 1995–2001 CrossRef.
- M. P. Mitoraj, J. Phys. Chem. A, 2011, 115, 14708–14716 CrossRef CAS.
- M. P. Mitoraj, R. Kurczab, M. Boczar and A. Michalak, J. Mol. Model., 2010, 16, 1789–1795 CrossRef CAS.
- M. Patila, S. Bothrab, S. K. Sahoob, H. A. Ratherc, R. Vasitac, R. Bendrea and A. Kuwara, Sens. Actuators, B, 2018, 270, 200–206 CrossRef.
- J. P. Perdew and M. Ernserhof, J. Chem. Phys., 1996, 105, 9982–9985 CrossRef CAS.
- R. Ramakrishnan, M. Hartmann, E. Tapavicza and O. A. Von Lilienfeld, J. Chem. Phys., 2015, 143, 084111 CrossRef.
- V. E. Kaasjager, L. Puglisi, E. Bouwman, W. L. Driessen and J. Reedijk, Inorg. Chim. Acta, 2000, 310, 183–190 CrossRef CAS.
- A. K. Patra and R. Mukherjee, Inorg. Chem., 1999, 38, 1388–1393 CrossRef CAS.
- N. Raman, S. Ravichandran and C. Thangaraja, J. Chem. Sci., 2004, 116, 215–219 CrossRef CAS.
- R. J. Letcher, W. Zhang, C. Bensimon and R. J. Crutchley, Inorg. Chim. Acta, 1993, 210, 183–191 CrossRef CAS.
- V. E. Kaasjager, L. Puglisi, E. Bouwman, W. L. Driessen and J. Reedijk, Inorg. Chim. Acta, 2000, 310, 183–190 CrossRef CAS.
Footnote |
| † Electronic supplementary information (ESI) available: Supplementary tables, RMN and high resolution mass spectra. See DOI: 10.1039/c9ra05010h |
| This journal is © The Royal Society of Chemistry 2019 |


