 Open Access Article
A vanadate-based white light emitting luminescent material for temperature sensing
Nannan Zhang,
Jie Li,
Jianrong Wang,
Ruixia Shi,
Ling Chen ,
Aiyu Zhang
 * and
Ping Yang
 *
*
School of Material Science and Engineering, University of Jinan, 250022, Jinan, China. E-mail: mse_zhangay@ujn.edu.cn; mse_yangp@ujn.edu.cn
First published on 23rd September 2019
Abstract
Calcium magnesium vanadate-europium vanadate powders with a homogeneous distribution have been prepared by a sol–gel method followed by a sintering process. The as-prepared powders show both broadband emission around 520 nm and sharp peak emission at 617 nm under UV light excitation, which are ascribed to the one-electron charge transfer transition in the VO4 tetrahedra and the typical 5D0 → 7F2 transition of Eu3+. Energy transfer occurs between the vanadate and Eu ions. The emission color of the products can be tuned by controlling the Eu concentration and temperature. White light emission can be obtained at the Eu concentration of 15% and at room temperature. The temperature related luminescence properties have been studied for the sample with 15 mol% Eu. The intensity ratio between the broadband emission (due to VO4 tetrahedra) and the sharp peak emission (due to Eu3+ ions) decreases as the temperature increases in a linear relationship. The relative sensitivity (SR) of this luminescent temperature sensor has been calculated and a maximum has been gained at 455 K with the value equal to 1.83% K−1.
1. Introduction
In recent years, photoluminescent materials have attracted great interest as irreplaceable lighting devices in the area of field emission displays (FEDs), plasma display panels (PDPs), X-ray detectors, and white-light emitting diodes (w-LEDs), due to their excellent luminous efficiency and energy saving properties.1–5Among a lot of luminescent materials, rare-earth ion doped phosphors have been extensively studied and considered as potential light source materials.6,7 Many compounds have been applied as the matrix materials for rare-earth ions, including zinc oxides, fluorides, aluminates, silicates, zirconates, vanadates, molybdates, and phosphates.8–17 As an excellent red phosphor, Eu3+ doped YVO4 (ref. 18 and 19) has attracted much attention from researchers, and the energy transfer from the VO43− groups to the f–f state of Eu3+ ions is observed. In fact, vanadates of certain metals (Zn, Mg, Sr, Cs, K and so on) show intrinsic luminescence due to the one-electron charge transfer transition in the VO4 tetrahedra.20–22
The high-precision temperature sensing plays a key role in controlling reaction process, product performance, and safety in production.23–25 Physical probes such as thermometers and thermocouples, unfortunately, have limited utilities in the situation of noncontact, small volumes, as well as high spatial resolutions.26,27 Meanwhile, optical temperature sensors, which exploit the temperature-dependent fluorescence intensities of thermally coupled levels (TCLs) of lanthanide ions (Ln3+),28–36 such as Ho3+, Pr3+, Er3+, Gd3+, serves as a feasible method benefiting from the rapid-response fluorescence spectroscopy techniques. For example, Yang et al. proposed a strategy using optical temperature sensing behavior of Er3+–Yb3+ co-doped NaY(MoO4)2 phosphor, and a maximum relative sensitivity value of 0.00969 K−1 are observed at 439 K.
In the present work, Eu3+ ions were introduced into a vanadate matrix Ca5Mg4V6O24 (called CMV hereafter), which show yellow-green colored luminescence emission of VO43− under UV light excitation. Our study focused on the luminescent property and luminescent response on different temperature ranging from 300 K to 480 K.
2. Experimental section
2.1 Preparation of Ca5Mg4V6O24:Eu3+ phosphors
Powders of Ca5Mg4V6O24 (CMV) with Eu3+ addition were prepared by a sol–gel method followed by a sintering process. 0.083 g CaCO3 (99.99%), 0.0647 g 4MgCO3·Mg(OH)2·5H2O (99.99%), 0.117 g NH4VO3 (99.9%, A.R.) and 1.051 g citric acid were mixed in a solution of HNO3 (A.R.). The doped concentration of rare earth ion (Eu3+) was from 0.5 mol% to 20 mol% (7.5 × 10⁻³ to 0.3 mmol) compared with the total mole amount of Ca2+ and Mg2+ in Ca5Mg4V6O24 host. The practical ratio of metal ions to citric acid that served as a chelating agent for metal ions was 1 to 2. The mixed solution was stirred under heating, dried in an oven, and finally sintered at 400 °C for 3 h, then heated up to 800 °C for 5 h. The obtained white powder (called CMV:Eu3+) was cooled down and ground for further investigation.2.2 Preparation of luminescent device
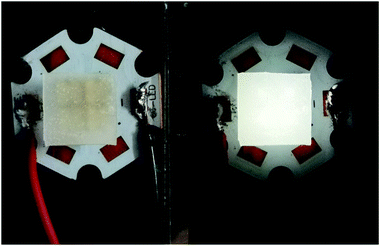
Transparent sheets of the phosphor were prepared with Sylgard 184. Sylgard 184 (Dow Corning) is of the polydimethylsiloxane (PDMS) family and is an optically clear and inert material. About 1 g resin and 0.1 g curing agent was mixed with 0.1 g powder sample and allowed to stand at room temperature for at least 24 h. The sheet was obtained by a self-leveling method. The luminescent sheets were coated on a four-beads 310 nm LED as shown in Fig. 1. Subsequent emission observation has all been conducted to these simple devices.2.3 Characterization
The X-ray diffraction (XRD) patterns for all target samples were registered using the Bruker D8 Advance with Cu Kα1,2 radiation and 2θ range from 10° to 90°, and analyzed by using Jade-5.0 software program. The scanning electron microscope (SEM) patterns and Energy dispersive spectrometer (EDS) were obtained by using a Quanta FEG 250 Field Emission Scanning Electron Microscope. The photoluminescence (PL) and excitation (PLE) spectrum under different temperatures (above the room temperature) of the samples were evaluated with a fluorescence spectrophotometer (F-4600, Hitachi, Japan) equipped with a xenon lamp as the excitation light source. The samples sealed in a metallic box were heated to and kept at a special temperature. The measure button was pressed immediately after the sample at the special temperature being transferred from the heater into the fluorescence spectrophotometer. The temperature-related PL spectra under 0 °C were measured using a FLS920 fluorescence spectrometer with a liquid nitrogen cryostat.3. Results and discussion
3.1 Morphology and phase distribution
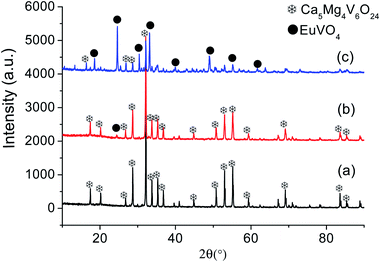
In order to learn about the phase purity and crystallization of CMV:xEu3+ powders, the patterns of XRD were measured and shown in Fig. 2. The pattern of CMV:xEu3+ (x = 0) matches well with 2002588 (Ca5Mg4V6O24) which is selected in the Crystallography Open Database (COD). With the increase of x, a new phase EuVO4 emerges. The content of EuVO4 phase rises dramatically with the Eu3+ concentration, it should be noted that the phase of EuVO4 exists even at a concentration as low as 0.5 mol%, which indicates that EuVO4 is easy to be formed independently rather than enter into the crystal lattice of matrix material. The products are still named as CMV:xEu3+ powders, although in fact they are composed of Ca5Mg4V6O24 and EuVO4 phases.A schematic of the crystal structure of Ca5Mg4(VO4)6 is presented in Fig. 3(a). In this vanadate garnet structure, Ca2+ ions are located in eightfold dodecahedral sites (i.e. a distorted cube with D2 symmetry). The Mg2+ ions are in six fold octahedral sites. The metal ion V5+ (in isolated [VO4]3−) completely occupies the fourfold Td site.37,38 The crystal structure of Ca5Mg4(VO4)6 shows a distortion after leading 1% Eu3+ into the position of Ca2+ as shown in Fig. 3(b). The detailed data are summarized in Table 1. It is obvious that with the concentration of Eu3+ increasing, the lattice constant and unit cell expand modestly, and once the value of x exceeding 10%, the lattice begin to shrink slightly, indicating that the saturation of Eu3+ in the Ca5Mg4(VO4)6 crystalline lattice.
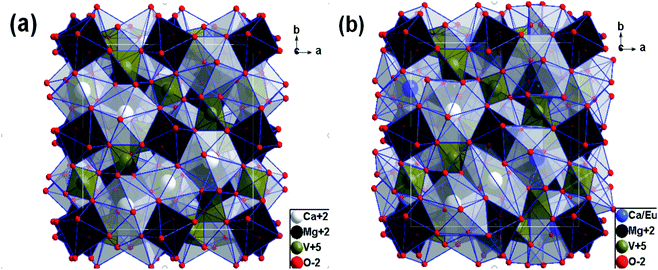 | ||
| Fig. 3 Schematic view of crystal structure along c-direction for (a) Ca5Mg4(VO4)6 and (b) Ca5Mg4(VO4)6 with Eu3+ replacing 1% Ca2+. | ||
| x | a | b | c | α, β, γ (°) | Vol |
|---|---|---|---|---|---|
| 0 | 12.4630 | 12.4360 | 12.4360 | 90 | 1923.3 |
| 1.5% | 12.4397 | 12.4397 | 12.4397 | 90 | 1925.0 |
| 2.0% | 12.4399 | 12.4399 | 12.4399 | 90 | 1925.1 |
| 2.5% | 12.4453 | 12.4453 | 12.4453 | 90 | 1927.6 |
| 10% | 12.4524 | 12.4524 | 12.4524 | 90 | 1930.9 |
| 15% | 12.4461 | 12.4461 | 12.4461 | 90 | 1928.0 |
| 20% | 12.4430 | 12.4430 | 12.4430 | 90 | 1926.5 |
SEM and EDS images of CMV:xEu3+ (x = 0, 15 mol%) are presented in Fig. 4. The grain size of sample with x = 0 is larger than that of the one with x = 15 mol%. Comparing with pure CMV, the grains of CMV:15 mol% Eu3+ show tighter arrangement and have more unclear particle edge. According to EDS analysis, the homogeneous distribution of each elements can be found, which illustrates that the two phases CMV and EuVO4 are combined together in the micro scale, distinguished from samples mixed mechanically.
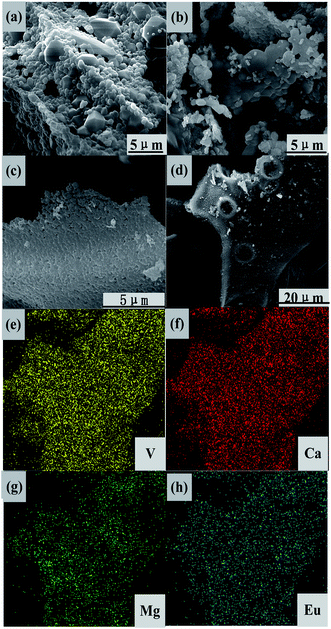 | ||
| Fig. 4 SEM images of CMV:xEu3+, (a) and (b) with x = 0 and (c) and (d) x = 15, and (e)–(h) EDS patterns based on (d). | ||
3.2 Luminescence properties of CMV:xEu3+ samples
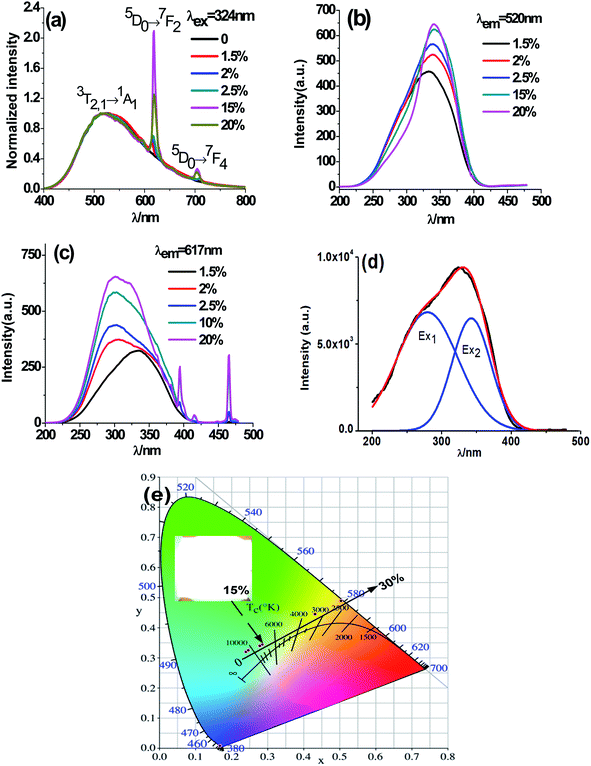
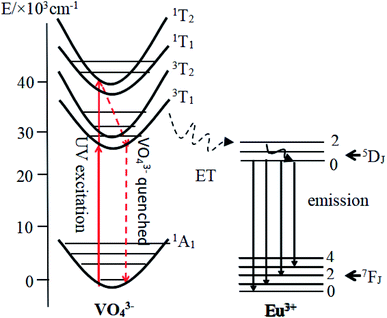
Fig. 5 exhibits PL emission and excitation spectra of typical CMV:xEu3+ samples. One can notice from Fig. 5(a) that the emission spectra of CMV:xEu3+ (x = 1.5–20 mol%) consists of typical broadband emission and sharp peak emission while the spectrum of pure CMV only has broadband emission. The broadband emission of vanadate phosphors ranging from 400 nm to 800 nm with the maximum at 520 nm corresponds to charge transition (CT)7,16,17 of [VO4]3−. The sharp peak detected at 617 nm corresponds to electric dipole transition (5D0 → 7F2) of Eu3+, which indicates that Eu3+ ions occupy non-inversion symmetry sites in the crystal lattice. The spectra in Fig. 5(a) were normalized according to the PL intensity at 520 nm. It can be found that the relative intensity of the sharp emission peak of Eu3+ at 617 nm increases with the x value and reaches a maximum point at x = 15%. The relative low intensity for the sample with 20% Eu3+ may be attributed to concentration-quenching effect.39–42The excitation spectra of different Eu3+ concentration were measured at two emission wavelength, 520 nm and 617 nm, which were shown in Fig. 5(b) and (c) respectively. The excitation spectra monitored at 520 nm are typical excitation peaks of [VO4]3−, which show a light red-shift with Eu3+ concentration increasing as shown in Fig. 5(b). The excitation peak of [VO4]3− is asymmetric and can be decomposed into two Gaussian components Ex1 (1A1 → 1T1, 276 nm) and Ex2 (1A1 → 1T2, 314 nm) corresponding to the intrinsic transitions in VO4 tetrahedron43,44 as shown in the diagram of Fig. 6. The red-shift observed in Fig. 5(b) is actually the change of relative intensity between Ex2 and Ex1, which reflects the structure modification of CMV induced by small amount of Eu3+ addition.
The excitation spectra obtained at 617 nm (Fig. 5(c)) comprise both broad band between 220 nm and 350 nm and typical sharp excitation peaks of Eu3+. Both Eu–O charge transfer band (CTB)45–47 and V–O charge transfer are in the wavelength range from 220 nm to 350 nm. The broad bands in Fig. 5(c) show a blue-shift with x value which is resulted from the enhancement of the component peak around 270 nm. The excitation around 270 m can be both ascribed to Eu–O CTB and Ex1 of [VO4]3− excitation. Based on the above discussion, we deduced that the energy of Eu3+ emission at 617 nm mainly come from the energy transfer between [VO4]3− and Eu3+ at low Eu3+ concentration, and with the raise of Eu3+ concentration both energy transfer from [VO4]3− to Eu3+ and Eu–O CTB contribute to Eu3+ emission at 617 nm.
No evidence of Eu2+ was found in all excitation and emission spectra. In addition, all the samples were prepared in air. No reductive gas was used in the preparation process. Thus, it is convinced that all the europium element exists in the form of trivalent Eu3+ ions.
According to the above discussion, the emission process was illustrated by diagram in Fig. 6. After absorbing a UV photon, the electron of the tetrahedral [VO4]3− group is excited from 1A1 state to 3T1,2 state. The energy of the excited electrons is partially transferred to Eu3+ ions, and emitted red light by the well-known 5D0 → 7FJ transitions of Eu3+ ions. The residual energy emitted yellow-green light by 3T1,2 → 1A1 transition of [VO4]3− tetrahedra.
It has been found from Fig. 5(a) that the relative intensity of 617 nm emission comparing with that of the 520 nm emission varies with Eu3+ concentration, so that luminous color is dependent on Eu3+ addition. In fact, the emission color of the obtained phosphor can be tuned easily from yellow-green to white, and eventually to red by manipulating the addition amount of Eu3+ and the white light emission is gained when x = 15%, which is shown in Fig. 5(e).
3.3 Temperature-dependent luminescent properties of CMV:15 mol% Eu3+
In order to examine the trend of temperature-dependent luminescent properties, we carried out a study on the PL emission spectra of CMV:15 mol% Eu3+ powder sample at different temperature (from 300 to 480 K), which were recorded in Fig. 7.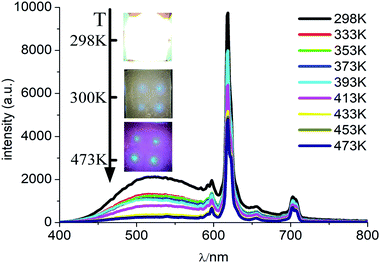 | ||
| Fig. 7 PL spectra of CMV:15 mol% Eu3+ at different temperatures excited by 310 nm light. Inset is the photographs of the device with the UV light on at different temperature. | ||
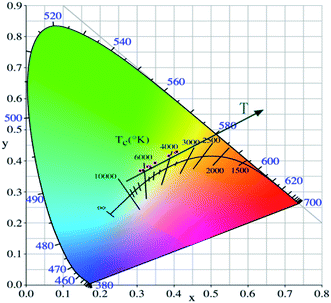
As shown in Fig. 7, the intensities of broadband emission (at 520 nm) and sharp peak emission (at 617 nm) decrease with temperature rising, and the reducing speed at 520 nm is quicker comparing with that of 617 nm. The difference in speed could be observed in Fig. 8(a), and the ratio (defined as R) of I520 to I617 changes linearly. The luminous color is studied continuously by heating the material from 300 K to 480 K. Color changes can be observed visibly in the inset of Fig. 7, presenting that luminous color could be tuned from white to red via yellow. The CIE coordinates at different temperature are on a line passing by the CIE coordinate image as shown in Fig. 9. The white phosphor has a correlated color temperature of 4964 K and CIE coordinates of (0.3496, 0.3935).
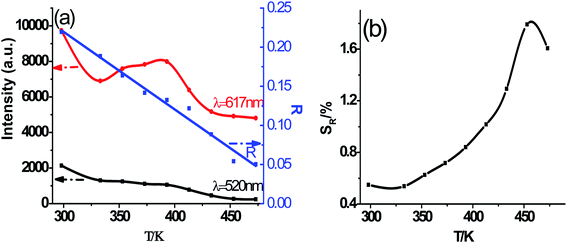 | ||
| Fig. 8 (a) Luminescence intensity variation with temperature elevating at 520 nm and 617 nm, and ratio (R) of I520 to I617, (b) the relative sensitivity (SR). | ||
Because of the temperature-dependent luminescent property, the materials may be applied as temperature sensing materials. The relative sensitivity SR defined as the relative change of R with respect to the variation of T is obtained as follows20,48–50
 | (1) |
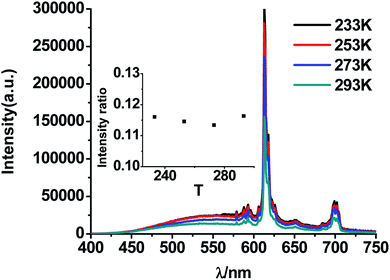 | ||
| Fig. 10 PL spectra of CMV:15 mol% Eu3+ at different temperatures (under 0 °C) excited by 310 nm light. Inset is the ratio of I520 to I617 at different temperature (under 0 °C). | ||
4. Conclusion
Eu-contained calcium magnesium vanadate (CMV:Eu3+) phosphors were prepared and the product is a mixture of Ca5Mg4V6O24 and EuVO4 with micro-homogeneity. The phosphor show both a broad emission with an maximum at 520 nm coordinating to CT of [VO4]3– and a sharp emission around 617 nm ascribing to electric dipole transition (5D0 → 7F2) of Eu3+, and it can be proved that the efficient energy transfer from [VO4]3− to Eu3+ exists. The emission color of the product can be tuned from yellow-green to red via white by both adjusting the Eu concentration and the temperature. The intensities of sharp emission at 617 nm first increase and then decrease with Eu3+ concentration, and the maximum is reached at the value of 20 mol%. The white light emission is also realized at the value of 15 mol%. The ratio between the intensities (R) of broad emission around 520 nm and that of the sharp peak at 617 nm changes linearly as the temperature rising from 295 K to 480 K. The relative sensitivity reaches the maximal value at 455 K and the maximal value equals to 1.83%, which promises a potential application of CMV:Eu3+ phosphor as a luminescent temperature sensor.Conflicts of interest
There are no conflicts to declare.Acknowledgements
This work was supported by the projects from the National Natural Science Foundation of China (grant no. 51632003, 51302106, 51501071 and 51802114).References
- K. Z. Zheng, Z. Y. Liu, C. J. Lv and W. P. Qin, J. Mater. Chem. C, 2013, 1, 5502–5507 RSC.
- F. C. Hawthorne, J. Solid State Chem., 1977, 22, 157–170 CrossRef CAS.
- G. M. Thomas and M. J. Damzen, Opt. Express, 2011, 19, 4577–4582 CrossRef CAS PubMed.
- J. Azkargorta, M. Bettinelli, I. Iparraguirre, S. Garcia-Revilla, R. Balda and J. Fernández, Opt. Express, 2011, 19, 19591–19599 CrossRef CAS PubMed.
- Y. J. Huang, Y. P. Huang, H. C. Liang, K. W. Su, Y. F. Chen and K. F. Huang, Opt. Express, 2010, 18, 9518–9524 CrossRef CAS PubMed.
- M. Koichi, K. Miyamoto, S. Ujita, T. Saito, H. Ito and T. Omatsu, Opt. Express, 2011, 19, 18523–18528 CrossRef CAS PubMed.
- Y. L. Huang, Y. M. Yu, T. Tsuboi and H. J. Seo, Opt. Express, 2012, 20, 4360–4368 CrossRef CAS PubMed.
- D. Haranath, H. Chander, P. Sharma and S. Singh, Appl. Phys. Lett., 2006, 89, 173118 CrossRef.
- X. Y. Liu, N. Ding, C. N. Qu, Y. S. Zhu and T. Ye, Chin. J. Lumin., 2017, 38, 587–593 CrossRef.
- E. I. Voit, A. V. Voit, A. V. Gerasimenko and V. I. Sergienko, J. Struct. Chem., 2000, 41, 206–211 CrossRef CAS.
- I. A. Bondar and N. A. Toropov, Mater. Res. Bull., 1967, 2, 479–489 CrossRef CAS.
- A. A. Kaukis, J. E. Tiliks, V. V. Tamuzhs, A. A. Abramenkovs and V. G. Vasiljev, Fusion Eng. Des., 1991, 17, 13–16 CrossRef CAS.
- P. R. K. Kunchala, S. N. Achary, A. K. Tyagi and B. S. Naidu, Cryst. Growth Des., 2019, 19, 3379–3388 CrossRef.
- X. Liu, Z. Xu, C. Chen, D. Tian, L. Yang and X. Luo, J. Mater. Chem. C, 2019, 7, 2361–2375 RSC.
- S. E. Kichanov, Y. E. Gorshkova, G. E. Rachkovskaya, D. P. Kozlenko, G. B. Zakharevich and B. N. Savenko, Mater. Chem. Phys., 2019, 237, 121830 CrossRef CAS.
- J. Pejchal, J. Barta, T. Trojek, R. Kucerkova, A. Beitlerova and M. Nikl, Radiat. Meas., 2019, 121, 26–31 CrossRef CAS.
- C. J. Liu, Z. F. Zhou and Y. Zhang, J. Lumin., 2019, 213, 1–5 CrossRef CAS.
- S. M. Rafiaei, T. D. Isfahani, H. Afshari and M. Shokouhimehr, Mater. Chem. Phys., 2018, 203, 274–279 CrossRef CAS.
- Y. S. Chang, F. M. Huang and Y. Y. Tsai, J. Lumin., 2009, 129, 1181–1185 CrossRef CAS.
- X. Min, Z. Huang and M. Fang, J. Nanosci. Nanotechnol., 2016, 16, 3684–3689 CrossRef CAS PubMed.
- J. Y. Park, J. W. Chung and H. K. Yang, Optik, 2018, 155, 384–389 CrossRef CAS.
- J. Huang, Q. Li and D. Chen, Mater. Sci. Eng., B, 2010, 172, 108–113 CrossRef CAS.
- W. Xu, X. Y. Gao, L. J. Zheng, Z. G. Zhang and W. W. Cao, Opt. Express, 2012, 20, 18127–18137 CrossRef CAS PubMed.
- V. K. Rai, D. K. Rai and S. B. Rai, Sens. Actuators, A, 2006, 128, 14–17 CrossRef CAS.
- P. V. dos Santos, M. T. de Araujo, A. S. Gouveia-Neto, J. A. Medeiros Neto and A. S. B. Sombra, Appl. Phys. Lett., 1998, 73, 57–580 CrossRef.
- D. G. Lee, C. R. Kesavulu, S. S. Yi, S. Cho, K. Jang, S. H. Kim and J. H. Jeong, J. Nanosci. Nanotechnol., 2014, 14, 5877–5880 CrossRef CAS PubMed.
- X. Min, M. H. Fang, Z. H. Huang, Y. G. Liu, C. Tang and X. W. Wu, Inorg. Chem., 2014, 53, 6060 CrossRef CAS PubMed.
- D. A. Hakeem and K. Park, J. Nanosci. Nanotechnol., 2015, 15, 5074 CrossRef PubMed.
- L. K. Bharat, S. K. Jeon, K. G. Krishna and J. S. Yu, Sci. Rep., 2017, 9, 42348 CrossRef PubMed.
- W. Xu, C. R. Li, B. S. Cao and B. Dong, Chin. Phys. B, 2010, 12, 127804 CrossRef.
- X. Yang, Z. Fu and Y. Yang, J. Am. Chem. Soc., 2015, 98, 2595–2600 CAS.
- Y. M. Yang, Ceram. Int., 2014, 40, 9875–9880 CrossRef CAS.
- M. Quintanilla, E. Cantelar, F. Cusso and M. Villegas, Appl. Phys. Express, 2011, 4, 022601 CrossRef.
- L. Li, C. F. Guo, S. Jiang, D. K. Agrawal and T. Li, RSC Adv., 2014, 4, 6391 RSC.
- P. V. dos Santos, M. T. de Araujo and J. A. Gouveia-Neto, Appl. Phys. Lett., 1998, 73, 578–580 CrossRef CAS.
- B. Dong, D. P. Liu, X. J. Wang, T. Yang, S. M. Miao and C. R. Li, Appl. Phys. Lett., 2007, 90, 4743 Search PubMed.
- G. Bayer, J. Am. Ceram. Soc., 1965, 48, 600 CrossRef CAS.
- H. Müller-Buschbaum and M. von Postel, Z. Anorg. Allg. Chem., 1992, 615, 101–103 CrossRef.
- T. Nakajima, M. Isobe and T. Tsuchiya, J. Phys. Chem. C, 2010, 114, 5160–5167 CrossRef CAS.
- X. Min, Z. Huang, M. Fang, Y. G. Liu, C. Tang and X. Wu, J. Nanosci. Nanotechnol., 2016, 16, 3684–3689 CrossRef CAS PubMed.
- J. Y. Park, J. W. Chung and H. K. Yang, Optik, 2018, 155, 384–389 CrossRef CAS.
- Y. C. Kang and S. B. Park, Res. Bull., 1999, 14, 2611–2615 CAS.
- Y. Pu, Y. Huang, T. Tsuboi, W. Huang, C. Chen and H. J. Seo, Mater. Lett., 2015, 149, 89–91 CrossRef CAS.
- S. Zhou, C. K. Duan and S. Han, Dalton Trans., 2018, 47, 1599–1603 RSC.
- G. Blasse and B. C. Geiabmaier, A vanadate-based white light emitting luminescent material for temperature sensing, Springer Berlin, 1994 Search PubMed.
- G. S. Ofelt, J. Chem. Phys., 1962, 37, 511 CrossRef CAS.
- B. R. Judd, Phys. Rev., 1962, 127, 750 CrossRef CAS.
- A. F. Pereira, K. U. Kumar and W. F. Silva, Sens. Actuators, B, 2015, 213, 65–71 CrossRef CAS.
- X. Tian, X. Wei and Y. Chen, Opt. Express, 2014, 22, 30333–30345 CrossRef PubMed.
- R. Shi, L. T. Lin and P. Dorenbos, J. Mater. Chem. C, 2017, 5, 10737–10745 RSC.
- J. Eldridge, J. Lumin., 2019, 214, 116535 CrossRef CAS.
- S. D. Li, Q. Y. Meng, S. C. Lü and W. J. Sun, Spectrochim. Acta, Part A, 2019, 214, 537–543 CrossRef CAS PubMed.
| This journal is © The Royal Society of Chemistry 2019 |

