
 Open Access Article
 This Open Access Article is licensed under a Creative Commons Attribution-Non Commercial 3.0 Unported Licence
Development of miniaturized fluorimetric device for caffeine determination using a smartphone†
Natália da Costa Luchiari,
Gabrielen Alves da Silva,
César Augusto Marasco Júnior and
Paulo Clairmont Feitosa de Lima Gomes *
*
Department of Analytical Chemistry, Unesp, National Institute for Alternative Technologies of Detection, Toxicological Evaluation and Removal of Micropollutants and Radioactives (INCT-DATREM), Institute of Chemistry, P.O. Box 355, 14800-900 Araraquara (SP), Brazil. E-mail: paulo.clairmont@unesp.br
First published on 30th October 2019
Abstract
Caffeine is an element that is consumed worldwide. It is present in many products such as beverages, chocolate, coffee, tea, energy drinks and medicines. Portable 3D devices working together with colorimetric and fluorimetric reactions have been able to determine the presence of caffeine in different kinds of samples. Also, digital image-based methods using smartphones have conferred portability and accessibility to miniaturized devices that are innovative and promising options for quick and low cost analyses. This study proposes a miniaturized fluorimetric device to determine caffeine by digital image using a smartphone. The OpenCamera app was used to capture images that were processed using ImageJ software to obtain RGB channels values. The red (R) channel signal intensity was selected as the analytical response. The device developed was applied to determine caffeine in an energy drink and medicines. The method developed presented a linear range from 100 to 600 mg L−1 of caffeine, and quantification (LOQ) and detection (LOD) limits of 100 mg L−1 and 30.0 mg L−1, respectively. The caffeine concentration found in the products analyzed was 328 mg L−1 (±2.5%) for the energy drink, 345 mg L−1 (±15%) for medicine A and 322 mg L−1 (±7.3%) for medicine B. The proposed device presented important characteristics such as low cost, required small volumes of reagents and samples, quick analysis, portability and suitable to be applied in complex matrices.
1 Introduction
Considered as a biomarker of anthropogenic activity,1,2 caffeine, with molecular formula C8H10N4O2, is an organic compound of natural occurrence from the alkaloid family belonging to the methylxanthine class. It is a widely used compound in the pharmaceutical and personal care products industries, food industries and many others sectors, therefore it is present in a wide variety of products consumed daily by the world population.3Proving this large presence in many products, for example, soft and energy drinks, according to the Food and Drug Administration (FDA), a can of soft drink contains around 30–40 mg of caffeine, while just 236 mL of energy drink contain 40–250 mg of caffeine.4 The FDA recommends the highest level of caffeine in beverages should not exceed 200 mg L−1.5
For the determination of caffeine, the review of De Maria and Moreira (2007)6 reports the most used analytical methods for this purpose, such as gravimetry, spectrophotometry, gas chromatography (GC) and liquid chromatography (LC). Nowadays, liquid chromatography coupled to sequential mass spectrometry (LC-MS/MS) is the technique of choice to determine caffeine in many analytical matrices. However, this and the other techniques aforementioned are not portable and require trained professionals, solvent consumption and sample pretreatment procedures. In turn, electronic and digital devices have become powerful and useful tools for analytical chemistry allowing the emergence of methods based on digital images for the acquisition of qualitative and quantitative information of a target analyte, in place of some high cost instrumental techniques like LC-MS/MS.7,8
Digital image analysis methods are based on the use of a digital sensor like digital cameras, smartphones, scanners and others used to capture images resulting from colorimetric/fluorimetric reactions and posterior conversion of these images into measurable data, such as values of the primary colors red (R), green (G) and blue (B) in the RGB approach as suggested by the International Color Consortium (ICC).8,9
The literature shows smartphone devices are being used in different proposals, such as detection of bisphenol A in water samples,10 determination of ascorbic acid in fruits,11 color in honey,12 captopril in dosage forms,7 sulfite in beverages,9 copper in sugar cane spirits13 and formaldehyde in cosmetics.8
These colorimetric and fluorimetric reactions allied to the development of 3D printed microsystems have shown promise and a trend towards chemical analysis due to its easy implementation and increased analytical frequency that favor a more accessible and easy method to be executed. Furthermore, the amounts of samples and reagents are reduced, as well as the analysis time, the chemical residues, and occupational exposure of the analyst, which makes the colorimetric and fluorimetric reactions a suitable alternative for quick and low cost analysis.14,15
For the caffeine detection in aqueous samples by digital image methods, a fluorimetric reaction with the fluorescent dye 8-hydroxypyrene-1,3,6-trisulfonate (HPTS) could be used, as previously published by Rochat et al.16 The reaction mechanism involves the formation of a charge transfer complex, from the interaction between caffeine and HPTS, that has fluorescence properties in the visible ultraviolet (UV-VIS) region.
The reaction in miniaturized scale and the use of smartphones have shown a strong trend towards analysis using spot-tests for varied kinds of chemical reactions, making it possible to perform in loco analysis. Thus, the aim of this research is to develop a portable, easy and low cost device for caffeine determination in energy drinks and medicines.
2 Experimental
2.1 Chemicals and samples
Caffeine standard (MM 194.19 g mol−1, CAS 58-08-2) and HPTS (MM 524.39 g mol−1, CAS 6358-69-6) were purchased from Sigma-Aldrich®. Caffeine stock solutions were prepared at the concentration of 2000 mg L−1 in ultrapure water. The buffer solution was prepared from aqueous solutions of 1.00 mol L−1 of monobasic potassium phosphate (KH2PO4, MM 136.09 g mol−1, CAS 7778-77-0) and dibasic potassium phosphate (K2HPO4·3H2O, MM 174.18 g mol−1, CAS 7758-11-4) both purchased from Sigma-Aldrich®. The HPTS stock solution was prepared at the concentration of 100 μmol L−1 in phosphate buffer solution of 0.100 mol L−1 at pH 6.3. Working standard solutions were prepared weekly and stored in an amber bottle in a refrigerator at 4 °C. The standard stock solutions used in this study were prepared using ultrapure water (resistivity < 18.2 MΩ cm at 298 K) from a Milli-Q water system (Synthesis MILLIPORE). Three samples were analyzed by the proposed method: an energy drink commercial sample, acquired from a market located in Araraquara, SP-Brazil, and two medicine samples purchased from a drugstore in the same city. According to the labels, these three samples contained caffeine in their composition.2.2 Instrumentation
The reference method was developed in a spectrofluorimeter RF-1501 (Shimadzu Corporation, Tokyo, Japan). The scanning range was 480–700 nm, with emission and excitation wavelengths at 509 nm and 460 nm, respectively. The volume of 1500 μL of sample containing caffeine was reacted with the same volume as the fluorophore prepared in buffer solution.The portable system was developed using a 3D Cloner ST printer (Ind. Schumacher Ltda., Marechal Cândido Rondon-PR, Brazil) for analysis of fluorescence decay reactions in reduced sample volumes. The external structure of the device body was printed in black PLA (polylactic acid). An insert was used as the analytical bucket for this system. An optical fiber (1.00 × 20.0 mm) was used to direct the light generated by the blue light-emitting diode (LED) source to the wall of the bucket. The LED was connected to an Arduino nano microcontroller system (Atmega 328, Arduino, USA). An adjustable resistor (potentiometer) of 100 kΩ that divides the voltage of the system was used to control the radiation intensity of the system. The system was powered by an OTG cable that connects the Arduino to the smartphone Motorola Moto G5 Plus which used its battery as the power supply.
2.3 Data analysis
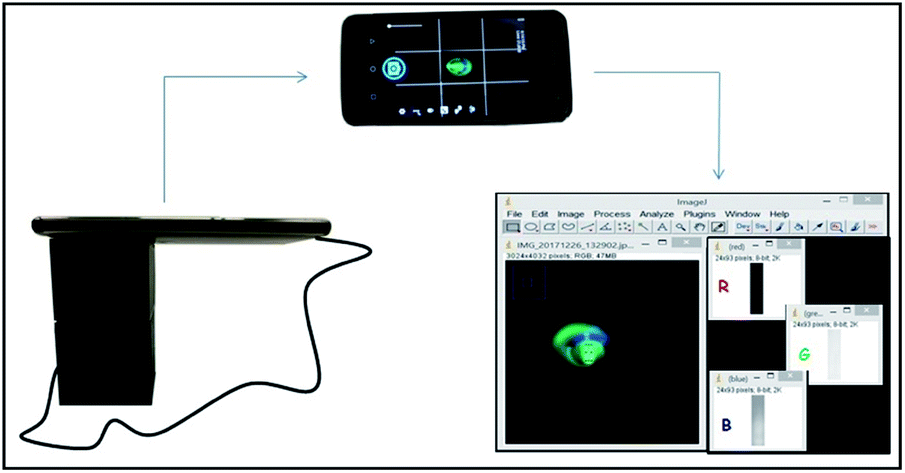 | ||
| Fig. 1 Schematic representation of the fluorimetric device, image acquisition and processing step. | ||
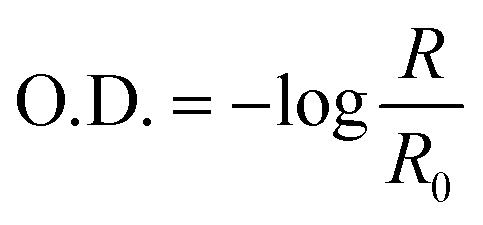
To ensure that the same region was analyzed a region of optical interest (ROI) was defined and applied. This tool ensures that the area analyzed shows fixed values and, consequently, repeatability and reliability. The analytical signal was converted to optical density (O.D.) and, then, was calculated using the equation:
 | (1) |
2.4 Figures of merit
The methods in this study were validated according to parameters of precision (intra-day and inter-day), limit of quantification (LOQ), limit of detection (LOD), sensitivity and linearity. LOD was determined by the ratio between LOQ and a factor 3.30 representing the lowest concentration value for the analyte to be accurately detected by an analytical method. LOQ was determined as the lowest analyte concentration at which it was possible to quantify with specified precision (% RSD less than 20.0%), which was the first point of the analytical curve in agreement with the Food and Drug Administration (FDA)18 and International Council for Harmonization of Technical Requirements for Pharmaceuticals for Human Use (ICH).19 Linearity was obtained by spiking the samples of interest at increasing concentrations of caffeine for a range of 100 to 600 mg L−1 (n = 5) in the reference and proposed methods. Sample analyses by the standard addition method were performed in triplicate (n = 3) and the means of the values were obtained as analytical responses. The sensitivity was obtained by the calibration curve slope. Intra- and inter-day precision of the methods were evaluated based on the relative standard deviation (% RSD) from the calibration curve performed in triplicate.2.5 Application of the proposed method
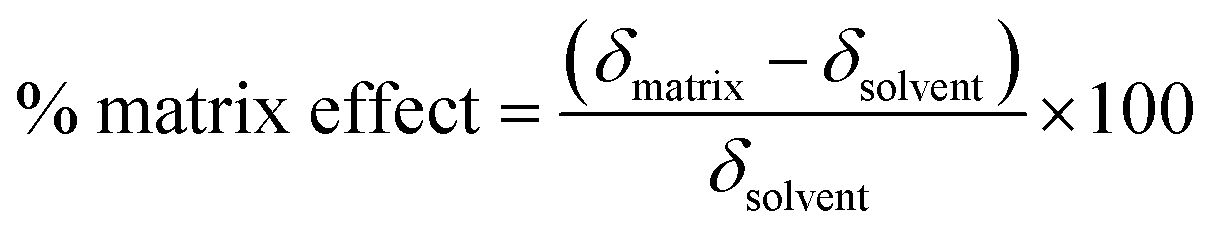
The reference and proposed methods were applied to one sample of energy drink and two samples of medicines. Matrix effects and sample dilutions were evaluated for each one. Among many strategies to evaluate the matrix effect, it was chosen to compare the analytical curve slope obtained in the blank sample (solvent) to the matrix after a dilution to achieve 1.00 mg L−1 where there was no caffeine analytical signal.20 The matrix effect was evaluated using the following equation suggested by Gros, Rodríguez-Mozaz and Barceló:21
 | (2) |
For the reference method, the energy drink sample was diluted to 1.00 mg L −1 and standard additions from 100 to 600 mg L −1 were performed. The same previous procedure was applied in the fluorimetric device. Similarly, standard addition calibration was performed to determine caffeine in the medicines using both the reference and proposed methods. For the analysis, an energy drink solution was prepared with caffeine concentration of 300 mg L −1. The same process was undertaken for the medicines samples. Solutions of these medicines were prepared in ultrapure water and, before the use, were filtered using a 0.45 μm filter.
3 Results and discussion
3.1 Development of the reference method
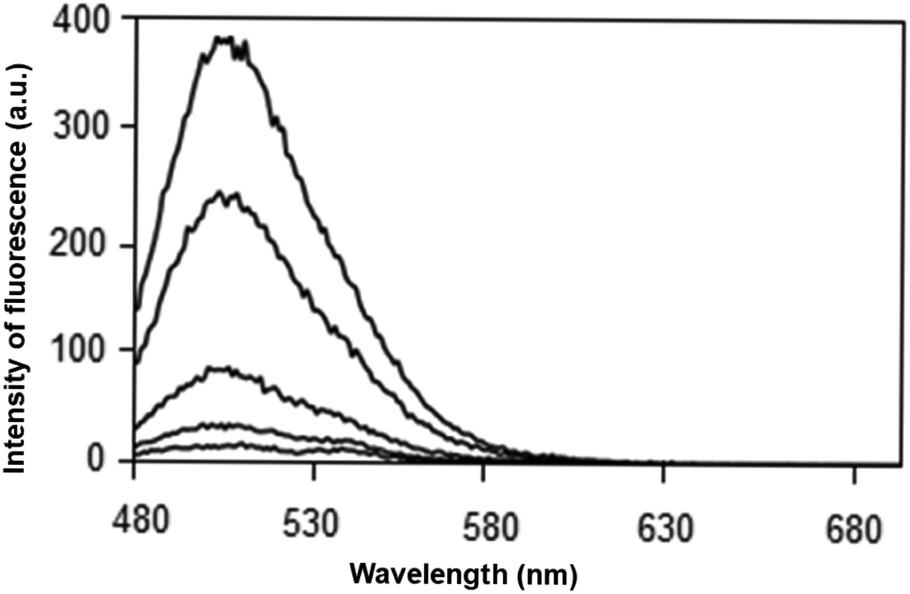 | ||
| Fig. 2 Emission spectrum at 460 nm for caffeine solution in water at concentrations of 0, 100, 220, 530 and 600 mg L−1. | ||
As observed in Fig. 2, the interaction between HPTS and caffeine was observed at a concentration ranging from 100 to 600 mg L−1 in ultrapure water. The excitation spectrum at 460 nm showed the highest emission signal at 509 nm. The maximum fluorescence intensity was observed close to 400 a.u. values. Therefore, HPTS proved to be a potential alternative for the caffeine determination.
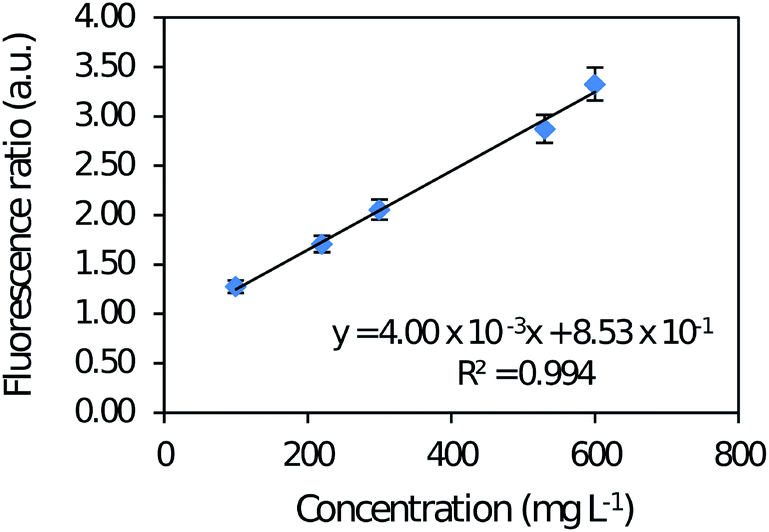 | ||
| Fig. 3 Analytical curve of caffeine in aqueous solution with a concentration range varying from 100 to 600 mg L−1, in spectrofluorimeter RF-1501. | ||
Analysis of variance (ANOVA) was applied to the spectrofluorimetric method data and demonstrated linearity without lack-of-fit. Intra-day precision was 0.660 to 1.56% and inter-day precision was 1.12 to 2.36% both in the same concentration range. LOD and LOQ of the reference method were 30.0 and 100 mg L−1, respectively.
3.2 Development of portable fluorimetric device method
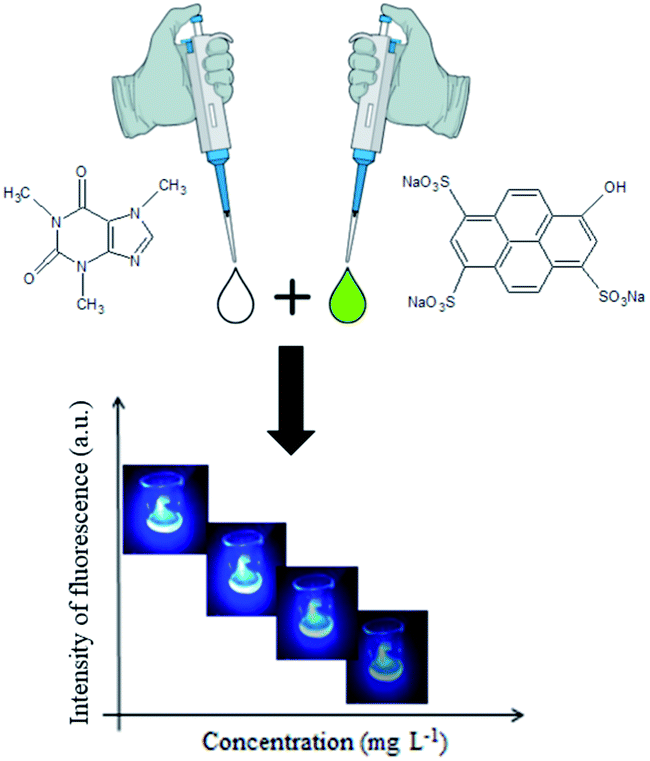 | ||
| Fig. 4 Schematic diagram of the fluorimetric reaction between caffeine (left) and HPTS (right) resulting in a product fluorescence intensity varying with caffeine concentration. | ||
3.3 Comparison between the methods
According to the results obtained for both methods, a comparison regarding the figures of merit is presented in Table 1.| Analytical parameters | Fluorimeter | Fluorimetric device |
|---|---|---|
| Ultrapure water | Ultrapure water | |
| Linear range (mg L−1) | 100–600 | 100–600 |
| LOQ (mg L−1) | 100 | 100 |
| LOD (mg L−1) | 30 | 30 |
| RSD intraday (%) | 0.660–1.56 | 0.100–0.610 |
| RSD interday (%) | 1.12–2.36 | 0.340–0.670 |
| Sensitivity | 4.00 × 10⁻³ | 1.00 × 10⁻⁴ |
| Linear coefficient | 8.53 × 10⁻¹ | 1.63 × 10⁻² |
| R2 | 0.994 | 0.996 |
| Reaction time (minutes) | 4 | 4 |
Both methods did not present variations in the values obtained for the LOQ and LOD. In both methods, the linear range of the study was the same, and for the proposed method there was no loss of linearity, demonstrating an advantage of the proposed device, since the literature reports loss of linearity for bands greater than 100 units of concentration in studies involving image acquisition.24,25 Furthermore, the proposed method was shown to be applicable and precise for caffeine determination in real samples, with a relative standard deviation (% RSD) intra-day and inter-day lower than 1.00%.
3.4 Determination of caffeine in commercial samples
After the validation, the portable method proved to be adequate for quantifying caffeine in medicines and the energy drink in a linear range of 100 to 600 mg L−1. Therefore, Table 2 shows the caffeine concentrations in the studied samples as well as their respective analytical curves and measured relative error in the matrices.| Matrix | Analytical curve | R2 | C300 (mg L−1) | Relative error (%) |
|---|---|---|---|---|
| Energy drink | y = 7.00 × 10⁻⁵x + 9.25 × 10⁻² | 0.985 | 328 | 2.5 |
| Medicine A | y = 8.00 × 10⁻⁵x + 7.74 × 10⁻² | 0.989 | 345 | 15 |
| Medicine B | y = 4.00 × 10⁻⁵x + 7.91 × 10⁻² | 0.995 | 322 | 7.3 |
The caffeine concentration expected in each sample was 300 mg L−1. The proposed method obtained a relative error of lower than 15% for the energy drink and medicine samples demonstrating the proposed method has suitable precision and accuracy for this analysis.
The energy drink and medicine samples have different compositions; those components could affect the interaction of caffeine and HPTS, in addition to the fluorescence signal. The standard addition was done for both samples in order to minimize this effect. Although, the samples were diluted to 1.00 mg L−1 of caffeine for analysis, there was a matrix effect. The matrix effect obtained for medicine samples A and B compared to the analytical curve slope performed in ultrapure water demonstrated a signal suppression of 20 and 60%. There was analytical signal suppression since HPTS could interact with the sample components and was less available to react with caffeine.
The samples analyzed using the fluorimetric device and spectrofluorimeter were compared through test-F and test-t at 95%. The F-test presented p-value (0.466) > α (0.0500) which means the samples present equivalent variances. Thereafter, the t-test obtained p-value (0.883) > α (0.0500) that demonstrates the caffeine concentrations in each sample using both methods (fluorimetric device and spectrofluorimeter) are not different statistically.
In this study, the results obtained from the digital images were compared with data reported in the literature. McCracken et al.26 also used the HPTS fluorophore to determine caffeine in a paper-based device. In another study, McCracken et al.10 also presented a proposed fluorimeter response using HPTS for bisphenol A (BPA), estradiol and nonylphenol as a promising and low cost portable analytical alternative. In both studies, smartphone image acquisition and ImageJ software were used. However, the proposed method in this work has some advantages over the previously mentioned studies, such as a linear range broader than both cited studies and also the LOD is three times smaller than the cited studies. Table 3 illustrates a brief comparison between the proposed device and previous published papers. According to Rochat et al.16 the reaction involving HPTS and caffeine presented the highest quenching emission compared to other compounds structurally similar to caffeine such as adenine, adenosine, ephedrine, guanosine, histidine, indole, paracetamol, phenylalanine, theobromine, theophylline, tryptophan, tyramine, tyrosine and uracil. The same authors obtained an analytical curve from 0 to 4 mmol L−1 which corresponds to 0–776 mg L−1, a similar result is obtained by the proposed method. HPTS dye presents a quantum yield varying from 0.82 to 1.00.27,28 In the proposed method the quantum yield calculated was 0.99.
| References | Parameters | |||
|---|---|---|---|---|
| Linear range (mg L−1) | LOD (mg L−1) | Setup | Samples | |
| Hernandez-Aldave et al.29 | 9.70–970 | 4.65 | Nafion graphite nanoplatelets | Soft drink |
| Nemati et al.30 | 0.388–13.6 | 0.00970 | Sulfur-doped quantum dots | Soft drink |
| Deng et al.31 | 5.00–30.0 | 1.00 | Silver nanoparticles | Soft drink |
| Siering et al.32 | 0.970–5.82 | — | Supramolecular fluorescence | Soft drink |
| McCraken et al.26 | 100–400 | 100 | Paper | Water |
| McCraken et al.10 | 2.20 × 10⁻³–27.2 | — | Bucket | Water |
| Rochat et al.16 | 0–776 | — | Cuvette | Soft drink |
| Monteiro et al.33 | 0.485–194 | 0.570 | Cork-graphite sensor | Soft drink |
| Present study | 100–600 | 30.0 | Insert | Soft drink and medicines |
As observed, the proposed fluorimetric device allowed the determination of caffeine by using a portable, quick and low cost device. Also, it allowed reduced reagent and sample consumption that was fifteen times smaller when compared to the fluorimeter analysis, and raised analytical frequency without using classical and expensive analytical equipment, decreasing the analysis price. The estimated analysis cost, including the system used to capture the images, was US $1.00, not considering the smartphone cost, since it is a technology widely used. The cost raises to US $7.50 including the optical fiber, Arduino Nano and the glass insert used in this device.
4 Conclusions
The proposed device proved to be a promising analytical tool to determine caffeine in commercial beverages and medicines with advantages such as being portable and low cost. The matrix effect demonstrated signal suppression for energy drink and medicine samples, and it was minimized by standard addition calibration. The linear wide range obtained for the energy beverage and medicine samples was from 100 to 600 mg L−1. This is an important analytical advantage for the proposed device, mainly smartphone data acquisition, which usually presents a limited work range of 100 concentration units. The proposed device is suitable to be used for caffeine determination in an energy drink and medicine samples with a reduced amount of reagent and sample consumption, requiring only 50 μL of sample. Moreover, the method and fluorimetric device proposed are suitable to be used for caffeine determination in remote areas with limited analytical resources requiring only a smartphone.Conflicts of interest
There are no conflicts of interest to declare.Acknowledgements
The authors are grateful to Fundação de Amparo à Pesquisa do Estado de São Paulo (FAPESP number 16/03369-3, 18/22393-8 and INCT-DATREM number 14/50945-4), Conselho Nacional de Desenvolvimento Científico e Tecnológico (CNPq) and Coordenação de Aperfeiçoamento de Pessoal de Nível Superior (CAPES).References
- J. Wu, J. Yue, R. Hu, Z. Yang and L. Zhang, World Acad. Sci. Eng. Technol., 2008, 44, 438–442 Search PubMed.
- T. G. Santos-Silva, C. C. Montagner and C. B. Martinez, Environ. Toxicol. Pharmacol., 2018, 58, 237–242 CrossRef CAS.
- L. S. Rosenfeld, J. J. Mihalov, S. J. Carlson and A. Mattia, Nutr. Rev., 2014, 72, 23–33 CrossRef.
- FDA, Spilling the Beans: How Much Caffeine is Too Much?, 2019, https://www.fda.gov/ForConsumers/ConsumerUpdates/ucm350570.htm Search PubMed.
- FDA, Multiple Purpose GRAS Food Substances; Caffeine. 21 CFR Sec.182.1180, 2011, https://www.accessdata.fda.gov/scripts/cdrh/cfdocs/cfcfr/CFRSearch.cfm?FR=182.1180 Search PubMed.
- C. A. B. De Maria and R. F. Moreira, Quim. Nova, 2007, 30, 99–105 CrossRef CAS.
- C. G. Ravazzi, M. d. O. K. Franco, M. C. R. Vieira and W. T. Suarez, Talanta, 2018, 189, 339–344 CrossRef CAS.
- R. S. Lamarca, N. d. C. Luchiari, A. F. Bonjorno, J. P. Filho, A. A. Cardoso and P. C. F. Lima Gomes, Anal. Methods, 2019, 11, 3697–3705 RSC.
- L. P. d. S. Benedetti, V. B. dos Santos, T. A. Silva, E. Benedetti-Filho, V. L. Martins and O. Fatibello-Filho, Anal. Methods, 2015, 7, 7568–7573 RSC.
- K. E. McCracken, T. Tat, V. Paz and J. Y. Yoon, RSC Adv., 2017, 7, 9237–9243 RSC.
- V. B. dos Santos, E. K. da Silva, L. M. A. D. Oliveira and W. T. Suarez, Food Chem., 2019, 285, 340–346 CrossRef CAS PubMed.
- M. A. Dominguez and M. E. Centurión, Microchem. J., 2015, 118, 110–114 CrossRef CAS.
- K. D. Pessoa, W. T. Suarez, M. F. dos Reis, M. d. O. K. Franco, R. P. L. Moreira and V. B. dos Santos, Spectrochim. Acta, Part A, 2017, 185, 310–316 CrossRef CAS.
- E. J. Lenardão, R. A. Freitag, M. J. Dabdoub, A. C. Ferreira Batista and C. Da Cruz Silveira, Quim. Nova, 2003, 26, 123–129 CrossRef.
- P. Anastas and N. Eghbali, Chem. Soc. Rev., 2010, 39, 301–312 RSC.
- S. Rochat, S. N. Steinmann, C. Corminboeuf and K. Severin, Chem. Commun., 2011, 47, 10584–10586 RSC.
- M. D. Abràmoff, P. J. Magalhães and S. J. Ram, Biophot. Int., 2004, 11, 36–42 Search PubMed.
- U. S. Food and Drug Administration (FDA), Analytical Procedures and Methods Validation for Drugs and Biologics, 2015, pp. 1–15 Search PubMed.
- International Conference on Harmonisation of Technical Requirements for Registration of Pharmaceuticals for Human use – ICH, Validation of Analytical Procedures: Text and Methodology, 2005, pp. 1–17 Search PubMed.
- M. Gros, M. Petrović and D. Barceló, Talanta, 2006, 70, 678–690 CrossRef CAS.
- M. Gros, S. Rodríguez-Mozaz and D. Barceló, J. Chromatogr. A, 2013, 1292, 173–188 CrossRef CAS.
- J. Demas, Excited State Lifetime Measurements, Academic Press, New York, 1983 Search PubMed.
- N. Turro, Modern Molecular Photochemistry, University Science Books, Sausalito, 1991 Search PubMed.
- S. Soares, M. J. Lima and F. R. Rocha, Microchem. J., 2017, 133, 195–199 CrossRef CAS.
- A. Soni, R. K. Surana and S. K. Jha, Sens. Actuators, B, 2018, 269, 346–353 CrossRef CAS.
- K. E. McCracken, S. V. Angus, K. A. Reynolds and J. Y. Yoon, Sci. Rep., 2016, 6, 27529 CrossRef CAS.
- E. B. de Borba, C. L. C. Amaral, M. J. Politi, R. Villalobos and M. S. Baptista, Langmuir, 2000, 16, 5900–5907 CrossRef CAS.
- D. B. Cordes, S. Gamsey, Z. Sharrett, A. Miller, P. Thoniyot, R. A. Wessling and B. Singaram, Langmuir, 2005, 21, 6540–6547 CrossRef CAS.
- S. Hernandez-Aldave, A. Tarat, J. D. McGettrick and P. Bertoncello, Nanomaterials, 2019, 9, 221 CrossRef CAS.
- F. Nemati, M. Hosseini, R. Zare-Dorabei, F. Salehnia and M. R. Ganjali, Sens. Actuators, B, 2018, 273, 25–34 CrossRef CAS.
- H. Deng, B. Wang, M. Wu, B. Deng, L. Xie and Y. Guo, Int. J. Food Sci. Technol., 2019, 54, 202–211 CrossRef CAS.
- C. Siering, B. Beermann and S. R. Waldvogel, Supramol. Chem., 2006, 18, 23–27 CrossRef CAS.
- M. K. Monteiro, S. S. Paiva, D. R. da Silva, V. J. Vilar, C. A. Martínez-Huitle and E. V. dos Santos, J. Electroanal. Chem., 2019, 839, 283–289 CrossRef CAS.
Footnote |
| † Electronic supplementary information (ESI) available. See DOI: 10.1039/c9ra06220c |
| This journal is © The Royal Society of Chemistry 2019 |