DOI:
10.1039/C9RA06299H
(Paper)
RSC Adv., 2019,
9, 32462-32471
Adsorption mechanism of polyethyleneimine modified magnetic core–shell Fe3O4@SiO2 nanoparticles for anionic dye removal
Received
13th August 2019
, Accepted 6th October 2019
First published on 11th October 2019
Abstract
In this paper, polyethyleneimine modified magnetic core–shell Fe3O4@SiO2 nanoparticles (Fe3O4@SiO2/PEI) were innovatively synthesized and investigated using various techniques such as TEM, TGA, FT-IR, XRD, VSM and XPS. The adsorption performance based on the removal of the anionic dyes Methyl orange and Congo red from aqueous solution was studied systematically. The results showed that the adsorption rate of anionic dyes MO and CR increased rapidly then decreased gradually as the pH increased, the adsorption capacity of Fe3O4@SiO2/PEI for MO was better than that for CR, and the maximum adsorption capacity for MO and CR was 231.0 mg g−1 at pH 4 and 134.6 mg g−1 at pH 6, respectively. The equilibrium adsorption capacities for MO and CR increased rapidly in the initial 40 min, and reached equilibrium in approximately 180 min, while the adsorption capacity for MB was relative low even negligible, demonstrating the strong adsorptive affinity of Fe3O4@SiO2/PEI toward anionic compounds. Both of the adsorption processes followed the pseudo-second-order kinetics model and the Freundlich isotherm model. The mechanism of adsorption was mainly related to electrostatic attraction and the number of active sites occupied by anionic dyes. This study provides valuable guidance and is an effective method for the removal of anionic dyes from aquatic environments.
Introduction
With the rapid growth of modern industry, organic dyes have found increasing application in wide-ranging industrial fields, including textiles, plastics, paper, cosmetics and leather manufacturing, as well as in laboratory research.1,2 However, the application of organic dyes also causes serious water pollution and potential toxicity, mutagenicity, even carcinogenicity to humans and the environment.3,4 In particular, anionic dyes are a major cause for concern because of their high solubility, carcinogenic and mutagenic activity and their high consumption in the textile industry.5 For example, Methyl orange (MO) is a typical anionic dye for both industrial products and laboratory research. It is also difficult to degrade due to its complex structure.6,7 Congo red (CR), containing two azo functional groups, is an industrial synthetic colorant, which has been known to be metabolised to benzidine and to cause allergic reaction. Meanwhile, due to the poor biodegradability, this utilization also causes serious environmental pollution.8,9 Various physical–chemical processes have already been established for the separation of toxic dyes from the aqueous environment.10,11 However, these processes are not always economical and effective because of the complex structure of the dyes and their low biodegradability and recalcitrance.12 Among various possible methods to remove dyes from industrial effluents, the adsorption is considered as the most promising alternative than others in terms of the initial cost, ease of operation and the insensitive to toxic substances.13,14
Polyethyleneimine (PEI), is known to contain a large amount of nitrogen atoms of the amino groups on its macromolecular chains and it is protonated at pH < 10.15 Therefore, it is an ideal adsorbent of anionic contaminants by electrostatic interaction.16,17 Nevertheless, the PEI is preferably soluble in water, so a solid support is required for the attachment of PEI to realize the adsorption performance.18 Despite the surface of SiO2 has abundance of hydroxyl groups, which are able to link the special functional groups of PEI, it is hard to be separated from the aqueous solution. To overcome this drawback, introducing magnetic performance to the adsorbent can be a research hotspot, and magnetic nanoparticles, especially the Fe3O4, have attracted growing concern because of the outstanding characteristics such as low toxicity and easy separation.19 Recently, the magnetic microspheres with core–shell structured have been widely investigated and applied in catalysis and adsorption.20,21 The iron oxide as the core, which could offer high efficiency of separation for convenient recycling, and the silica as the shell, which could offer the active sites of modification, and protect the iron oxide from certain bad reaction conditions. At the same time, it is also avoid the problem that a large amount of adsorption sites are occupied due to the introduction of magnetic particles.22
In this study, a Fe3O4@SiO2/PEI nanocomposite was innovatively synthesized by using Fe3O4 as the core and SiO2 with abundance of surface hydroxyl groups as the shell to form typical core–shell magnetic nanoparticles, on which polymeric PEI was coated on the surface of the magnetic nanoparticles through a cross-linking reaction. To our best knowledge, the analysis of adsorption mechanism by the magnetic PEI to remove anionic dyes from aqueous solutions is still rare, especially for the difference in adsorption of anionic dyes. Therefore, the objective of this paper were to: (1) prepare and characterize polyethyleneimine modified magnetic core–shell Fe3O4@SiO2 nanoparticles (Fe3O4@SiO2/PEI) and apply it as an adsorbent for removal of anionic dyes from aqueous solution; (2) investigate the relevant parameters, including pH, adsorption kinetics and adsorption isotherms to analyze the adsorption performance of Fe3O4@SiO2/PEI for MO and CR in aqueous solutions; and (3) discuss the Fe3O4@SiO2/PEI adsorption mechanisms for MO and CR, especially the difference in adsorption between them, furthermore, the regeneration and reutilization of Fe3O4@SiO2/PEI were also evaluated.
Materials and methods
Materials
A branched polyethylenimine (PEI) with a molecular weight of 25![[thin space (1/6-em)]](https://www.rsc.org/images/entities/char_2009.gif) 000 was obtained from Sigma-Aldrich as a commercial sample in the form of 99 wt% aqueous solution. The anionic dyes MO and CR were obtained from Tianjin Fuchen Co., Ltd., China. The parameters of the anionic dyes are shown in Table 1. FeCl3·6H2O, ethylsilicate (TEOS), anhydrous sodium acetate (CH3COONa), glutaraldehyde solution (50 wt%) and all other chemicals used in this study were purchased from Sinopharm Chemical Reagent Co., Ltd. (Shanghai, China). All the reagents used in the experiments were of analytic quality.
000 was obtained from Sigma-Aldrich as a commercial sample in the form of 99 wt% aqueous solution. The anionic dyes MO and CR were obtained from Tianjin Fuchen Co., Ltd., China. The parameters of the anionic dyes are shown in Table 1. FeCl3·6H2O, ethylsilicate (TEOS), anhydrous sodium acetate (CH3COONa), glutaraldehyde solution (50 wt%) and all other chemicals used in this study were purchased from Sinopharm Chemical Reagent Co., Ltd. (Shanghai, China). All the reagents used in the experiments were of analytic quality.
Table 1 The physical properties of the investigated anionic dyes
| Name |
Methyl orange (MO) |
Congo red (CR) |
| Molecular formula |
C14H14N3SO3Na |
C32H22N6Na2O6S2 |
| Molar mass (g mol−1) |
327.33 |
696.68 |
|
λ
max (nm) |
464 |
497 |
| CAS number |
547-58-0 |
573-58-0 |
Preparation of Fe3O4@SiO2/PEI nanocomposite
Fe3O4@SiO2 was prepared following the methods described in our previous paper.23 The preparation process of Fe3O4@SiO2/PEI following the method reported in the literature.24 Briefly, 0.27 g of Fe3O4@SiO2 was immersed in 63 mL of PEI in the methanol for 30 min by ultrasonication, then 100 mL glutaraldehyde solution (2% w/v) was added dropwise to the mixture solution and mechanically stirred for 30 min at room temperature. Next, the mixture was washed with distilled water several times until the supernatant became clear. The final washed Fe3O4@SiO2/PEI nanocomposite was dried in the refrigeration dryer for the following characterization and adsorption experiments.
Characterization techniques
The morphological investigations of the samples were observed by the transmission electron microscopy (TEM; Tecnai G2 F20, USA). Thermo Gravimetric Analyzer (TGA, Q500, USA) was utilized for the identification of the thermal properties in the range of 0 to 800 °C (heating rate was 10 °C min−1) under nitrogen atmosphere. The surface functional groups of the materials were characterized by Fourier transform infrared spectrum (FT-IR; Nicolet Magna-IR 750, USA) at room temperature. Surface elemental composition of the samples were analyzed using a X-ray photoelectron spectroscopy (XPS; PerkinElmer PHI-5400, USA). The crystal structure of the samples were analyzed by X-ray diffraction spectrometer (XRD; Bruker D8 ADVANCE, German). Magnetic property of the samples was analyzed using a vibration sample magnetometer (VSM; Quantum Design Instruments, USA) at room temperature. Zeta potentials of Fe3O4@SiO2/PEI was determined using a Zeta-sizer Nano-ZS (Malvern, UK) under different pH.
Batch adsorption tests
The batch experiments were performed to study the adsorption properties of the Fe3O4@SiO2/PEI nanocomposite for dyes at room temperature. Typically, 20 mg of the magnetic adsorbent (Fe3O4@SiO2/PEI) was added into 50 mL of two kinds of anionic dye solutions (MO and CR were 100 mg L−1, respectively) and one kind of cationic dye solution (MB was 100 mg L−1). After the adsorption process, the mixture was drawn by a permanent magnet and separated immediately, and the absorbance value of MO, CR and MB was measured using a UV spectrophotometer (UV-2550, SHIMADZU, Japan) at 464, 497 and 664 nm, respectively. The solution pH was adjusted as necessary by adding a small amount of 1 mol L−1 HCl or 1 mol L−1 NaOH during the static adsorption. The adsorption capacity and the removal efficiency of dyes were calculated according to eqn (1) and (2):
Adsorption capacity
| |  | (1) |
| |  | (2) |
where
C0 and
Ce denote the initial and equilibrium dye concentrations (mg L
−1), respectively.
m is the mass of the sorbent (g),
V is the volume of the solution (L).
All the experiments were replicated and only the mean values were presented. The relative errors were less than 5%.
Desorption and regeneration studies
The regeneration of Fe3O4@SiO2/PEI nanocomposite was carried out by desorbing MO and CR with 50 mL of 0.5 mol L−1 NaOH solution, respectively, and then sonicated for 20 min. Finally, the Fe3O4@SiO2/PEI nanocomposites with desorbed anionic dyes were again collected onto the permanent magnet, washed with ultrapure water, and dried at 328 K for the next reusability cycle. The amount of residual MO and CR on the sorbent was analyzed.
Results and discussion
Characterization of Fe3O4@SiO2/PEI
TEM images shown in Fig. 1 perceptually reflect the successful preparation of the Fe3O4, Fe3O4@SiO2 and Fe3O4@SiO2/PEI. As shown in Fig. 1a and b, the average diameter of Fe3O4 and the thickness of silica were around 300 nm and 50 nm, the prepared Fe3O4@SiO2 nanoparticles have rather obvious core–shell structure and relatively smooth surface. After the combination with Fe3O4@SiO2 and PEI to form the Fe3O4@SiO2/PEI nanocomposite, the surface of the Fe3O4@SiO2 nanoparticles were coated by a PEI layer as shown in Fig. 1c.
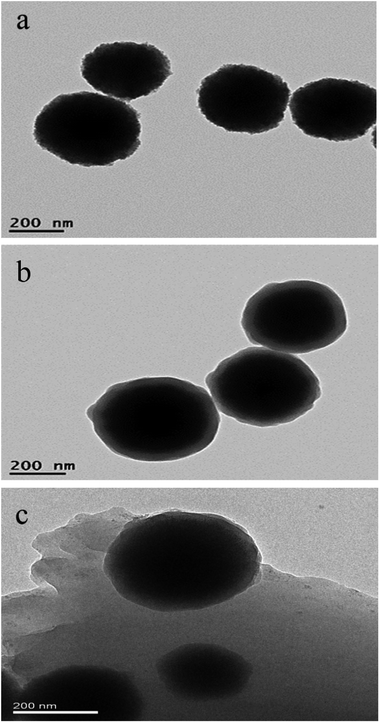 |
| | Fig. 1 The TEM images of (a) Fe3O4, (b) Fe3O4@SiO2 and (c) Fe3O4@SiO2/PEI. | |
To examine the thermal properties of the Fe3O4@SiO2 and Fe3O4@SiO2/PEI, TGA was carried out between 0 °C and 800 °C in a static nitrogen atmosphere (Fig. 2A). It can be seen from the TGA curve of Fe3O4@SiO2 that the mass loss before 200 °C is might due to the releasing of the physically adsorbed water.25 And the mass loss between 150 and 790 °C is estimated to be 9.9%, which reveals the good thermal property of Fe3O4@SiO2. As for the Fe3O4@SiO2/PEI, it is clearly seen that the mass loss occurred in two steps. The first weight loss occurred below 100 °C involves the loss of adsorbed solvent or the trapped water from the adsorbent. The second weight loss (250–430 °C) can be attributed to the decomposition of the main organic moiety loaded on the surface of Fe3O4@SiO2. Similar observations were reported on the Fe3O4 MNPs grafted poly(methyl methacrylate), which obtained 43.1% to 82.5% weight loss after the increasing of temperature from 250 to 420 °C.26 Based on the analysis of the weight loss, it can be concluded that the preparation of Fe3O4@SiO2/PEI is successful.
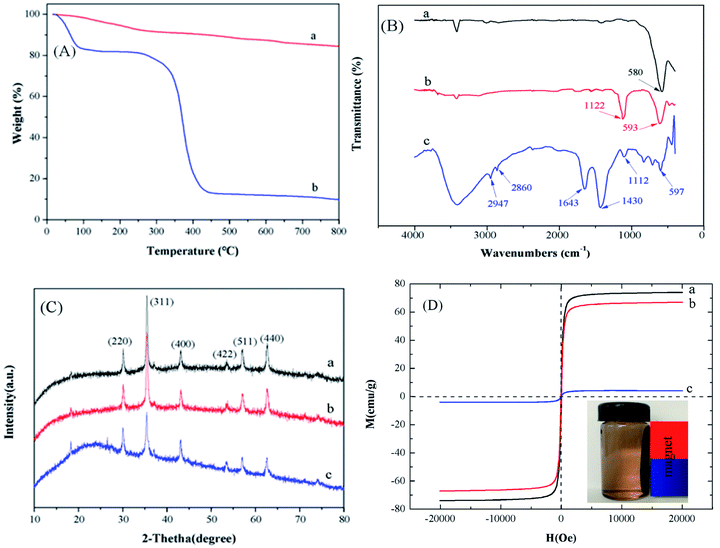 |
| | Fig. 2 (A) TGA analysis of (a) Fe3O4@SiO2 and (b) Fe3O4@SiO2/PEI. (B) FT-IR spectra of (a) Fe3O4, (b) Fe3O4@SiO2, (c) Fe3O4@SiO2/PEI. (C) XRD patterns of (a) Fe3O4, (b) Fe3O4@SiO2, (c) Fe3O4@SiO2/PEI. (D) Magnetization curve of (a) Fe3O4, (b) Fe3O4@SiO2, (c) Fe3O4@SiO2/PEI. | |
The FT-IR spectra analysis of Fe3O4, Fe3O4@SiO2 and Fe3O4@SiO2/PEI were shown in Fig. 2B. For Fe3O4, the strong characteristic peaks at 580 cm−1 was attributed to the absorption band of Fe–O bond vibration.27 Apart from the peak at 593 cm−1, the spectrum of Fe3O4@SiO2 appeared a strong band at 1122 cm−1 due to the Si–O stretching vibration,28 indicating the successful coating of silica on the magnetite surface. After the functionalization of PEI, a less intense Si–O band at 1112 cm−1 in Fe3O4@SiO2/PEI could be due to the loss of silanol groups upon functionalization. Moreover, absorption bands at 2947 and 2860 cm−1 were indicative of the symmetric and asymmetric stretching vibration of C–H bonds.29 One additional peak at 1643 cm−1 is associated to the symmetric N–H band from the PEI, which gives strong evidence of Fe3O4@SiO2/PEI.17
XRD pattern of Fe3O4, Fe3O4@SiO2 and Fe3O4@SiO2/PEI were illustrated in Fig. 2C. The strong diffraction peaks indexed to (220), (311), (400), (422), (511) and (440) show the characteristics of Fe3O4 with a cubic inverse spinel structure. These characteristic peaks of Fe3O4 were also appeared in the Fe3O4@SiO2 and Fe3O4@SiO2/PEI. In addition, the results have showed that the coating with SiO2 and PEI process did not cause the crystalline state change of Fe3O4. So, we can summarized from XRD that Fe3O4 nanoparticles in the systems are also of the spinel type structure.
The magnetic properties of Fe3O4, Fe3O4@SiO2 and Fe3O4@SiO2/PEI were determined by VSM (Fig. 2D). The saturation magnetization is 74.0 emu g−1 for Fe3O4, after coating of silica, introduction of amount of PEI, it is reasonable that the saturation magnetization of Fe3O4@SiO2 and Fe3O4@SiO2/PEI were decreased to 67.0 and 4.20, respectively. It should be noticed that near-zero remanence and coercivity were existed, indicating the superparamagnetic feature of the samples at room temperature.30 After the adsorption process is completed, the Fe3O4@SiO2/PEI can be collected from a mixture solution after dye adsorption by a permanent magnet, which is very important for the convenient recycling.31
Effect of pH
As shown in Fig. 3, the pHPZC of Fe3O4@SiO2/PEI estimated by the zeta potential was positive at pH 3.0–10.0, and the value was gradually decreased as the pH increased. It is believed that PEI is modeled at three protonation levels with three types of amino groups: at the high pH (>10), PEI is fully deprotonated; at neutral pH (∼7), all the primary amines are protonated; at low pH (<4), most of the amines are protonated.32 MO (pKa = 3.4) is an anionic dye with negatively charged when pH > 3.4. As can be seen from Fig. 3, the maximum adsorption of MO on the Fe3O4@SiO2/PEI surface was 231.0 mg g−1 at pH 4, and the adsorption ability was gradually decreased as the pH increased, this might due to the electrostatic attractions between the positively charged groups of PEI and the negatively charged groups of MO. It can be interpreted as follows (Scheme 1). When the solution pH is below the pKa value of MO, the surface of Fe3O4@SiO2/PEI is positively charged, while the MO was positively charged or neutral, indicating that there is no electrostatic attraction between Fe3O4@SiO2/PEI and MO. When the solution pH increases from 3.4, the anionic property of MO increase (formation of SO3− groups), there is electrostatic attractions between the positively charged groups of PEI and the negatively charged groups of MO. In particular, because the pHPZC of Fe3O4@SiO2/PEI is higher at pH 4. This makes MO easier to combine with the composite. While the adsorption capacity was gradually decreased as the pH increased. However, when pH > 7, the OH− increase gradually and compete with anionic MO for the positive charge site of Fe3O4@SiO2/PEI surface, which made the qe of MO decrease rapidly.
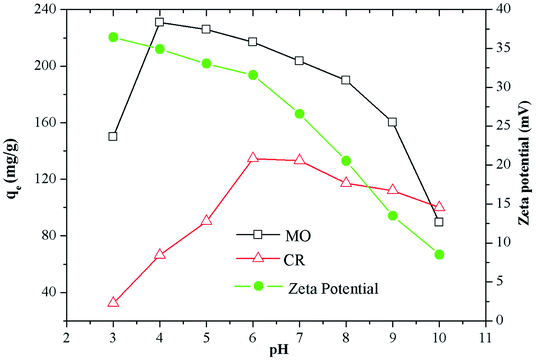 |
| | Fig. 3 Zeta potentials of Fe3O4@SiO2/PEI at different pH and effect of pH on adsorption of MO and CR by Fe3O4@SiO2/PEI. | |
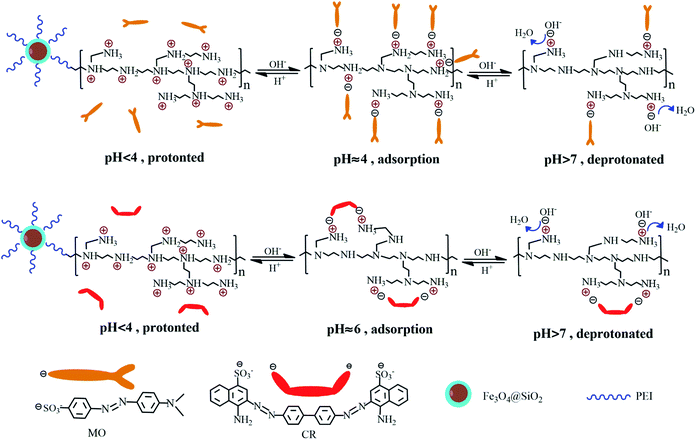 |
| | Scheme 1 Schematic adsorption mechanism for the removal of MO and CR. | |
CR is a typical dipole molecule (pKa = 5.5) with negatively charged when pH > 5.5. Because of the dissociation of SO3− groups is suppressed when pH < 5.5, the maximum adsorption capacity of CR adsorbed on the Fe3O4@SiO2/PEI surface was 134.6 mg g−1 at pH 6 (Fig. 3). The interaction between Fe3O4@SiO2/PEI and CR is the electrostatic attraction, and the change of qe is similar to that of MO. The electrostatic attraction between CR and Fe3O4@SiO2/PEI is weaker than that between MO and Fe3O4@SiO2/PEI, this could be attributed to two reasons. Firstly, CR dye molecule with two SO3− groups was capable of occupying more than one active site. Secondly, there are stronger electrostatic attraction due to the large amount of protonated amine group on the surface of the adsorbent at pH 4 than 6.
Adsorption kinetics
The effect of contact time on the adsorption of MO and CR by Fe3O4@SiO2/PEI is shown in Fig. 4. The adsorption kinetics processes of MO and CR were similar. It is obvious that the adsorption capacities of Fe3O4@SiO2/PEI for MO and CR increased rapidly in the initial 40 min, subsequently the adsorption rate declined, and reached equilibrium in approximately 180 min. In addition, the adsorption of MO is found to be much higher than that of CR. The equilibrium adsorption capacities for MO and CR obtained after 180 min adsorption were 238 mg g−1 and 88 mg g−1, respectively. Nevertheless, the adsorption capacity for MB was basically constant, which is relative low even negligible. To further investigate the adsorption process of MO and CR by Fe3O4@SiO2/PEI, the pseudo-first-order model (eqn (3)) and pseudo-second-order model (eqn (4)) were used to fit the experimental data:| | ln(qe − qt) = ln![[thin space (1/6-em)]](https://www.rsc.org/images/entities/char_2009.gif) qe − k1t qe − k1t | (3) |
| |  | (4) |
where qe and qt (mg g−1) is the amount of dye adsorbed at equilibrium time and at time t, and k1 (min−1) is the rate constant of pseudo-first-order model, while k2 (g mg−1 min−1) is the rate constant of pseudo-second-order model.
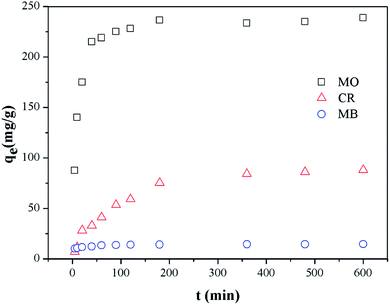 |
| | Fig. 4 Effect of contact time on adsorption of MO and CR by Fe3O4@SiO2/PEI (m/V = 0.4 g L−1, C0 = 100 mg L−1, T = 298 K, t = 10 h). | |
The values of k1, k2, and qe can be calculated from eqn (3) and (4), and the kinetic parameters obtained are presented with the linear regression values in Table 2. As shown in Table 2, the adsorption of MO and CR on Fe3O4@SiO2/PEI was described well with the pseudo-second-order kinetics model due to the greater value of determination coefficient R2, suggesting that the diffusion is the rate determining step mechanism, and the overall rate of this adsorption process might be due to chemisorption process. The explanation is verified in the further sections.
Table 2 Parameters for different adsorption kinetics models
| Dye |
q
exp (mg g−1) |
Pseudo-first-order kinetic |
Pseudo-second-order kinetic |
|
q
cal (mg g−1) |
k
1 (min−1) |
R
2
|
q
cal (mg g−1) |
k
2 (g mg−1 min−1) |
R
2
|
| MO |
238.8 |
47.25 |
7.07 × 10⁻³ |
0.725 |
239.8 |
6.41 × 10⁻⁴ |
0.999 |
| CR |
88.01 |
71.20 |
3.65 × 10⁻³ |
0.903 |
98.91 |
1.43 × 10⁻⁴ |
0.997 |
Adsorption isotherms
The equilibrium relationships between anionic dyes and Fe3O4@SiO2/PEI were described by adsorption isotherm in Fig. 5, and the well-known Langmuir (eqn (5)) and Freundlich (eqn (6)) isotherm models were used to fit the equilibrium adsorption data in order to determine the best-fit model.| |  | (5) |
where qe (mg g−1) is the dye adsorption quantity at equilibrium, qmax (mg g−1) is the dye adsorption capacity representing a full maximum monolayer coverage of the adsorbent surface, Ce (mg L−1) is the concentration of dye at equilibrium, KL (L mg−1) represents the Langmuir constant related to the energy of adsorption, KF is the Freundlich constant and is related to the adsorption capacity; 1/n is the factor related to the adsorption intensity.
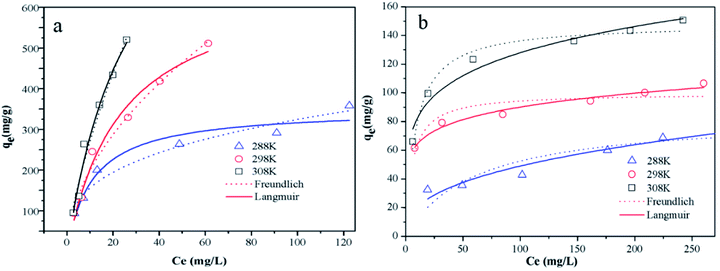 |
| | Fig. 5 The adsorption isotherms of (a) MO and (b) CR onto Fe3O4@SiO2/PEI at different temperatures (m/V = 0.4 g L−1, t = 10 h). | |
The adsorption isotherms for MO and CR obtained at 288, 298, and 308 K were shown in Fig. 5a and b, and the isotherms parameters of Langmuir and Freundlich for MO and CR adsorption on the Fe3O4@SiO2/PEI were shown in Table 3. Compared with the Langmuir isotherm model, the Freundlich isotherm model shows a better fit with the adsorption isotherms and the higher correlation coefficients were observed for the Freundlich isotherm model than that of the Langmuir isotherm model, indicating that both of the uptake of MO and CR on the sorbent are preferably followed the multilayer adsorption process. The 1/n value of the Freundlich isotherm model was less than 1, indicating that MO and CR adsorption on Fe3O4@SiO2/PEI was a favourable adsorption process from aqueous solution.
Table 3 Adsorption isotherm parameters for the adsorption of MO and CR on the Fe3O4@SiO2/PEI
| Dye |
T (K) |
Langmuir model |
Freundlich model |
|
q
max (mg g−1) |
K
L (L mg−1) |
R
2
|
K
F [(mg g−1)/(mg L−1)1/n] |
1/n |
R
2
|
| MO |
288 |
351.1 |
0.091 |
0.936 |
75.3 |
0.317 |
0.951 |
| 298 |
681.2 |
0.042 |
0.974 |
59.7 |
0.525 |
0.981 |
| 308 |
1058.4 |
0.036 |
0.968 |
54.4 |
0.697 |
0.977 |
| CR |
288 |
84.39 |
0.017 |
0.766 |
8.42 |
0.383 |
0.924 |
| 298 |
99.75 |
0.173 |
0.802 |
45.8 |
0.147 |
0.969 |
| 308 |
148.2 |
0.114 |
0.956 |
52.74 |
0.193 |
0.965 |
Adsorption thermodynamics
The van't Hoff equation was used to evaluate the thermodynamic characteristics of the dye adsorption process on the Fe3O4@SiO2/PEI adsorbent surface and the data were analyzed by the eqn (7) and (9) to get the thermodynamic parameters of ΔG°, ΔH° and ΔS°| | ΔG° = −RT![[thin space (1/6-em)]](https://www.rsc.org/images/entities/char_2009.gif) ln(Kd) ln(Kd) | (7) |
| |  | (8) |
| |  | (9) |
where the ΔG° is the change of Gibbs free energy (J mol−1), the ΔH° is the change of enthalpy (J mol−1), and the ΔS° is the change of entropy (J mol−1 K−1), R (8.314 J K−1 mol−1) and Kd are the universal gas constant and the equilibrium constant, respectively. The value of Kd at different temperatures was calculated according to eqn (8). The values of ΔS° and ΔH° were calculated from the intercept and slope of the plot of ln![[thin space (1/6-em)]](https://www.rsc.org/images/entities/char_2009.gif) Kdversus 1/T. All of the thermodynamic parameters were given in Table 4.33 The negative values of ΔG° confirm the spontaneity of the adsorption process reaction, and the decrease of the ΔG° values with the temperature increased from 288 to 308 K, indicating that the adsorption process was more beneficial at higher temperatures, and it can be seen clearly from Fig. 5. In addition, positive value of ΔH° reveals the endothermic nature of the adsorption reaction, and the positive value of ΔS° indicates that during the adsorption of MO and CR dye on the surface of the adsorbent, there is an increase in randomness at the solid/solution interface.34
Kdversus 1/T. All of the thermodynamic parameters were given in Table 4.33 The negative values of ΔG° confirm the spontaneity of the adsorption process reaction, and the decrease of the ΔG° values with the temperature increased from 288 to 308 K, indicating that the adsorption process was more beneficial at higher temperatures, and it can be seen clearly from Fig. 5. In addition, positive value of ΔH° reveals the endothermic nature of the adsorption reaction, and the positive value of ΔS° indicates that during the adsorption of MO and CR dye on the surface of the adsorbent, there is an increase in randomness at the solid/solution interface.34
Table 4 Thermodynamic parameters for the adsorption of MO and CR on the Fe3O4@SiO2/PEI
| Dye |
T (K) |
ΔG° (kJ mol−1) |
ΔS° (J K−1 mol−1) |
ΔH° (kJ mol−1) |
| MO |
288 |
−21.69 |
223.18 |
42.59 |
| 298 |
−23.96 |
| 308 |
−26.08 |
| CR |
288 |
−14.92 |
229.71 |
51.24 |
| 298 |
−17.45 |
| 308 |
−19.34 |
Removal mechanism
Although the CR and MO are anionic dye, actually, the as-synthesized samples display better adsorption capacity for MO than CR. In order to better investigate the adsorption mechanism of MO and CR on Fe3O4@SiO2/PEI, XPS analysis of Fe3O4@SiO2/PEI before and after the adsorption of MO and CR have been carried out. The adsorption process was usually determined by the functional groups on the surface of adsorbent. The high-resolution N 1s XPS spectra of the Fe3O4@SiO2/PEI before and after adsorption of MO and CR are shown in Fig. 6. For Fe3O4@SiO2/PEI, N 1s peak was deconvoluted into two peaks, 44.3% of –N![[double bond, length as m-dash]](https://www.rsc.org/images/entities/char_e001.gif) at 398.0 eV and 55.7% of –NH2 at 398.7 eV, after MO adsorption, the new peak appeared at 400.9 eV corresponds to the protonated amine group (NH3+), and the molar ratio of NH3+ is 12.3%, while the –NH2 decreased from 55.7% to 44.3% and the –N
at 398.0 eV and 55.7% of –NH2 at 398.7 eV, after MO adsorption, the new peak appeared at 400.9 eV corresponds to the protonated amine group (NH3+), and the molar ratio of NH3+ is 12.3%, while the –NH2 decreased from 55.7% to 44.3% and the –N![[double bond, length as m-dash]](https://www.rsc.org/images/entities/char_e001.gif) decreased from 44.3% to 43.4%. As for the adsorption of CR, the new peak appeared at 400.7 eV corresponds to the NH3+, and the molar ratio of NH3+ is 6.1%, while the –NH2 decreased from 55.7% to 47.0% and the –N
decreased from 44.3% to 43.4%. As for the adsorption of CR, the new peak appeared at 400.7 eV corresponds to the NH3+, and the molar ratio of NH3+ is 6.1%, while the –NH2 decreased from 55.7% to 47.0% and the –N![[double bond, length as m-dash]](https://www.rsc.org/images/entities/char_e001.gif) increased from 44.3% to 46.9%.
increased from 44.3% to 46.9%.
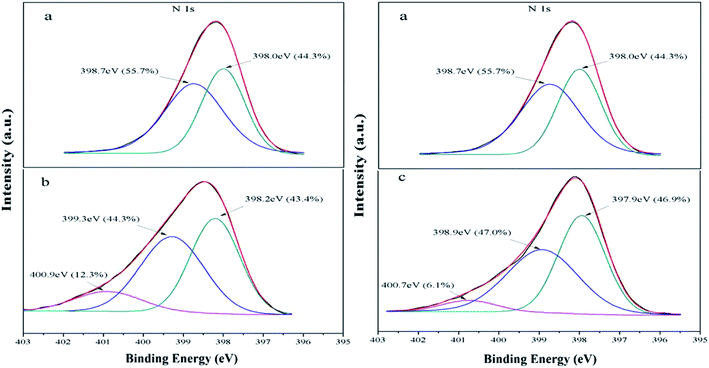 |
| | Fig. 6 The XPS spectra of N 1s (a) Fe3O4@SiO2/PEI, (b) after adsorption of MO, (c) after adsorption of CR. | |
As we all known that with three types of amino groups, the PEI is modeled at three protonation levels: at the high pH (>10), PEI is fully deprotonated; at neutral pH (∼7), all the primary amines are protonated; at low pH (<4), most of the amines are protonated. Meanwhile, when pH < pKa, the dissociation of SO3− groups is suppressed, the MO and CR were positively charged or neutral. When pH > pKa, the presence of NH3+ could absorb negatively charged SO3− groups in anionic dye through electrostatic attraction at pH 4–7. As we can seen from Fig. 6, the molar ratio of NH3+ is greater in MO than in CR, this is because of the large amount of protonated amine groups on the surface of the adsorbent at pH 4 than 6. It is also explained why the adsorption efficiency of MO is better than CR in the study of pH. Another important factor that affects the difference in adsorption between MO and CR is that CR dye molecule with two SO3− groups was capable of occupying more than one active site (Scheme 1). With the increase of pH, the extent of protonation of PEI decreased, along with the decrease in the adsorption ability of Fe3O4@SiO2/PEI. When pH > 7, the OH− increase gradually and compete with anionic MO for the NH3+ of Fe3O4@SiO2/PEI surface, leading to a faster decrease in the adsorption ability of Fe3O4@SiO2/PEI. Based on the above analysis, the conceivable mechanism of anionic dye adsorption is the presence of electrostatic interaction between anionic dyes and the positively charged nitrogens on the surface of the Fe3O4@SiO2@PEI, and it's consistent with the pH study.
Reusability
From the viewpoint of the potential practical application, reusability test is one of the most important factors to be considered for a given adsorbent by the adsorption–desorption experiments. It was repeated four times through batch experiments, and the results are shown in Fig. 7. Compared to the virgin composite Fe3O4@SiO2/PEI, the regenerated Fe3O4@SiO2/PEI exhibited an excellent regeneration for the adsorption of MO and CR, and the removal efficiency of Fe3O4@SiO2/PEI adsorbent decreased to approximately 75.4% and 74.5% even after the fourth reusability cycle, indicating that the Fe3O4@SiO2/PEI could be a potential and efficient adsorbent for the MO and CR removal due to the excellent multiple reusability performance.
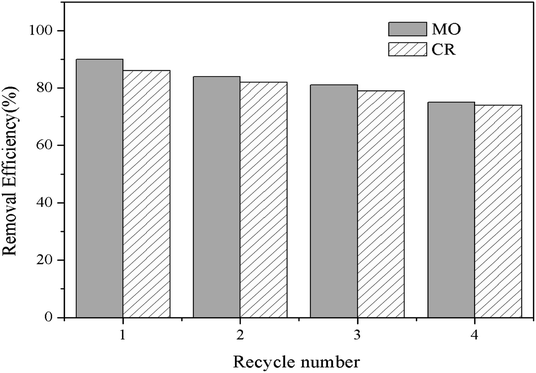 |
| | Fig. 7 Reusability of the Fe3O4@SiO2/PEI for MO and CR removal. | |
Conclusions
A eco-friendly and low-cost nitrogen-rich magnetic adsorbent (Fe3O4@SiO2/PEI) was successfully synthesized by a crosslinking reaction. The results indicated that the equilibrium adsorption capacities for MO and CR obtained after 180 min adsorption were 238 mg g−1 and 88 mg g−1, respectively, which was forceful and fast, while the adsorption capacity for MB was relative low even negligible, demonstrating the strong adsorptive affinity of Fe3O4@SiO2/PEI toward anionic compounds. The adsorption reaction was a spontaneous and endothermic process. Notably, the excellent adsorption characteristics for anionic dyes of the as-synthesized Fe3O4@SiO2/PEI mainly attribute to the electrostatic attraction between the negatively charged groups (SO3− groups) in anionic dyes and NH3+ of adsorbent surface. Furthermore, the mechanism of the adsorption process towards MO and CR share both commons and differences because CR with two SO3− groups was capable of occupying more than one active site. After the fourth adsorption–desorption cycle, the adsorbent still showed a high adsorption capacities for MO and CR in aqueous solution, indicating the potential of the Fe3O4@SiO2/PEI as a practical adsorbent for anionic dyes removal.
Conflicts of interest
There are no conflicts to declare.
Acknowledgements
This research was financially supported by the Natural Science Foundation of Hunan Province, China (Grant No. 2019JJ50015), the Project of Science Foundation of Hengyang Normal University, China (Grant No. 18D18) and the Aid Program of Research Center for Environment Education of Hunan Province, China (Grant No. HJ18K04).
References
- A. Mirzaei, Z. Chen, F. Haghighat and L. Yerushalmi, Chem. Eng. J., 2017, 330, 407–418 CrossRef CAS.
- M. Falah, K. J. D. MacKenzie, R. Knibbe, S. J. Page and J. V. Hanna, J. Hazard. Mater., 2016, 318, 772–782 CrossRef CAS PubMed.
- X. Liu, W. Gong, J. Luo, C. Zou, Y. Yang and S. Yang, Appl. Surf. Sci., 2016, 362, 517–524 CrossRef CAS.
- L. Wang, C. Mao, N. Sui, M. Liu and W. W. Yu, Environ. Technol., 2017, 38, 996–1004 CrossRef CAS.
- R. M. M. Santos, J. Tronto, V. Briois and C. V. Santilli, J. Mater. Chem. A, 2017, 5, 9998–10009 RSC.
- U. Habiba, T. A. Siddique, T. C. Joo, A. Salleh, B. C. Ang and A. M. Afifi, Carbohydr. Polym., 2017, 157, 1568–1576 CrossRef CAS.
- Y. Jiang, B. Liu, J. Xu, K. Pan, H. Hou, J. Hu and J. Yang, Carbohydr. Polym., 2018, 182, 106–114 CrossRef CAS.
- C. Lei, M. Pi, C. Jiang, B. Cheng and J. Yu, J. Colloid Interface Sci., 2017, 490, 242–251 CrossRef CAS.
- S. Dawood and T. K. Sen, Water Res., 2012, 46, 1933–1946 CrossRef CAS.
- N. Nasuha, B. H. Hameed and A. T. Din, J. Hazard. Mater., 2010, 175, 126–132 CrossRef CAS PubMed.
- A. S. Patra, S. Ghorai, S. Ghosh, B. Mandal and S. Pal, J. Hazard. Mater., 2016, 301, 127–136 CrossRef CAS.
- A. K. Abay, D. H. Kuo, X. Chen and A. D. Saragih, Chemosphere, 2017, 189, 21–31 CrossRef CAS.
- Z. Zhu, P. Wu, G. Liu, X. He, B. Qi, G. Zeng, W. Wang, Y. Sun and F. Cui, Chem. Eng. J., 2017, 313, 957–966 CrossRef CAS.
- K. Bello, B. K. Sarojini, B. Narayana, A. Rao and K. Byrappa, Carbohydr. Polym., 2018, 181, 605–615 CrossRef CAS.
- G. Bayramoglu and M. Yakuparica, Chem. Eng. J., 2008, 139, 20–28 CrossRef CAS.
- N. Sui, L. Wang, X. Wu, X. Li, J. Sui, H. Xiao, M. Liu, J. Wan and W. W. Yu, RSC Adv., 2015, 5, 746–752 RSC.
- Y. Z. Zhang, J. Li, J. Zhao, W. Bian, Y. Li and X. J. Wang, Bioresour. Technol., 2016, 222, 285–293 CrossRef CAS.
- B. Huang, Y. Liu, B. Li, G. Zeng, X. Hu, B. Zheng, T. Li, L. Jiang, X. Tan and L. Zhou, RSC Adv., 2015, 5, 106339–106349 RSC.
- R.-r. Shan, L.-g. Yan, K. Yang, Y.-f. Hao and B. Du, J. Hazard. Mater., 2015, 299, 42–49 CrossRef CAS.
- J. Ma, Y. Wu, Y. Zeng, Y. Li and D. Wu, J. Mater. Chem. A, 2015, 3, 16762–16773 RSC.
- C. Shuai, Y. Yaxian, Y. Jianlin, H. Sanyang and G. Renao, Chem. Commun., 2011, 47, 4225–4227 RSC.
- R. Fan, H. Min, X. Hong, Q. Yi, W. Liu, Q. Zhang and Z. Luo, J. Hazard. Mater., 2019, 364, 780–790 CrossRef CAS.
- B. Huang, Y. Liu, B. Li, S. Liu, G. Zeng, Z. Zeng, X. Wang, Q. Ning, B. Zheng and C. Yang, Carbohydr. Polym., 2017, 157, 576–585 CrossRef CAS.
- B. Chen, X. Zhao, Y. Liu, B. Xu and X. Pan, RSC Adv., 2015, 5, 1398–1405 RSC.
- X. J. Kong, C. Zheng, Y. H. Lan, S. S. Chi, Q. Dong, H. L. Liu, C. Peng, L. Y. Dong, L. Xu and X. H. Wang, Anal. Bioanal. Chem., 2018, 410, 247–257 CrossRef CAS.
- L. G. Bach, M. R. Islam, J. T. Kim, S. Seo and K. T. Lim, Appl. Surf. Sci., 2012, 258, 2959–2966 CrossRef CAS.
- S. Singh, K. C. Barick and D. Bahadur, J. Hazard. Mater., 2011, 192, 1539–1547 CrossRef CAS.
- S. Zhang, Y. Zhang, J. Liu, Q. Xu, H. Xiao, X. Wang, H. Xu and J. Zhou, Chem. Eng. J., 2013, 226, 30–38 CrossRef CAS.
- S. Dash, H. Chaudhuri, G. Udayabhanu and A. Sarkar, Energy Fuels, 2016, 30, 6646–6653 CrossRef.
- C. Jin, J. Han, F. Chu, X. Wang and R. Guo, Langmuir, 2017, 33, 4520–4527 CrossRef CAS PubMed.
- Y. Zhou, T. Ping, I. Maitlo, B. Wang, M. Y. Akram, J. Nie and X. Zhu, Nanotechnology, 2016, 27, 215301 CrossRef.
- F. Qu, N. B. Li and H. Q. Luo, Langmuir, 2013, 29, 1199–1205 CrossRef CAS.
- L. Sharma and R. Kakkar, ACS Appl. Mater. Interfaces, 2017, 9, 38629–38642 CrossRef CAS PubMed.
- S. Ghorai, A. K. Sarkar, A. B. Panda and S. Pal, Bioresour. Technol., 2013, 144, 485–491 CrossRef CAS.
|
| This journal is © The Royal Society of Chemistry 2019 |
Click here to see how this site uses Cookies. View our privacy policy here.  Open Access Article
 *cd,
Bin
Li
e,
Hui
Wang
f and
Guangming
Zeng
cd
![[thin space (1/6-em)]](https://www.rsc.org/images/entities/char_2009.gif) 000 was obtained from Sigma-Aldrich as a commercial sample in the form of 99 wt% aqueous solution. The anionic dyes MO and CR were obtained from Tianjin Fuchen Co., Ltd., China. The parameters of the anionic dyes are shown in Table 1. FeCl3·6H2O, ethylsilicate (TEOS), anhydrous sodium acetate (CH3COONa), glutaraldehyde solution (50 wt%) and all other chemicals used in this study were purchased from Sinopharm Chemical Reagent Co., Ltd. (Shanghai, China). All the reagents used in the experiments were of analytic quality.
000 was obtained from Sigma-Aldrich as a commercial sample in the form of 99 wt% aqueous solution. The anionic dyes MO and CR were obtained from Tianjin Fuchen Co., Ltd., China. The parameters of the anionic dyes are shown in Table 1. FeCl3·6H2O, ethylsilicate (TEOS), anhydrous sodium acetate (CH3COONa), glutaraldehyde solution (50 wt%) and all other chemicals used in this study were purchased from Sinopharm Chemical Reagent Co., Ltd. (Shanghai, China). All the reagents used in the experiments were of analytic quality.


![[thin space (1/6-em)]](https://www.rsc.org/images/entities/char_2009.gif) qe − k1t
qe − k1t


![[thin space (1/6-em)]](https://www.rsc.org/images/entities/char_2009.gif) ln(Kd)
ln(Kd)

![[thin space (1/6-em)]](https://www.rsc.org/images/entities/char_2009.gif) Kdversus 1/T. All of the thermodynamic parameters were given in Table 4.33 The negative values of ΔG° confirm the spontaneity of the adsorption process reaction, and the decrease of the ΔG° values with the temperature increased from 288 to 308 K, indicating that the adsorption process was more beneficial at higher temperatures, and it can be seen clearly from Fig. 5. In addition, positive value of ΔH° reveals the endothermic nature of the adsorption reaction, and the positive value of ΔS° indicates that during the adsorption of MO and CR dye on the surface of the adsorbent, there is an increase in randomness at the solid/solution interface.34
Kdversus 1/T. All of the thermodynamic parameters were given in Table 4.33 The negative values of ΔG° confirm the spontaneity of the adsorption process reaction, and the decrease of the ΔG° values with the temperature increased from 288 to 308 K, indicating that the adsorption process was more beneficial at higher temperatures, and it can be seen clearly from Fig. 5. In addition, positive value of ΔH° reveals the endothermic nature of the adsorption reaction, and the positive value of ΔS° indicates that during the adsorption of MO and CR dye on the surface of the adsorbent, there is an increase in randomness at the solid/solution interface.34
![[double bond, length as m-dash]](https://www.rsc.org/images/entities/char_e001.gif) at 398.0 eV and 55.7% of –NH2 at 398.7 eV, after MO adsorption, the new peak appeared at 400.9 eV corresponds to the protonated amine group (NH3+), and the molar ratio of NH3+ is 12.3%, while the –NH2 decreased from 55.7% to 44.3% and the –N
at 398.0 eV and 55.7% of –NH2 at 398.7 eV, after MO adsorption, the new peak appeared at 400.9 eV corresponds to the protonated amine group (NH3+), and the molar ratio of NH3+ is 12.3%, while the –NH2 decreased from 55.7% to 44.3% and the –N![[double bond, length as m-dash]](https://www.rsc.org/images/entities/char_e001.gif) decreased from 44.3% to 43.4%. As for the adsorption of CR, the new peak appeared at 400.7 eV corresponds to the NH3+, and the molar ratio of NH3+ is 6.1%, while the –NH2 decreased from 55.7% to 47.0% and the –N
decreased from 44.3% to 43.4%. As for the adsorption of CR, the new peak appeared at 400.7 eV corresponds to the NH3+, and the molar ratio of NH3+ is 6.1%, while the –NH2 decreased from 55.7% to 47.0% and the –N![[double bond, length as m-dash]](https://www.rsc.org/images/entities/char_e001.gif) increased from 44.3% to 46.9%.
increased from 44.3% to 46.9%.


