 Open Access Article
Asymmetric supercapacitors with excellent rate performance by integrating Co(OH)F nanorods and layered Ti3C2Tx paper†
Si
Chen
a,
Xuejiao
Zhou
a,
Xinzhi
Ma
a,
Lu
Li
a,
Panpan
Sun
b and
Mingyi
Zhang
 *a
*a
aKey Laboratory for Photonic and Electronic Bandgap Materials, Ministry of Education, School of Physics and Electronic Engineering, Harbin Normal University, Harbin 150025, PR China. E-mail: zhangmingyi@hrbnu.edu.cn; mysci@foxmail.com
bCollege of Materials and Chemical Engineering, Hubei Provincial Collaborative Innovation Center for New Energy Microgrid, Collaborative Innovation Center for Energy Equipment of Three Gorges Region, China Three Gorges University, Yichang 443002, China
First published on 30th September 2019
Abstract
Here we describe an aqueous asymmetric supercapacitor assembled using Co(OH)F nanorods on Ni foam (Co(OH)F@NF) as the positive electrode and layered Ti3C2Tx paper on Ni foam (Ti3C2Tx@NF) as the negative electrode. The Co(OH)F@NF was fabricated by a facile hydrothermal process. The nanorods were constructed as three-dimensional networks with stable structures and good durability in electrochemical reactions. As expected, the Co(OH)F@NF exhibited excellent capacitance (1265 mF cm−2 at 1 mA cm−2) and wonderful rate performance (90% from 1 to 10 mA cm−2). The Co(OH)F@NF//Ti3C2Tx@NF asymmetric supercapacitor devices showed high capacitance of 376 mF cm−2 and excellent rate capacity of 91% retention. When the two Co(OH)F@NF//Ti3C2Tx@NF devices were combined in series, a red led bulb could be lit for 12 minutes, further corroborating the possibility of the devices being used for practical applications.
1 Introduction
Recently, miniature and high-efficiency energy storage devices, e.g., supercapacitors, have aroused wide concern as feasible power sources for communication equipment, distributed sensors, medical devices and other portable electronics.1–3 But, their poor mechanical stability and low energy density still can't exceed or even meet requirements for practical use. Thus, several efforts have been made to improve either the operating voltage (V) or the specific capacitance (C) of supercapacitors based on the equation E = 1/2 CV2. One effective approach that worked was to develop asymmetric supercapacitors. Asymmetric supercapacitors are identified as devices in which one electrode stores charge based on a battery-type faradaic process and the other electrode stores charge by a capacitive mechanism. During the charge–discharge performance, asymmetric supercapacitors can take full advantage of the two potential windows of the different electrodes to enlarge the operating voltage and further increase the specific capacitance of the full device. In order to assemble miniature and high-efficiency asymmetric supercapacitors, the key is to synthesize electrodes with good electrochemical performance. Most asymmetric supercapacitors use transition metal oxide/hydroxide materials as a positive electrode and carbon-based materials as a negative electrode.4–8Transition metal oxide/hydroxide materials have pseudocapacitor features and store electrical energy faradaically by electron charge transfers between the electrode and electrolyte interface.9–13 Compared with previously reported transition metal oxide/hydroxide electrodes and cobalt compounds, pseudocapacitor feature electrode materials are more appealing to a large number of researchers due to their good electrochemical activity, low cost, high-performance pseudocapacitance and environmental compatibility.14–16 In this work, interlaced nanorods Co(OH)F were synthesised on Ni foam (Co(OH)F@NF) via a one-step hydrothermal method as the positive material. The shrub-like nanorods interlace with each other to build a 3D network structure having good connections. And between the nanorod arrays, which contain a lot of space, better exposure of active sites and easier electrolyte access is allowed. At the same time, Ni foam as the substrate without any binder avoids electrical resistance and facilitates transport of electrons to the conductive substrates.
Most supercapacitors use conventional carbon-based materials as negative electrodes and this stems from their good electrical conductivity, large surface area and outstanding stability. But, the low capacitance of carbon materials seriously restrains their energy density. MXenes, very novel 2D materials, have a bright future with high capacitance values in the area of energy storage devices because of their tunable surface properties and special layer structure.17 MXenes, a large family, are synthesised with selective etching where the “A” element is etched from the MAX phases. The MAX phases are given a general formula that is Mn+1AXn (n = 1, 2, 3), in which “M” stands for an early transition metal (M = Ti, V, Nb, etc.), “A” stands for an A-group element (A = Al, Si, etc.), and “X” denotes C and/or N. In Mn+1XnTx, “T” stands for –O, –OH, and –F functional groups terminated on the surface, and “x” represents the number (0 < x < 2) of termination groups.18,19 One of the most characteristic MXenes researched includes Ti3C2Tx flakes that are synthesised with an etching process using a mixed liquid of HCl and LiF. A 2D Ti3C2Tx flakes electrode exhibited good capacitance (295.4 F cm−3 previously reported by our group),20 which was comparable to other carbon-based materials. In this paper, an aqueous asymmetric supercapacitor was assembled by using Co(OH)F nanorods on Ni foam (Co(OH)F@NF) as the positive electrode and layered Ti3C2Tx paper on Ni foam (Ti3C2Tx@NF) as the negative electrode with a high extended operating voltage. As expected, a miniature and high-efficiency hybrid supercapacitor was fabricated that exhibited a high capacitance value (376 mF cm−2) and a good rate capability (91% from 2 to 10 mA cm−2). These results benefit from great electrochemical performances of the two electrodes.
2 Experimental
2.1 Materials preparation
2.2 Characterizations and electrochemical measurements
The sample was characterized with X-ray diffraction (XRD, D/max 2600, Rigaku, Japan), X-ray photoelectron spectroscopy (XPS, Thermo Scientific Company), scanning electron microscopy (SEM, Hitachi SU 70), transmission electron microscopy (TEM, Tecnai F20) and electrochemical workstation (VMP3, France).The Co(OH)F@NF and Ti3C2Tx@NF were tested in a 3 M KOH and 0.5 M LiOH solution. The Hg/HgO electrode and Pt film were used as the reference electrode and the counter electrode, respectively.
The capacitance value was calculated using the following eqn (1) where I/s is current density, Δt is discharge time and ΔV is the voltage window in GCD curves.
 | (1) |
2.3 Preparation of the device
The positive electrode of Co(OH)F@NF, negative electrode of Ti3C2Tx@NF and a membrane were assembled in an aqueous device where 3 M KOH and 0.5 M LiOH were used as the electrolyte.The charge of two electrodes was balanced by eqn (2), where Q+ and Q− are the charge of the positive and negative electrode, respectively.
| Q+ = Q− | (2) |
The energy density and power density of the device were computed with eqn (2) and (4), where C is the areal capacitance of the device that was obtained using eqn (2), V is the voltage and Δt is the discharge time of the device.
 | (3) |
 | (4) |
3 Results and discussion
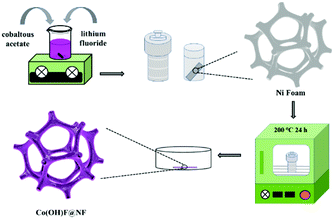
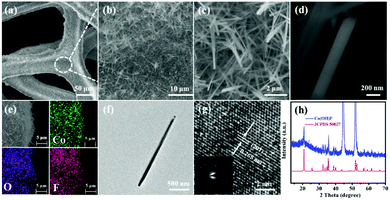
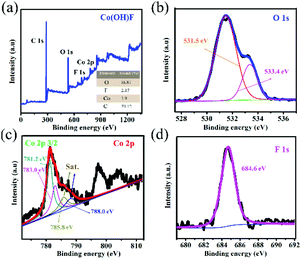
The fabrication step of Co(OH)F@NF is shown in Scheme 1. Co(OH)F nanorods were covered on a Ni foam by a simple hydrothermal method; specific information is given in the materials preparation part. Fig. 1a exhibits the field emission scanning electron microscope (FESEM) image. We can see that the as-synthesized Co(OH)F nanorods uniformly grew on the surface of the nickel foam. The magnified image is observed in Fig. 1b–d, where a shrub-like nanoarray covers the substrate and the nanorods interlace with each other to construct a three-dimensional (3D) network structure with excellent connections. Fig. 1d presents a smooth surfaced nanorod, which has a diameter of about 200 nm. The energy-dispersive X-ray spectroscopy (EDS) in Fig. 1e gives information about element composition, which demonstrates the existence of Co, O and F elements and uniform growth of Co(OH)F nanorods on the Ni foam. The nanorod structure is also elucidated in the TEM observation, which revealed the length of a nanorod at about 1.8 μm (Fig. 1f). The corresponding high-resolution TEM (HRTEM) pattern in Fig. 1g revealed a lattice fringe spacing of 0.265 nm, which is attributed to the d-spacing of (201) planes of Co(OH)F. The selected area electron diffraction (SAED) pattern of the sample (displayed in the inset) implied that the Co(OH)F nanorod is a polycrystalline structure. X-ray diffraction (XRD) analysis confirmed that the composition of this nanorod is Co(OH)F. In the XRD curve, besides the three strong diffraction peaks of Ni foam, all the other diffraction peaks were indexed to orthorhombic Co(OH)F (JCPDS 50-827), confirming the synthesis of Co(OH)F and consistent results with the HRTEM observation. Specifically, peaks at 20.80, 32.37, 33.64, 34.87, 35.74, 38.72, 40.12, 52.90 and 57.10° are indexed to the (100), (310), (201), (400), (111), (211), (410), (420) and (511) planes of Co(OH)F.The surface chemistry of Co(OH)F nanorods was also characterized by XPS. In the survey spectrum, as had been expected, the signals of Co, O and F elements were all found, which confirmed their existence in the product and in conformity to the EDS mapping. The inset in Fig. 2a represents atom percentages of the elements in the nanorods. And from calculations, the atomic ratios of O, F and Co are about 81/10/9. But the C element in the survey spectrum may come from adsorbed CO2 or/and the added reference carbon.21 The high-resolution spectrum of O 1s for the sample can be fitted nicely into peaks with specific locations at 531.5 eV and 533.4 eV which correspond to metal hydroxides and typical –OH bonds.22 In Fig. 2c the high-resolution XPS Co 2p3/2 spectrum was fitted with two intense main peaks at 781.2 and 783.0 eV from the core photoelectron line. Two satellite peaks, a broad one at 785.8 eV and a small one at 788.0 eV, also were observed. The positions of the two main peaks and the broad nature of the satellite peaks agree with Co 2p3/2 signals from the inorganic Co2+ species with unpaired 3d electrons as reported in the literature,23,24 and the ratios of atomic concentrations from XPS of the Co(OH)F nanorods also were given. The high-resolution F 1s spectra can also be well fitted into a peak at 684.6 eV attributed to the position of F− in metal hydroxy-fluoride.25
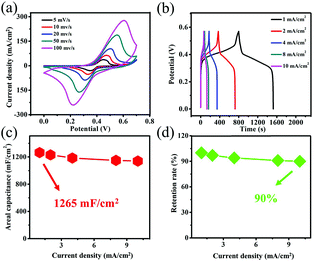
In order to estimate its electrochemical property, a test with a three-electrode configuration was carried out for the Co(OH)F@NF sample. The electrolyte was a 3 M KOH and 0.5 M LiOH solution. The CV profiles with a 0–0.7 V range and 5 to 100 mV s−1 scan rates are exhibits in Fig. 3a as well as different voltages in Fig. S1.† A set of obvious redox peaks were observed that implied the existence of faradaic redox reactions. Apparently, the peak's currents all increased with the sweep rate implying the charge transfer kinetics is the limiting step of the reaction.26 The redox reaction occurring at the Co(OH)F@NF electrode can be described as eqn (5) and (6).27,28
| Co2+ + 3OH− ↔ CoOOH + H2O + e− | (5) |
| CoOOH + OH− ↔ CoO2 + H2O + e− | (6) |
To understand the contribution of the substrate to the electrochemical properties, the CV curves of Ni foam at 100 mV s−1 were measured as shown in Fig. S2.† Clearly, the red curve almost has no CV curve area compared with black curve that reveals a low capacitance of substrate compared with Co(OH)F nanorods. The GCD curves of Co(OH)F@NF are given at various currents (from 1 to 10 mA cm−2) in the 0–0.57 V range in Fig. 3b. The features of these loops of almost same kind of discharge plateaus agree with their corresponding CVs and can be ascribed to the faradaic processes taking place in charge/discharge cycling. According to the GCD curves, areal capacitance and retention rates are calculated by eqn (1) as show in Fig. 3c and d. The Co(OH)F@NF displays a high areal capacitance of 1265 mF cm−2 at 1 mA cm−2. And when the current density is 1, 2, 4, 8 or 10 mA cm−2, the areal capacitance of the material is 1265, 1231, 1185, 1150, and 1140 mF cm−2, respectively. A capacitance retention rate of 90% suggests a great rate capability. An EIS measurement was further performed to investigate the electrochemical kinetics of Co(OH)F@NF (Fig. S3†). The results show absence of a semicircle in the high frequency area and an almost vertical line in the low frequency area which revealed a great ionic conductivity and smaller Warburg resistance.29 Such high areal capacitance resulted from the unique 3D net structure features of the Co(OH)F@NF nanostructure we present here: (i) good contact with each of the Co(OH)F nanorods can improve electron transport, which is illustrated by the EIS results; (ii) a multichannel structure between the nanorods allows better exposure of active sites and easier electrolyte access; (iii) Co(OH)F nanorods direct growth on Ni foam can avoid electrical resistance of the binder and facilitate the transport of electrons to the conductive substrate. All the above-mentioned discussion exhibits that the Co(OH)F@NF electrode has an ideal electrochemical performance. Due to its high capacitance and rate capability, the Co(OH)F@NF electrode is also fit for supercapacitors electrode applications, perhaps even at high current densities.
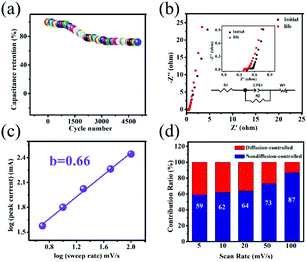
Cycling capability is an indispensable parameter to evaluate practical applications of the electrode materials. Fig. 4a represents the cycling capability of the Co(OH)F@NF electrode at 10 mA cm−2. As seen, the capacitance retention of the Co(OH)F@NF electrode is 72% after 5000 cycles. The corresponding equivalent circuit diagram is used to fit the EIS spectra in Fig. 4b. And the Co(OH)F@NF electrode has a very small charge-transfer resistance (Rct) of 0.127 Ω, intimating fast charge transfer and transport processes. The inset in Fig. 4b shows the magnified section of the EIS spectra of the Co(OH)F@NF electrode before and after 5000 cycles, from which we can see that the charge-transfer resistance was almost unchanged after 5000 cycles. Studying the reaction kinetics and charge storage mechanism in energy-storage materials is of great importance for further developing electrochemical performance for SCs. According to the Dunn method, we investigated the redox kinetics of the Co(OH)F@NF electrode. The CV data was analyzed at different scan rates using eqn (7),
| i = avb | (7) |
| i = k1v + k2v1/2 | (8) |
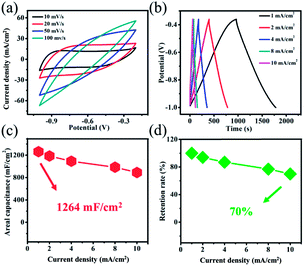
For purposes of examining electrochemical properties of the positive electrode materials, we synthesized the Ti3C2Tx@NF negative electrode and assembled asymmetric supercapacitors. The Ti3C2Tx@NF electrode was selected because of its tunable surface properties, good electrical conductivity and large surface area.30 The electrochemical behavior of the Ti3C2Tx@NF negative electrode was tested in 3 M KOH and 0.5 M LiOH solution. Fig. 5a displays the CV curves of Ti3C2Tx@NF electrode at different scan rates of 10, 20, 50 and 100 mV s−1 in a potential range of −1.0 to −0.2 V. The shapes of the CV curves are close to being rectangular which implied a capacitance behavior. In this case, nickel foam also contributes to the capacitance of Ti3C2Tx@NF electrode. At high scan rates, the CV curves present a distorted rectangular shape that can be due to a polarization phenomenon of the Ti3C2Tx@NF electrode (Fig. S4†). Additionally, the GCD curves were obtained at current densities from 1 to 10 mA cm−2 in a potential range of −1.00–0.36 V (Fig. 5b). Clearly, a linear symmetrical charge–discharge profile was observed with no noticeable voltage drop (IR drop), which also displayed a great capacitance behavior.31 The Ti3C2Tx@NF electrode exhibited high areal capacitance values, with 1264, 1187, 1093, 968 and 891 mF cm−2 at current densities of 1, 2, 4, 8 and 10 mA cm−2, respectively (Fig. 5c). It was found that 70% of the capacitance was maintained with a 10-fold increase in the current density, revealing a good performance of the Ti3C2Tx@NF structure (Fig. 5d).
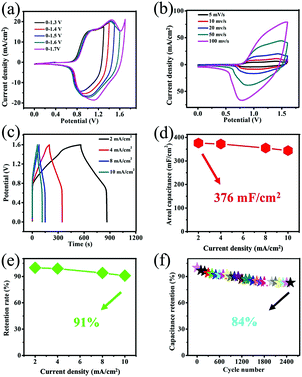
The asymmetric supercapacitor (ASC) was assembled using the Co(OH)F@NF electrode as the positive electrode and the Ti3C2Tx@NF as the negative electrode with a separator soaked in 3 M KOH and 0.5 M LiOH solution (Fig. 6). The charge balance between the positive and negative electrodes from eqn (2) produced an optimal electrochemical property. The mass ratio of the positive and negative electrode was 1/7. The optical photo of the as-assembled aqueous device is displayed in the right side position of Fig. 6. Two of the supercapacitor devices in series could light up a red light-emitting diode (LED) indicator that continued to shine for 12 minutes. To determine the optimal operating potential window, a set of CV profiles at 20 mV s−1 were initially executed at various potentials of 1.3, 1.4, 1.5 V, 1.6 V and 1.7 V. From Fig. 7a, the CV curves are not the similar ideal rectangular shape, which may imply a surface redox mechanism with the valence of the Co ion in the electrode material of the ASC. More than one pair of redox peaks and the nonrectangular shapes also implied that the device's capacitance characteristics are a combination of the double-layer capacitance process and the pseudocapacitive characteristic. When the voltage was higher than 1.6 V then it had a polarization phenomenon which may be due to water decomposition. Hence, the electrochemical measurements of ASC were performed in a voltage potential window of 0–1.6 V where the potential of 1.6 V was optimal. CV curves of the ASC at various scan rates of 5, 10, 20, 50 and 100 mV s−1 are given in Fig. 6b. From Fig. 7b, the shape was maintained without obvious distortion in the CV curves even when a large scan rate of 100 mV s−1 was performed, which demonstrated a great rate capability with the ACS. The measured GCD curves are exhibited in Fig. 7c. All the curves are quasi-symmetrical suggesting a great reversible redox process in the charging–discharging process. The areal capacitances of the device were also calculated and reached 376, 372, 355 and 344 mF cm−2 at the current densities from 2 to 10 mA cm−2 (plotted in Fig. 7d). The areal capacitance values of the Co(OH)F@NF//Ti3C2Tx@NF ASC device are higher than previously reported performance of ASC devices: MACC//Co(OH)2 (373.9 mF cm−2), CoMnLDH-SO4//porous carbon (308.48 mF cm−2), Ni–Co–N/GP//GOP (42.3 mF cm−2) and Ni11(HPO3)8(OH)6//AC (68.7 mF cm−2).32–35Fig. 4d shows that the ASC retained 91% from 2 to 10 mA cm−2 indicating a great rate capability, in accordance with the CV curves of different scan rates. A cycling test, an important parameter for electrochemical properties, was also measured to investigate the long-term charge–discharge cycle ability of the device. In Fig. 7f the cycling durability of Co(OH)F@NF//Ti3C2Tx@NF ASC at the current density of 10 mA cm−2 exhibits that the device retained 84% of its initial capacitance after 5000 cycles. Energy density and power density are also crucial parameters to describe the performance and predict the application of a supercapacitor. The energy density and power density of the Co(OH)F@NF//Ti3C2Tx@NF ASC devices were calculated by eqn (3) and (4), respectively. The Co(OH)F@NF//Ti3C2Tx@NF asymmetric supercapacitor showed energy densities of 0.134, 0.132, 0.126 and 0.122 mW h cm−2 and power densities of 1.59, 3.21, 6.48 and 8.01 mW cm−2 at 2, 4, 8 and 10 mA cm−2, respectively. The above good electrochemical performances of the device are due to the excellent pseudo-capacitance properties of Co(OH)F@NF as a positive electrode and the high EDLC response of Ti3C2Tx@NF as a negative electrode and indicate the potential of these materials for their practical use in real energy storage devices.
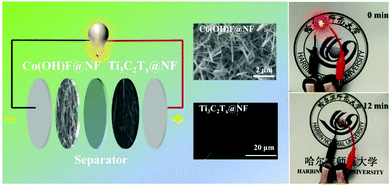 | ||
| Fig. 6 Scheme of Co(OH)F@NF//Ti3C2Tx@NF asymmetric supercapacitor and photographs of a LED powered by two coin cell asymmetric. | ||
4 Conclusions
In general, we have triumphantly designed and fabricated a Co(OH)F@NF electrode with 3D structures and improved electrochemical performance. Particularly, nanorods covered on the Ni foam were constructed in an interlaced 3D network structure that facilitated ion transport and improved contact with the electrolyte. The synthesized Co(OH)F@NF electrode showed an enhanced capacitance (1265 mA cm−2 at a current density of at 1 mF cm−2) and superior rate properties (90% rate retention from 1 to 10 mA cm−2). Furthermore, the assembled Co(OH)F@ NF//Ti3C2Tx@NF asymmetric supercapacitor device also exhibited a high areal capacitance with good rate performance (91% rate retention from 2 to 10 mA cm−2) as well as cycling properties (84% after 5000 cycles). Hence, we believe that this Co(OH)F material could be promising for use in the energy storage field.Conflicts of interest
There are no conflicts to declare.Acknowledgements
This work was supported by the National Natural Science Foundation of China (51872068), Heilongjiang Natural Science Foundation (E2018051).Notes and references
- J. Yan, Z.-J. Fan, W. Sun, G.-G. Ning, T. Wei, Q. Zhang, R.-F. Zhang, L.-J. Zhi and F. Wei, Adv. Funct. Mater., 2012, 22, 2632 CrossRef CAS.
- C. Chen, D. Yan, X. Luo, W.-J. Gao, G.-J. Huang, Z.-W. Han, Y. Zeng and Z.-H. Zhu, ACS Appl. Mater. Interfaces, 2018, 10, 4662 CrossRef CAS.
- F. Nti, D. A. Anang and J.-I. Han, J. Alloys Compd., 2018, 742, 342 CrossRef CAS.
- J. Balamurugan, G. Karthikeyan, T. D. Thanh, N. H. Kim and J. H. Lee, J. Power Sources, 2016, 308, 149 CrossRef CAS.
- B. Zhao, S.-Y. Huang, T. Wang, K. Zhang, M. F. Y. Matthew, J.-B. Xu, X.-Z. Fu, R. Sun and C.-P. Wong, J. Power Sources, 2015, 298, 83 CrossRef CAS.
- V. Senthilkumar, F. B. Kadumudi, N. T. Ho, J. W. Kim, S. Park, J. S. Bae, W. M. Choi, S. Cho and Y. S. Kim, J. Power Sources, 2016, 303, 363 CrossRef CAS.
- D. Komatsu, T. Tomai and I. Honma, J. Power Sources, 2015, 274, 412 CrossRef CAS.
- J. Wang, R. Ran, M. O. Tade, Z.-P. Shao, H. Cheng, Z.-G. Lu, J.-Q. Deng, C.-Y. Chung, K.-L. Zhang and Y.-Y. Li, Nano Res., 2010, 3, 895 CrossRef.
- E.-M. Jin, J. G. Lim and S. M. Jeong, J. Ind. Eng. Chem., 2017, 54, 421 CrossRef CAS.
- T. Brezesinski, J. Wang, R. Senter, K. Brezesinski, B. Dunn and S. H. Tolbert, ACS Nano, 2010, 4, 967 CrossRef CAS.
- Y.-Y. Li, H.-Y. Zhang and P.-K. Shen, Nano Energy, 2015, 13, 563 CrossRef CAS.
- M.-P. Li, M. F. El-Kady, J. Y. Hwang, M. D. Kowal, K. Marsh, H.-S. Wang, Z.-Z. Zhao and R. B. Kaner, Nano Res., 2018, 11, 2836 CrossRef CAS.
- L.-F. Shen, X.-G. Zhang, E. Uchaker, C.-Z. Yuan and G.-Z. Cao, Adv. Energy Mater., 2012, 2, 691 CrossRef CAS.
- Sh.-Q. Wang, Z.-Q. Zhu, P.-W. Li, C.-H. Zhao, C.-J. Zhao and H. Xia, J. Mater. Chem. A, 2018, 6, 20015 RSC.
- P. Shen, Z.-Y. Wang, C.-M. Yang, L.-P. Zhao, T.-C. Liu, M. Shen, J.-H. Li and D. Qian, Electrochim. Acta, 2018, 283, 1568 CrossRef CAS.
- S. Ranganatha and N. Munichandraiah, ACS Omega, 2018, 3, 7955 CrossRef CAS.
- Q.-S. Fu, X.-Y. Wang, N. Zhang, J. Wen, L. Li, H. Gao and X.-T. Zhang, J. Colloid Interface Sci., 2018, 511, 128 CrossRef CAS.
- Q.-S. Fu, J. Wen, N. Zhang, L.-L. Wu, M.-Y. Zhang, S.-Y. Lin, H. Gao and X.-T. Zhang, RSC Adv., 2017, 7, 11998 RSC.
- S.-Y. Lin and X.-T. Zhang, J. Power Sources, 2015, 294, 354 CrossRef CAS.
- W.-Y. Wu, S.-Y. Lin, T.-T. Chen, L. Li, Y. Pan, M.-Y. Zhang, L.-L. Wu, H. Gao and X.-T. Zhang, J. Alloys Compd., 2017, 729, 1165 CrossRef CAS.
- Y. Wang, Z.-L. Yin, Z.-X. Wang, X.-H. Li, H.-J. Guo, J.-X. Wang and D.-C. Zhang, Electrochim. Acta, 2019, 293, 40 CrossRef CAS.
- J. Zhao, Z.-J. Li, X.-C. Yuan, T. Shen, L.-G. Lin, M. Zhang, A. Meng and Q.-D. Li, Chem. Eng. J., 2019, 357, 21 CrossRef CAS.
- J. Yang, H.-W. Liu, W. N. Martens and R. L. Frost, J. Phys. Chem. C, 2010, 114, 111 CrossRef CAS.
- H.-P. Chen, Y.-F. Zhang, J. Yang, Z.-Y. Dai, N.-N. Fu, W. Huang and X.-C. Dong, J. Mater. Chem. A, 2015, 3, 20690 RSC.
- Y. Peng, H.-Y. Zhou and Z.-H. Wang, CrystEngComm, 2012, 14, 2812 RSC.
- D. Guo, P. Zhang, H.-M. Zhang, X.-Z. Yu, J. Zhu, Q.-H. Li and T.-H. Wang, J. Mater. Chem. A, 2013, 1, 9024 RSC.
- R. Ding, X.-D. Li, W. Shi, Q.-L. Xu and E.-H. Liu, Chem. Eng. J., 2017, 320, 376 CrossRef CAS.
- X.-D. Li, R. Ding, W. Shi, Q.-L. Xu and E.-H. Liu, Chem. - Eur. J., 2017, 23, 6896 CrossRef CAS PubMed.
- X. Yu, J.-L. Yu, L. Hou, A. Gagnoud, Y. Fautrelle, Z.-M. Ren and X. Li, J. Power Sources, 2018, 408, 65 CrossRef CAS.
- X.-Y. Wang, Q.-F. Fu, J. Wen, X.-Z. Ma, C.-C. Zhu, X.-T. Zhang and D.-P. Qi, Nanoscale, 2018, 10, 20828 RSC.
- X.-F. Lu, Z.-X. Huang, Y.-X. Tong and G.-R. Li, Chem. Sci., 2016, 7, 510 RSC.
- S. Zhou, K. Chen, H.-Y. Quan, M.-X. Su, Z. Zeng, M.-H. Pan, D.-Z. Chen and L. Guo, J. Mater. Sci., 2019, 54, 9111 CrossRef CAS.
- X. M. Liu, L. Zhang, X.-R. Gao, C. Guan and Y.-T. Hu, Nano Energy, 2019, 61, 18 CrossRef.
- F. Liu, L.-L. Zeng, Y.-K. Chen, R.-T. Zhang, R.-Q. Yang, J.-B. Pang, L.-H. Ding, H. Liu and W.-J. Zhou, Appl. Surf. Sci., 2018, 450, 66 CrossRef.
- B. Li, Y.-X. Shi, K.-S. Huang, M.-M. Zhao, J.-Q. Qiu, H.-G. Xue and H. Pang, Small, 2018, 14, 1703811 CrossRef.
Footnote |
| † Electronic supplementary information (ESI) available. See DOI: 10.1039/c9ra06393e |
| This journal is © The Royal Society of Chemistry 2019 |

