DOI:
10.1039/C9RA06824D
(Paper)
RSC Adv., 2019,
9, 35549-35558
Probing relaxation dynamics of a cationic lipid based non-viral carrier: a time-resolved fluorescence study
Received
28th August 2019
, Accepted 18th October 2019
First published on 1st November 2019
Abstract
Lipid vesicles composed of cationic dioctadecyldimethylammonium bromide (DODAB) and neutral 1-monooleoyl-rac-glycerol (MO) are promising non-viral carriers of nucleic acids for delivery into cells. Among them, higher cell transfection efficiency was displayed by DODAB-rich vesicles than those enriched with MO. Structural relaxation of these mixed lipid vesicles plays a key role in their cell transfection efficiency because structural organization of the DODAB-rich vesicles are different from that of the MO-rich vesicles. Polarization-gated anisotropy in conjunction with picosecond resolved emission transients of a novel fluorophore 6-acetyl-(2-((4-hydroxycyclohexyl)(methyl)amino)naphthalene) (ACYMAN) has been employed to probe relaxation dynamics in pure DODAB vesicles, and in mixed vesicles of DODAB with varying content of MO. Both orientational relaxation of ACYMAN and relaxation dynamics of its local environment are retarded significantly in mixed lipid vesicles with increasing MO content, from a mole fraction (χMO) of 0.2 to that of 0.8 which is consistent with increased rigidity of the MO-rich (χMO > 0.5) vesicles relative to the DODAB-rich (χMO < 0.5) vesicles. Therefore, higher structural rigidity of the MO-rich vesicles (χMO > 0.5) gives rise to their lower cell transfection efficiency than the more flexible DODAB-rich (χMO < 0.5) vesicles as observed in previous in vivo studies (Biochim. Biophys. Acta, Biomembr., 2014, 1838, 2555–2567).
Introduction
Vesicles, based on cationic lipids, are one of the most promising carriers among non-viral vectors in gene therapy.1 The headgroups of the cationic lipids interact with the negatively charged phosphates of DNA forming lipoplexes, and the nucleic acid can be untied from these DNA-cationic lipid complexes (lipoplexes) for release into the cytoplasm which is crucial to successful delivery of DNA into the cell. The addition of neutral lipids to cationic lipid vesicles favours fusion of the lipoplexes with cell membranes, due to their propensity to form non-lamellar structures which are akin to membrane fusion intermediates and therefore, act as important mediators in cell transfection.2–5
Recent studies5,6 have revealed that tuning the content of MO in vesicles composed of a cationic lipid dioctadecyldimethylammonium bromide (DODAB, Scheme 1) and a neutral lipid 1-monooleoyl-rac-glycerol or monoolein (MO, Scheme 1) not only alters the structural organization of the lipoplexes between multilamellar and inverted non-lamellar structures, but, also modulates the cell transfection efficiency of these non-viral carriers. For example, lipid vesicles of DODAB with higher MO content (χMO > 0.5) were found to exhibit lower cell transfection efficiency than those enriched with DODAB (χMO < 0.5).5 The low transfection efficiency of the MO-rich vesicles was thought to be related to their higher stability conferred by the non-lamellar inverted phases, which are advantageous regarding DNA encapsulation and protection, but have a drawback in efficient release of DNA into the cell cytosol.6 On the other hand, several reports7–9 have established a correlation between the membrane fluidity and improved in vitro transfection activity, where cationic lipids characterized by increased acyl chain fluidity and high interfacial elasticity were found to demonstrate high in vitro transfection activity hinting to the role of membrane dynamics in cell transfection. Lipid structural dynamics plays a key role in membrane fluidity and is known to be coupled with the dynamics of membrane hydration water.10 Therefore, it is of particular interest to probe the dynamics of structural relaxation of the DODAB![[thin space (1/6-em)]](https://www.rsc.org/images/entities/char_2009.gif) :
:![[thin space (1/6-em)]](https://www.rsc.org/images/entities/char_2009.gif) MO mixed vesicles at different compositions via mapping of the associated hydration dynamics.
MO mixed vesicles at different compositions via mapping of the associated hydration dynamics.
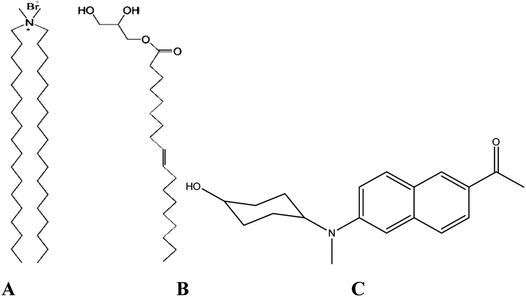 |
| | Scheme 1 DODAB (A), MO (B) and ACYMAN (C). | |
Solvation dynamics is a powerful technique to probe relaxation dynamics of water molecules (hydration dynamics) associated with biomolecular surfaces and interfaces11–15 where relaxation of the local environment of an optically excited fluorophore is monitored by measurements of time-dependent fluorescence Stokes shift (TDFSS). In the present work we have chosen a novel fluorophore, 6-acetyl-(2-((4-hydroxycyclohexyl)(methyl)amino)naphthalene)16 (ACYMAN, Scheme 1) to investigate hydration dynamics in the lipid–water interfaces of different DODAB/MO mixed vesicles, because, ACYMAN was found to be more suitable in probing water dynamics in micelle–water and protein–surfactant interfaces14 compared to common solvation probes coumarin-500 (C500) and 4-dicyanomethylene-2-methyl-6-p-dimethylaminostyryl-4H-pyran (DCM). C500 and DCM reported a distinctly different timescale of solvation (ca. 1.4 ns versus 70 ps) for the micelle–water interface of SDS14,17 which may be attributed to their slightly different location in the micelle–water interface. Whereas C500 is localized in the polar side (head group region) of the micellar surface, DCM prefers to reside in the more hydrophobic region of the surface of the micelles.18 The timescale of water relaxation dynamics in the micelle–water interface has been found to be in 10–100 ps range,19–22 which was nicely consistent with the relaxation time (∼50 ps) reported by ACYMAN.14 Furthermore, compared to ACYMAN, both C500 and DCM fail to probe the interfacial solvation dynamics of a model protein–surfactant interface. While C500 is found to be delocalized from the protein–surfactant interface, DCM becomes destabilized upon the formation of the interface (protein–surfactant complex).14 Additionally, ACYMAN possesses good solubility in water (∼10−4 M) and preferentially locates in the headgroup region of the micelle–water interface. Thus, we expect ACYMAN to be a better fluorophore for probing the relaxation dynamics of water molecules in the lipid–water interfaces of lipid vesicles. Herein, we have measured the TDFSS and fluorescence anisotropy decays of optically excited ACYMAN in pure DODAB vesicles and in presence of non-lamellar forming lipid MO at different molar ratios to monitor both solvation and orientational relaxation dynamics in lipid–water interfaces, which further manifests the dynamic nature of coupling between the structural flexibility of the lipids and their associated water molecules in the picosecond-to-nanosecond time scale. Our work has further elucidated that orientational relaxation dynamics of the probe in these model non-viral carriers becomes increasingly hindered with increasing content of the neutral lipid (MO) and highlights the role of structural rigidity of these mixed vesicle based nano-vehicles in their cell transfection efficiency.
Results and discussion
Steady-state spectroscopic studies
Fig. 1a displays steady state spectral characteristics of ACYMAN in water, DMF and neat DODAB vesicles. In comparison to DMF the emission peak maximum of ACYMAN undergoes a significant red shift (∼20 nm) in neat DODAB vesicles (λem ∼500 nm), but is blue shifted (∼10 nm) relative to water. This is consistent with location of the probe in the polar head group region of the lipid–water interface of these vesicles owing to solvent polarity sensitive fluorescence of ACYMAN.16 Upon an increase of MO content the emission peak maximum in DODAB vesicles undergoes a blue shift (∼25 nm) along with increasing intensity (Fig. 1b) indicating less polar microenvironment of the ACYMAN dye in the DODAB/MO vesicles compared to the lipid–water interface of pure DODAB vesicles. Moreover, increase of fluorescence intensity of ACYMAN with increasing MO content originates from a decrease in hydration of the dye environment relative to pure DODAB vesicles which may be ascribed to closer contact between the probe and the inverted non-lamellar phases formed by MO-enriched domains enclosed by DODAB bilayer.6
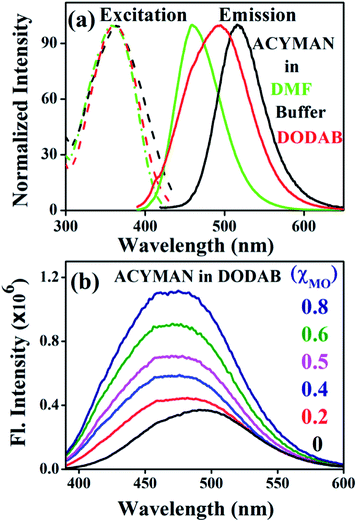 |
| | Fig. 1 (a) Steady state excitation and emission spectra of ACYMAN in various solvents and in the presence of DODAB (5 mM). (b) Fluorescence emission spectra of ACYMAN in DODAB with increasing concentrations of MO. | |
Time-resolved fluorescence studies
Time-resolved fluorescence of ACYMAN in aqueous buffer is characterized by a bi-exponential decay (Fig. 2a) with a faster component of 0.27 ns (78%) and a longer component of 0.6 ns (22%), (Table 1). Such bi-exponential decays in water for a probe undergoing intramolecular charge transfer (ICT) is an intrinsic characteristic of the probe indicating different channels of radiative de-excitation into the ground state.23,24 Unlike aqueous buffer, fluorescence transients at the emission peak maximum of ACYMAN are characterized by a growth followed by a decay (Fig. 2) in both pure DODAB and mixed DODAB/MO vesicles. The observed growth in the fluorescence transients of lipid vesicles is consistent with the appearance of one or two rise components (τ1 and τ2, Table 1). It is worthy of mentioning that appearance of the two rise components associated with fluorescence transient for lipids with (χMO ≥ 0.4) at emission peak maximum cannot be attributed to any physical significance. For all lipids, the faster time constants (τ1 and τ2, Table 1) are associated with positive amplitudes (data not shown) when the fluorescence transients are monitored at blue edge of the steady state emission spectra, and they become rise components (associated with negative amplitude) when monitored at red side of the steady state spectra. The faster time constants (τ1 and τ2), therefore, are characteristic of relaxation of the local environment around the excited state dipole of ACYMAN in the lipid–water interfaces.15,25 In addition, the longest decay component (τ3) at the emission peak maximum (Table 1) is found to be similar to that obtained from the fluorescence transients monitored at the blue or the red end (data not shown) and may be attributed to fluorescence lifetime of the probe in lipid vesicles.
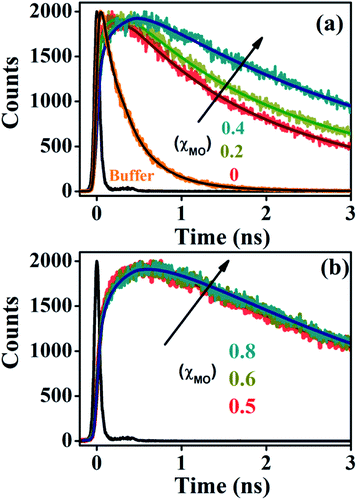 |
| | Fig. 2 Fluorescence transients of ACYMAN at emission peak maximum. (a) In buffer and lipid vesicles up to χMO = 0.4. (b) χMO from varies from 0.5 to 0.8. χMO = 0 represents pure DODAB. | |
Table 1 Time-resolved decay parameters of ACYMAN at emission peak maximuma
| System |
τ1/ns(%) |
τ2/ns(%) |
τ3/ns(%) |
| Amplitude or intensity fraction of each decay component is shown within parentheses. |
| Buffer |
0.27 ± 0.01(78) |
0.60 ± 0.03(22) |
|
| χMO(0.0) |
0.09 ± 0.01(−21) |
1.35 ± 0.06(46) |
2.82 ± 0.14(33) |
| χMO(0.2) |
0.13 ± 0.01(−21) |
1.33 ± 0.06(32) |
3.05 ± 0.15(47) |
| χMO(0.4) |
0.05 ± 0.01(−20) |
0.36 ± 0.01(−16) |
3.11 ± 0.16(64) |
| χMO(0.5) |
0.07 ± 0.01(−18) |
0.54 ± 0.02(−18) |
3.22 ± 0.16(64) |
| χMO(0.6) |
0.08 ± 0.01(−8) |
0.56 ± 0.02(−26) |
3.28 ± 0.17(66) |
| χMO(0.8) |
0.10 ± 0.01(−9) |
0.59 ± 0.03(−27) |
3.30 ± 0.17(64) |
The fluorescence lifetime (τ3) of ACYMAN becomes significantly large in pure DODAB vesicles (2.82 ns) relative to aqueous buffer (average lifetime ∼ 0.34 ns), and originates from inhibition of non-radiative relaxation of the excited charge transfer (CT) state due to efficient screening of the dye from perturbation of water molecules.26 In addition, upon an increase of the MO content (χMO) gradual increase of the fluorescence lifetime (τ3) is observed in DODAB/MO mixed vesicles (Table 1) relative to pure DODAB vesicles because of increasingly more efficient screening of the dye from perturbation of water molecules in the former than the latter. This is consistent with the observed blue shift along with increasing fluorescence intensity (Fig. 1b) in the emission spectrum of ACYMAN upon increasing MO content in the mixed lipid vesicles.
Time-resolved fluorescence anisotropy decay
In comparison to free rotation in homogeneous solvents, orientational motion of a probe in organized assemblies, such as membranes or lipid bilayer, is limited in angular range, because the surrounding architecture imposes certain restrictions on the orientation of the probe.27 In addition, friction within the structure often reduces the rate of reorientational motion from the value that would be expected in homogeneous media. Thus, fluorescence anisotropy decay measurements can provide informations on structural (the range) and dynamical (the rate)27,28 aspects of dye-lipid membrane interactions. In case of neat DODAB and mixed lipid vesicles, the fluorescence anisotropy (r(t)) of ACYMAN does not decay to zero at long times, but, to a constant value (Fig. 3) which is typical of hindered or restricted rotational diffusion observed for probes bound to lipid bilayer membranes.27–29 The anisotropy decay, r(t), of ACYMAN in these vesicles could be fitted reasonably well with a mono-exponential function in accordance with the wobbling-in-cone model.27,28| |
 | (1) |
where r0 is the fundamental anisotropy, r∞ (residual anisotropy) is the emission anisotropy at sufficiently long time after the excitation and ϕ is the time constant for orientational relaxation. Moreover, an estimate of the degree of orientational constraint in a cone is obtained from r0 and r∞ in terms of the cone angle (θc) as follows.28,29| |
r∞/r0 = [1/2![[thin space (1/6-em)]](https://www.rsc.org/images/entities/char_2009.gif) cos cos![[thin space (1/6-em)]](https://www.rsc.org/images/entities/char_2009.gif) θc(1 + cos θc(1 + cos![[thin space (1/6-em)]](https://www.rsc.org/images/entities/char_2009.gif) θc)]2 θc)]2
| (2) |
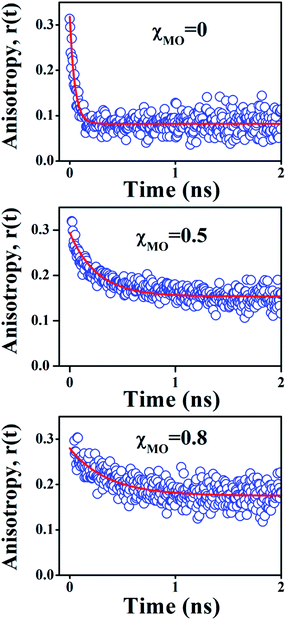 |
| | Fig. 3 Time-resolved decay of fluorescence anisotropy, r(t), of ACYMAN in pure DODAB (χMO = 0) and mixed DODAB/MO vesicles (χMO = 0.5 and 0.8). | |
In an isotropic medium, orientational relaxation of a dye is completely free and the cone angle θc is 90° whereas, if orientational relaxation is completely hindered in a highly rigid environment θc = 0°. The cone angle (θc) thus varies between 0° and 90°. A lower value of θc is indicative of a highly rigid environment which significantly restricts the orientational motion of the probe. In case of lipid vesicles with higher MO content (χMO = 0.6–0.8) the anisotropy decays are also characterized by a large residual anisotropy (0.18) which is consistent with significantly hindered orientational relaxation30 of the probe in a highly rigid local environment. Furthermore, the cone angle (θc) is found to decrease regularly with increasing MO content from 52° in pure DODAB vesicles to 31° in the DODAB/MO (1![[thin space (1/6-em)]](https://www.rsc.org/images/entities/char_2009.gif) :
:![[thin space (1/6-em)]](https://www.rsc.org/images/entities/char_2009.gif) 4) vesicles. Upon an increase of MO content rigidity of lipid vesicles likely increases, which in turn restricts the orientational motion of the probe in a cone resulting in the decrease of the cone angle. Thus, the observed decrease of the cone angle (θc) is consistent with increased rigidity of the lipid vesicles with increasing content of MO (Table 2).
4) vesicles. Upon an increase of MO content rigidity of lipid vesicles likely increases, which in turn restricts the orientational motion of the probe in a cone resulting in the decrease of the cone angle. Thus, the observed decrease of the cone angle (θc) is consistent with increased rigidity of the lipid vesicles with increasing content of MO (Table 2).
Table 2 Rotational relaxation parameters of ACYMAN in different systemsa
| System |
r0 |
r∞ |
ϕ (ps) |
r∞/r0 |
θc (degree) |
| r0 and r∞ are fundamental and residual anisotropy, respectively. ϕ is effective rotational correlation time and θc is the cone angle. χMO = 0.0 and 0.2–0.8 corresponds to pure DODAB and mixed vesicles, respectively. |
| (Pure DODAB), χMO (0.0) |
0.32 |
0.08 |
48 |
0.25 |
52.0 |
| χMO = 0.2 |
0.26 |
0.11 |
62 |
0.42 |
42.0 |
| χMO = 0.4 |
0.27 |
0.13 |
230 |
0.48 |
39.0 |
| χMO = 0.5 |
0.29 |
0.15 |
260 |
0.52 |
37.0 |
| χMO = 0.6 |
0.31 |
0.17 |
334 |
0.55 |
35.5 |
| χMO = 0.8 |
0.28 |
0.18 |
361 |
0.64 |
31.0 |
Dynamics of solvation in lipid vesicles
Fig. 4a–c(inset) exhibits wavelength-dependent fluorescence transients of ACYMAN in neat DODAB and mixed DODAB/MO vesicles at the blue end and the red end of the steady state fluorescence spectrum as well as at the emission peak maximum. One or two faster decay components, (τ1, τ2), associated with the time-resolved fluorescence decay monitored at the blue edge of the steady state fluorescence spectrum becomes a rise component at the emission peak maximum (Table 1.) and at the red edge of the steady state fluorescence spectrum. This is typical of solvation dynamics11,13–15 which is manifested by a time-dependent Stokes shift of the fluorescence spectrum to the red (Fig. 4a–c). The decay of the solvation correlation function, C(t), which describes the influence of solvent reorganization on the excited state dipole of the fluorophore for pure DODAB and mixed DODAB/MO vesicles is shown in Fig. 5. It is characterized by two time constants (τS1, τS2) (Table 3) indicating mediation of two types of water trajectories in the overall solvation response of the probe. Among them the faster relaxation component (τS1) may be attributed to lipid headgroup bound water molecules in agreement with Zewail et al.,15 whereas, the slower component (τS2) likely originates from water molecules dynamically coupled with local lipid chain fluctuations.19,31
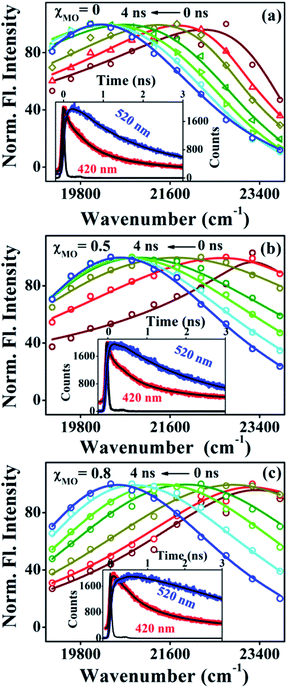 |
| | Fig. 4 Time-resolved emission spectra (TRES) of ACYMAN in pure DODAB (a) and in presence of MO (b) χMO = 0.5 and (c) χMO = 0.8. Insets display fluorescence transients at the blue edge (420 nm) and red edge (520 nm) of the steady state emission spectra. | |
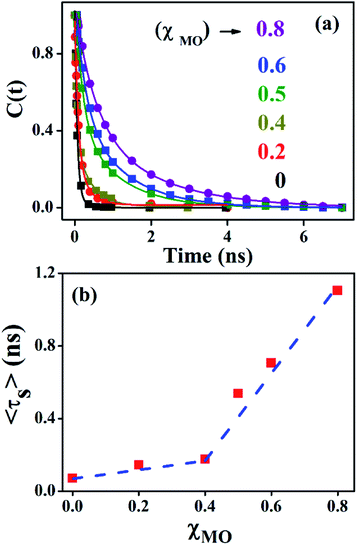 |
| | Fig. 5 Solvation correlation function of ACYMAN in pure DODAB (χMO = 0.0) and mixed DODAB/MO (χMO = 0.2–0.8) vesicles at different molar fraction of MO. | |
Table 3 Solvation correlation times in different systemsa
| System |
τS1/ns (α1) |
τS2/ns (α2) |
〈τS〉/ns |
| τS1, τS2 are solvent relaxation times, respectively. 〈τS〉 = α1τS1 + α2τS2 is the mean solvation time. |
| χMO(0.0) |
0.06 ± 0.01(95) |
0.28 ± 0.01(5) |
0.07 |
| χMO(0.2) |
0.08 ± 0.02(74) |
0.31 ± 0.01(26) |
0.14 |
| χMO(0.4) |
0.06 ± 0.01(65) |
0.40 ± 0.02(35) |
0.17 |
| χMO(0.5) |
0.18 ± 0.01(60) |
1.08 ± 0.05(40) |
0.54 |
| χMO(0.6) |
0.26 ± 0.02(53) |
1.20 ± 0.06(47) |
0.70 |
| χMO(0.8) |
0.50 ± 0.02(55) |
1.80 ± 0.09(45) |
1.08 |
In going from pure DODAB to DODAB rich vesicles (χMO ∼ 0.2–0.4) the contribution of the faster relaxation component (τS1) decreases along with increased contribution from the longer relaxation component (τS2) leading to an increase in the average solvation time from 70 ps to 170 ps (Table 3). On further increase of the MO content (χMO) from 0.4 to 0.8 the contribution of the longer relaxation component (τS2) increases further at the expense of the faster component (τS1) along with significant enhancement of both the components which give rise to remarkably slow dynamics of solvation in MO-enriched lipid vesicles relative to pure DODAB or DODAB rich vesicles. This is likely due to closer contact between the probe and the inverted non-lamellar phases formed by MO-enriched domains enclosed by DODAB bilayers6,32 where the dye is efficiently screened from contact with the lipid–water interface of the DODAB bilayer. As a result the role of the faster relaxation component owing to lipid headgroup bound water molecules becomes less important compared to water molecule dynamics coupled with local lipid chain fluctuations in the overall solvation response for MO-rich (χMO ∼ 0.6–0.8) lipid vesicles. From time-resolved anisotropy measurements the orientational relaxation of the dye was found to be significantly hindered indicating highly rigid local environment of the dye in MO-rich lipid vesicles (χMO > 0.5) which is consistent with the observation of significantly longer relaxation component (τS2 ∼ 1.2–1.8 ns) owing to slower lipid chain mobility or fluctuations. Given that solvation is a collective response of the dye local environment33 to its optical excitation, retardation of solvation dynamics in mixed vesicles reflects significantly increased rigidity of the local environment of ACYMAN with increasing content of MO. This is further corroborated from Fig. 6 displaying an increase of the average solvation time (〈τS〉) with increase of the rotational relaxation time (ϕ) or decrease of the cone angle (θc) upon increasing MO content. Both the increase of the rotational relaxation time (ϕ) and the decrease of the cone angle (θc) are reflective of increased degree of orientational constraint imposed upon the probe due to increased rigidity of its local environment. Thus, structural relaxation of the dye environment in the DODAB![[thin space (1/6-em)]](https://www.rsc.org/images/entities/char_2009.gif) :
:![[thin space (1/6-em)]](https://www.rsc.org/images/entities/char_2009.gif) MO vesicles becomes nicely manifested by solvation dynamics in the lipid vesicles.
MO vesicles becomes nicely manifested by solvation dynamics in the lipid vesicles.
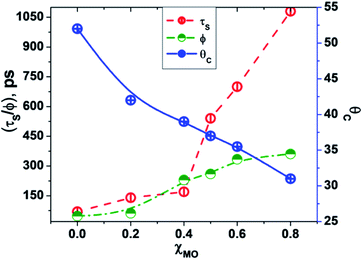 |
| | Fig. 6 Correlation between average solvent relaxation time (〈τS〉, red circle), rotational relaxation time (ϕ, green circle) and cone angle (θc, blue circle) with increasing content of monoolein (χMO). | |
Förster resonance energy transfer (FRET)
The correlation between structural flexibility or rigidity of the lipid vesicles and relaxation dynamics of ACYMAN becomes further evident from measurements of the energy transfer efficiency from ACYMAN (donor) to Nile red (acceptor) and from the calculation of distance distributions between the donor (ACYMAN) and the acceptor (Nile red) molecules in pure DODAB as well as DODAB/MO vesicles in presence of varying MO content. In the study of Förster resonance energy transfer (FRET) ACYMAN is chosen as the donor with Nile red as acceptor, because, its fluorescence spectrum overlaps reasonably well (overlap integral value, 2.48 ×10¹⁵ M−1 cm−1 nm4) with the absorption spectrum of Nile red in lipid vesicles (Fig. 7a). Time-resolved decay profiles of ACYMAN (Fig. 7b–d) in absence and presence of Nile red clearly indicates that energy transfer becomes more efficient in mixed DODAB/MO vesicles relative to neat DODAB vesicles. The energy transfer efficiency from ACYMAN to Nile red is found to increase with increasing content of MO (χMO) and it becomes maximum ∼35.5% in presence of highest MO content (χMO = 0.8) when the average distance of separation between the donor (ACYMAN) and the acceptor (NR) becomes minimum ∼49.2 Å (Table 4). Thus molecular recognition of Nile red by ACYMAN is least efficient for pure DODAB based vesicles, which, however becomes increasingly more efficient in mixed DODAB-MO system upon an increase of the MO content.
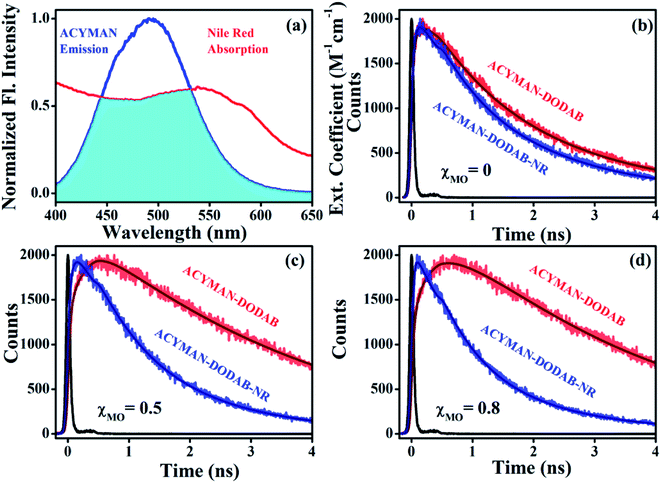 |
| | Fig. 7 (a) Spectral overlap of ACYMAN (donor) emission and Nile red (acceptor) absorption. Fluorescence transients of ACYMAN at 490 nm in lipid vesicles in absence (fitted by using eqn (3)) and presence of Nile red (fitted by eqn (4)). (b) For χMO = 0, χ2 = 1.15 (fitted donor decay) and 1.20 (fitted donor decay in presence of acceptor). (c) For χMO = 0.5, χ2 = 1.12 (fitted donor decay) and 1.10 (fitted donor decay in presence of acceptor). (d) For χMO = 0.8, χ2 = 1.03 (fitted donor decay) and 1.05 (fitted donor decay in presence of acceptor). (χMO = 0 represents pure DODAB); excitation wavelength 375 nm. χ2 (chi-square) is the parameter for judging the best fit to fluorescence decay of donor (ACYMAN) in absence and presence of the acceptor (Nile red). | |
Table 4 FRET parameters and parameters associated with distance distribution of ACYMAN (donor) in presence of Nile red (acceptor)a
| System |
J(λ) |
E (%) |
![[r with combining macron]](https://www.rsc.org/images/entities/i_char_0072_0304.gif) (Å) (Å) |
hw (Å) |
χ2 |
J(λ) is spectral overlap integral between donor absorption and acceptor emission, E is energy transfer efficiency, ![[r with combining macron]](https://www.rsc.org/images/entities/i_char_0072_0304.gif) is mean donor–acceptor distance, hw is half-width of the probability distribution for donor–acceptor distances (Fig. 8), χ2 is the parameter corresponding to fitting of fluorescence decay of donor in presence of acceptor by eqn (4). is mean donor–acceptor distance, hw is half-width of the probability distribution for donor–acceptor distances (Fig. 8), χ2 is the parameter corresponding to fitting of fluorescence decay of donor in presence of acceptor by eqn (4). |
| χMO(0.0) |
1.85 × 10¹⁵ |
21.6 |
56.6 |
3.2 |
1.20 |
| χMO(0.2) |
1.72 × 10¹⁵ |
25.4 |
53.9 |
3.0 |
1.21 |
| χMO(0.4) |
1.54 × 10¹⁵ |
26.8 |
52.3 |
2.7 |
1.15 |
| χMO(0.5) |
1.65 × 10¹⁵ |
30.9 |
51.2 |
2.2 |
1.10 |
| χMO(0.6) |
1.60 × 10¹⁵ |
32.4 |
50.3 |
1.6 |
1.13 |
| χMO(0.8) |
1.57 × 10¹⁵ |
35.5 |
49.2 |
1.1 |
1.05 |
The probability distribution of the donor–acceptor distances is characterized by a broader half-width (hw = 3.2 Å) for the neat DODAB vesicles than mixed vesicles in presence of MO (Fig. 8) and the half-width of the distribution curve decreases with increase of MO content reaching a minimum (hw = 1.1 Å) at the highest MO content (χMO = 0.8). The broader hw value for the neat DODAB vesicles is indicative of their greater structural flexibility34 compared to mixed vesicles having a smaller hw value. Therefore, the decrease of the hw value in the distribution of donor–acceptor distances is consistent with increasing structural rigidity of the DODAB-MO vesicles with increasing content of MO. The increase in structural rigidity of the DODAB/MO mixed vesicles with increasing MO content likely affect the cell transfection efficacy of these model non-viral carriers, since, structural relaxation of the complexes formed between these carriers and nucleic acids plays a crucial step towards delivery of the nucleic acid to the cell cytosol.6 The more structurally flexible is the vesicle based carrier more efficient becomes the delivery of the nucleic acid from the lipoplex (complex of lipids with nucleic acid) to the target cell with enhanced cell transfection efficiency.6,35 As a consequence lower cell transfection efficiency of the MO-rich (χMO > 0.5) lipid vesicles likely originate from their increased structural rigidity compared to the DODAB-rich (χMO < 0.5) vesicles.
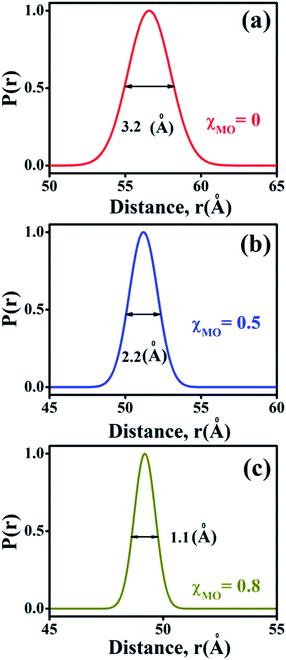 |
| | Fig. 8 Probability distribution of donor–acceptor distances between ACYMAN and Nile red in DODAB-vesicles at (a) χMO (0.0), (b) χMO (0.5) and (c) χMO (0.8). | |
Conclusions
The relaxation dynamics of lipid vesicles based model non-viral carriers, DODAB and DODAB/MO were monitored by measurements of time-dependent fluorescence Stokes shift in conjunction with time-resolved anisotropy decays of a novel fluorophore, ACYMAN. Both solvation dynamics and orientational relaxation dynamics of the probe in pure DODAB vesicles become slower upon an increase of MO content from a mole fraction of 0.2 to that of 0.8 manifesting higher rigidity of the MO-rich vesicles than the DODAB-rich vesicles. From Förster energy transfer (FRET) studies the half-width (hw) of the distribution curve of donor (ACYMAN)-acceptor (Nile red) distances for neat DODAB vesicles is found to decrease with increasing MO content indicating increased structural rigidity of the mixed lipid vesicles in presence of MO. In previous in vivo studies6 the cell transfection efficiency of the DODAB/MO based non-viral carriers was found to be affected by their structural rigidity. From our work, the role of flexibility/or rigidity of lipid vesicle based non-viral carrier seems to be reflected in their cell transfection efficiency. The more structurally flexible is the vesicle based non-viral carrier, more efficient becomes the delivery of the nucleic acid from the lipoplex (complex of lipids with nucleic acid) to the target cell and vice versa. This gives rise to the lower cell transfection efficiency of the highly rigid MO-rich (χMO > 0.5) mixed vesicles than the more flexible DODAB rich (χMO < 0.5) vesicles.
Experimental section
Chemicals
DODAB, (C18H37)2N(CH3)2Br powder (>98%) and 1-monooleoyl-rac-glycerol (MO) were obtained from Tokyo Chemical Industries Co. LTD and sigma, respectively. Nile red is from sigma. The water is from Millipore system. The experimental procedure for the synthesis of the ACYMAN dye has been described earlier.16
Synthesis of the DODAB vesicles
20 mM DODAB vesicles were prepared by mixing the appropriate amounts of DODAB powder in Tris–HCl buffer solution (30 mM, pH = 7.4). The obtained mixture was kept under magnetic stirring at 70 °C for 30–45 min, which yielded an almost transparent fluid. The obtained DODAB dispersion was then equilibrated for a day. To prepare the aqueous dispersions of DODAB/MO, defined aliquots from the stock solutions of MO in ethanol (20 mM) were injected, under vigorous stirring, to an aqueous solution of DODAB at 70 °C. Several DODAB/MO molar ratios were obtained.36
Characterization techniques
The steady state emission spectra were measured with Jobin Yvon fluorolog fluorimeter. All the picosecond resolved fluorescence transients were measured by using commercially available time-correlated single-photon counting (TCSPC) setup with MCP-PMT from Edinburgh instrument, U. K. The instrument response function (IRF) of the 375 nm excitation laser source is ∼75 ps. Details of the time resolved fluorescence setup have been discussed in our previous reports.14,19 For the fluorescence anisotropy measurements, the emission polarizer was adjusted to be parallel and perpendicular to that of the excitation and the corresponding fluorescence transients are collected as IVV and IVH, respectively. Time-resolved fluorescence anisotropy is defined as  . The magnitude of G, the grating factor of the emission monochromator of the TCSPC system, was found using a long tail matching technique. Time-resolved emission spectra (TRES) were constructed following the methods described earlier37 for determination of time dependent fluorescence Stokes shifts. In brief, the normalized spectral shift correlation function or the solvent correlation function, C(t), is defined as
 , where ν(0), ν(t), and ν(∞) are the emission peak maximum (in cm−1) at time 0, t, and ∞ respectively.
Förster resonance energy transfer study. FRET distance between donor–acceptor (r) was calculated from the equation r6 = [R06(1 − E)]/E, where E is the efficiency of the energy transfer between donor–acceptor and calculated using the equation  . Here τDA and τD are fluorescence lifetimes of the donor in presence and absence of acceptor. The Förster distance (R0) was calculated using overlap integral of the emission spectrum of donor and absorption spectrum of acceptor following the equation
  in Å, where κ2 is a factor describing the relative orientation in space of the transition dipoles of the donor and the acceptor. The magnitude of κ2 is assumed to be 0.66 for random orientation of the donor and the acceptor. The refractive index (η) of the biological medium is assumed to be 1.4. J(λ) is overlap integral of emission of donor and absorption of acceptor and calculated by
  , where FD(λ) dλ is the fluorescence emission of the donor in the wavelength region λ to λ + dλ. ε(λ) is extinction coefficient (in M−1 cm−1) of acceptor. Distance distribution function P(r) was evaluated using the procedure described in the previous literature.8,38–41 The decay transient of the donor in absence of acceptor were fitted using nonlinear least-squares fitting procedure to the following function
| |
 | (3) |
which comprises the convolution of the IRF(E(t)) with exponential  . The distance distribution function P(r) in the fluorescence transients of donor in presence of acceptor in the systems under study is estimated using the SCIENTIST from Micromath (Saint Louis, MO, USA) software in the following way.
The intensity decay of donor–acceptor pair spaced at a distance r is given by  and the intensity decay of the sample considering P(r) is given by
| |
 | (4) |
where

, where
![[r with combining macron]](https://www.rsc.org/images/entities/i_char_0072_0304.gif)
is the mean of the Gaussian with a standard deviation of
σ and
r is the donor acceptor distance. The distance distribution are described by full width at half maxima (FWHM) = 2.354
σ.
Conflicts of interest
There are no conflicts to declare.
Acknowledgements
Generous financial grant (179(Sanc.)/ST/P/S&T/15G-41/2017) to RD from the Dept. of Science & technology and biotechnology, Govt. of West Bengal is gratefully acknowledged. S. K. P. thanks the Abdul Kalam Technology Innovation National Fellowship for financial assistance. We thank DST-SERB EMR/2016/004698 and DBT-BT/PR11534/NNT/28/766/2014 for financial support.
References
- M. Ramezani, M. Khoshhamdam, A. Dehshahri and B. Malaekeh-Nikouei, Colloids Surf., B, 2009, 72, 1–5 CrossRef CAS.
- S. W. Hui, M. Langner, Y.-L. Zhao, P. Ross, E. Hurley and K. Chan, Biophys. J., 1996, 71, 590–599 CrossRef CAS.
- B. G. Tenchov, R. C. MacDonald and D. P. Siegel, Biophys. J., 2006, 91, 2508–2516 CrossRef CAS.
- I. S. Zuhorn, V. Oberle, W. H. Visser, J. B. Engberts, U. Bakowsky, E. Polushkin and D. Hoekstra, Biophys. J., 2002, 83, 2096–2108 CrossRef CAS.
- J. N. Silva, A. Oliveira, M. Casal, A. Gomes, P. J. Coutinho, O. Coutinho and M. R. Oliveira, Biochim. Biophys. Acta, 2011, 1808, 2440–2449 CrossRef CAS.
- J. N. Silva, I. Oliveira, A. Oliveira, M. Lúcio, A. Gomes, P. J. Coutinho and M. R. Oliveira, Biochim. Biophys. Acta Biomembr., 2014, 1838, 2555–2567 CrossRef CAS.
- M. Savva, P. Chen, A. Aljaberi, B. Selvi and M. Spelios, Bioconjugate Chem., 2005, 16, 1411–1422 CrossRef CAS.
- M. Savva, A. Aljaberi, J. Feig and D. B. Stolz, Colloids Surf., B, 2005, 43, 43–56 CrossRef CAS.
- A. Aljaberi, M. Spelios, M. Kearns, B. Selvi and M. Savva, Colloids Surf., B, 2007, 57, 108–117 CrossRef CAS.
- K. Wood, M. Plazanet, F. Gabel, B. Kessler, D. Oesterhelt, D. J. Tobias, G. Zaccai and M. Weik, Proc. Natl. Acad. Sci. U. S. A., 2007, 104, 18049–18054 CrossRef CAS.
- J. Sýkora, V. Mudogo, R. Hutterer, M. Nepras, J. Vaněrka, P. Kapusta, V. Fidler and M. Hof, Langmuir, 2002, 18, 9276–9282 CrossRef.
- S. K. Pal and A. H. Zewail, Chem. Rev., 2004, 104, 2099–2124 CrossRef CAS.
- T. Li, A. A. Hassanali and S. J. Singer, J. Phys. Chem. B, 2008, 112, 16121–16134 CrossRef CAS.
- P. Singh, S. Choudhury, S. Singha, Y. Jun, S. Chakraborty, J. Sengupta, R. Das, K.-H. Ahn and S. K. Pal, Phys. Chem. Chem. Phys., 2017, 19, 12237–12245 RSC.
- L. Zhao, S. K. Pal, T. Xia and A. H. Zewail, Angew. Chem., Int. Ed., 2004, 43, 60–63 CrossRef PubMed.
- S. Singha, D. Kim, B. Roy, S. Sambasivan, H. Moon, A. S. Rao, J. Y. Kim, T. Joo, J. W. Park and Y. M. Rhee, Chem. Sci., 2015, 6, 4335–4342 RSC.
- S. K. Pal, D. Sukul, D. Mandal, S. Sen and K. Bhattacharyya, Chem. Phys. Lett., 2000, 327, 91–96 CrossRef CAS.
- S. K. Pal, D. Sukul, D. Mandal and K. Bhattacharyya, J. Phys. Chem. B, 2000, 104, 4529–4531 CrossRef CAS.
- S. Choudhury, P. K. Mondal, V. Sharma, S. Mitra, V. G. Sakai, R. Mukhopadhyay and S.
K. Pal, J. Phys. Chem. B, 2015, 119, 10849–10857 CrossRef CAS.
- S. K. Pal, J. Peon and A. H. Zewail, Proc. Natl. Acad. Sci. U. S. A., 2002, 99, 1763–1768 CrossRef CAS.
- D. K. George, A. Charkhesht, O. A. Hull, A. Mishra, D. G. S. Capelluto, K. R. Mitchell-Koch and N. Q. Vinh, J. Phys. Chem. B, 2016, 120, 10757–10767 CrossRef CAS.
- E. E. Fenn, D. B. Wong and M. D. Fayer, Proc. Natl. Acad. Sci. U. S. A., 2009, 106, 15243–15248 CrossRef CAS.
- A. Chatterjee and D. Seth, Photochem. Photobiol., 2013, 89, 280–293 CrossRef CAS.
- J. Dana, T. Debnath, P. Maity and H. N. Ghosh, J. Phys. Chem. C, 2015, 119, 2046–2052 CrossRef CAS.
- S. K. Pal, J. Peon and A. H. Zewail, Proc. Natl. Acad. Sci. U. S. A., 2002, 99, 1763–1768 CrossRef CAS.
- J. Maiti, Y. Sarkar, P. P. Parui, S. Chakraborty, S. Biswas and R. Das, J. Lumin., 2015, 163, 21–27 CrossRef CAS.
- K. Kinosita Jr, A. Ikegami and S. Kawato, Biophys. J., 1982, 37, 461–464 CrossRef CAS.
- K. Kinosita Jr, S. Kawato and A. Ikegami, Biophys. J., 1977, 20, 289–305 CrossRef CAS.
- G. Lipari and A. Szabo, Biophys. J., 1980, 30, 489–506 CrossRef CAS.
- S. K. Pal, J. Peon, B. Bagchi and A. H. Zewail, J. Phys. Chem. B, 2002, 106, 12376–12395 CrossRef CAS.
- J. Yang, Y. Wang, L. Wang and D. Zhong, J. Am. Chem. Soc., 2017, 139, 4399–4408 CrossRef CAS.
- A. C. Oliveira, S. S. Nogueira, O. Gonçalves, M. F. Cerqueira, P. Alpuim, J. Tovar, C. Rodriguez-Abreu, G. Brezesinski, A. C. Gomes and M. Lúcio, RSC Adv., 2016, 6, 47730–47740 RSC.
- L. Nilsson and B. Halle, Proc. Natl. Acad. Sci. U. S. A., 2005, 102, 13867–13872 CrossRef CAS.
- A. Santos, A. G. Duarte, A. Fedorov, J. M. Martinho and I. Moura, Biophys. Chem., 2010, 148, 131–137 CrossRef CAS.
- C. M. Uritu, M. Calin, S. S. Maier, C. Cojocaru, A. Nicolescu, D. Peptanariu, C. A. Constantinescu, D. Stan, M. Barboiu and M. Pinteala, J. Mater. Chem. B, 2015, 3, 8250–8267 RSC.
- J. N. Silva, P. J. Coutinho and M. R. Oliveira, J. Fluoresc., 2008, 18, 555–562 CrossRef CAS.
- M. Horng, J. Gardecki, A. Papazyan and M. Maroncelli, J. Phys. Chem., 1995, 99, 17311–17337 CrossRef CAS.
- P. Singh, S. Choudhury, S. Dutta, A. Adhikari, S. Bhattacharya, D. Pal and S. K. Pal, ýInt. J. Biol. Macromol., 2017, 103, 395–402 CrossRef CAS.
- P. Singh, S. Choudhury, S. Kulanthaivel, D. Bagchi, I. Banerjee, S. A. Ahmed and S. K. Pal, Colloids Surf., B, 2018, 162, 202–211 CrossRef CAS.
- J. R. Lakowicz, Topics in fluorescence spectroscopy: probe design and chemical sensing, Springer Science & Business Media, 1994, vol. 4 Search PubMed.
- D. Bagchi, A. Ghosh, P. Singh, S. Dutta, N. Polley, I. I. Althagafi, R. S. Jassas, S. A. Ahmed and S. K. Pal, Sci. Rep., 2016, 6, 34399 CrossRef CAS.
Footnote |
| † Authors made equal contribution. |
|
| This journal is © The Royal Society of Chemistry 2019 |
Click here to see how this site uses Cookies. View our privacy policy here.  Open Access Article
 b,
V. K. Sharma
 c,
Ismail I. Althagafid,
Saleh A. Ahmed
 de,
R. Mukhopadhyay
 c,
Ranjan Das
 *f and
Samir Kumar Pal
 *a
*a
![[thin space (1/6-em)]](https://www.rsc.org/images/entities/char_2009.gif) :
:![[thin space (1/6-em)]](https://www.rsc.org/images/entities/char_2009.gif) MO mixed vesicles at different compositions via mapping of the associated hydration dynamics.
MO mixed vesicles at different compositions via mapping of the associated hydration dynamics.

![[thin space (1/6-em)]](https://www.rsc.org/images/entities/char_2009.gif) cos
cos![[thin space (1/6-em)]](https://www.rsc.org/images/entities/char_2009.gif) θc(1 + cos
θc(1 + cos![[thin space (1/6-em)]](https://www.rsc.org/images/entities/char_2009.gif) θc)]2
θc)]2

![[thin space (1/6-em)]](https://www.rsc.org/images/entities/char_2009.gif) :
:![[thin space (1/6-em)]](https://www.rsc.org/images/entities/char_2009.gif) 4) vesicles. Upon an increase of MO content rigidity of lipid vesicles likely increases, which in turn restricts the orientational motion of the probe in a cone resulting in the decrease of the cone angle. Thus, the observed decrease of the cone angle (θc) is consistent with increased rigidity of the lipid vesicles with increasing content of MO (Table 2).
4) vesicles. Upon an increase of MO content rigidity of lipid vesicles likely increases, which in turn restricts the orientational motion of the probe in a cone resulting in the decrease of the cone angle. Thus, the observed decrease of the cone angle (θc) is consistent with increased rigidity of the lipid vesicles with increasing content of MO (Table 2).
![[thin space (1/6-em)]](https://www.rsc.org/images/entities/char_2009.gif) :
:![[thin space (1/6-em)]](https://www.rsc.org/images/entities/char_2009.gif) MO vesicles becomes nicely manifested by solvation dynamics in the lipid vesicles.
MO vesicles becomes nicely manifested by solvation dynamics in the lipid vesicles.
![[r with combining macron]](https://www.rsc.org/images/entities/i_char_0072_0304.gif) (Å)
(Å)![[r with combining macron]](https://www.rsc.org/images/entities/i_char_0072_0304.gif) is mean donor–acceptor distance, hw is half-width of the probability distribution for donor–acceptor distances (Fig. 8), χ2 is the parameter corresponding to fitting of fluorescence decay of donor in presence of acceptor by eqn (4).
is mean donor–acceptor distance, hw is half-width of the probability distribution for donor–acceptor distances (Fig. 8), χ2 is the parameter corresponding to fitting of fluorescence decay of donor in presence of acceptor by eqn (4).
 . The magnitude of G, the grating factor of the emission monochromator of the TCSPC system, was found using a long tail matching technique. Time-resolved emission spectra (TRES) were constructed following the methods described earlier37 for determination of time dependent fluorescence Stokes shifts. In brief, the normalized spectral shift correlation function or the solvent correlation function, C(t), is defined as
 , where ν(0), ν(t), and ν(∞) are the emission peak maximum (in cm−1) at time 0, t, and ∞ respectively.
 . Here τDA and τD are fluorescence lifetimes of the donor in presence and absence of acceptor. The Förster distance (R0) was calculated using overlap integral of the emission spectrum of donor and absorption spectrum of acceptor following the equation
  in Å, where κ2 is a factor describing the relative orientation in space of the transition dipoles of the donor and the acceptor. The magnitude of κ2 is assumed to be 0.66 for random orientation of the donor and the acceptor. The refractive index (η) of the biological medium is assumed to be 1.4. J(λ) is overlap integral of emission of donor and absorption of acceptor and calculated by
  , where FD(λ) dλ is the fluorescence emission of the donor in the wavelength region λ to λ + dλ. ε(λ) is extinction coefficient (in M−1 cm−1) of acceptor. Distance distribution function P(r) was evaluated using the procedure described in the previous literature.8,38–41 The decay transient of the donor in absence of acceptor were fitted using nonlinear least-squares fitting procedure to the following function
 . The distance distribution function P(r) in the fluorescence transients of donor in presence of acceptor in the systems under study is estimated using the SCIENTIST from Micromath (Saint Louis, MO, USA) software in the following way.
 and the intensity decay of the sample considering P(r) is given by
 , where
 ![[r with combining macron]](https://www.rsc.org/images/entities/i_char_0072_0304.gif) is the mean of the Gaussian with a standard deviation of σ and r is the donor acceptor distance. The distance distribution are described by full width at half maxima (FWHM) = 2.354σ.
is the mean of the Gaussian with a standard deviation of σ and r is the donor acceptor distance. The distance distribution are described by full width at half maxima (FWHM) = 2.354σ.


