 Open Access Article
Inhibition of Cd accumulation in grains of wheat and rice under rotation mode using composite silicate amendment
Yang Liac,
Xuefeng Liang *b,
Qingqing Huangb,
Yingming Xu*b and
Fang Yangc
aCollege of Earth Science, Chengdu University of Technology, Chengdu 610059, PR China
bKey Laboratory of Original Environmental Pollution Control of MARA, Agro-Environmental Protection Institute, Ministry of Agriculture and Rural Affairs, No. 31, Fukang Road, Nankai District, Tianjin 300191, PR China. E-mail: liangxuefeng@caas.cn; xuyingming@aepi.org.cn; Fax: +86-22-23618060; Tel: +86-22-23618061
cChengdu Hydrogeological and Engineering Geological Team, Chengdu 610072, PR China
First published on 1st November 2019
Abstract
The accumulation of heavy metals in soils and crops jeopardizes human health, and thus remedying soil and ensuring food safety have attracted wide concern. In this study, composite silicate was employed as an amendment to inhibit cadmium (Cd) accumulation in the grains of wheat and rice in an upland/paddy rotation mode in field-scale remediation. The composite silicate amendment (CSA) at a dosage of 0.2–0.8% decreased the Cd concentration in wheat grains in the first growing season of upland mode by 7.5–58.3% compared with CK, and decreased the Cd concentration in brown rice by 38.7–58.1% in the second season of paddy mode. The minimum values satisfy the Chinese National and International Standards. The results confirmed the inhibitory effect of CSA on the accumulation of Cd in crop grains. CSA increased the soil pH obviously and enhanced the sorption of Cd on soil particles by 14.6–56.2%, and declined the DTPA- and HCl-extractable Cd concentrations in the soil by 16.2–49.5% and 23.8–75.6%, respectively. Furthermore, CSA decreased the exchangeable Cd fraction by 21.5–41.6% in the sequential extraction. The immobilization effect was retained in both growing seasons in terms of Cd concentration in the crop grains and extractable Cd concentration in the soil. CSA had a negligible effect on the normal growth of wheat and rice and the available Zn and Cu concentration in the soil, indicating its environmental friendliness. Considering its low cost and abundant reserves, CSA can be recommended as an immobilization amendment for Cd-polluted paddy soil in wheat/rice rotation mode.
1. Introduction
Heavy metal contamination of soil environments is becoming an increasingly serious issue in China. A nationwide survey carried out by the Ministry of Environmental Protection and the Ministry of Land and Resources from 2005 to 2013, revealed that Cd was the most frequently detected heavy metal in soil, and 7% of the investigated sites was contaminated by Cd.1 Plants growing in Cd-polluted soil uptake Cd through their roots and it is accumulated in different organs, and as a result, the normal growth and productivity of crops will be adversely impacted.2 The accumulation of Cd in crop grains jeopardizes food safety. Excess Cd in the human body accumulates in the liver and kidneys, and other organs and tissues, which produces adverse health effects in human beings.3 Therefore, developing strategies to decrease the Cd concentration in crops is a public health priority. Because of the high risks and potential adverse effects of Cd contamination, efforts must be made to develop remediation methods for Cd-polluted soils.Various remediation techniques have been developed to clean up or restore heavy metal polluted soils, such as soil replacement, chemical washing, chemical stabilization/immobilization, electrokinetic extraction, and phytoremediation.4,5 Chemical immobilization is better for farmland that undertakes crop planting tasks.6 In situ immobilization reduces the bioavailability of heavy metals but does not remove them from the soil,7,8 which is the most cost-effective and environmentally compatible remediation method.9,10
Currently, the remediation of heavy metal contaminated paddy soil with the aim of reducing the accumulation of heavy metals in rice grain has been reported. For example, palygorskite and sepiolite were recommended for the immobilization of Cd in paddy soil.11 Bentonite significantly decreased the Cd bioavailability in soil and uptake in rice.12 Biochar treatment consistently reduced rice Cd and Pb concentrations over three years.13 Limestone plus sepiolite and hydroxyhistidine plus zeolite were effective in reducing the heavy metal bioavailability and accumulation in rice grown in multi-metal contaminated soils.14 In addition to double-season rice mode, there are large area farmlands with rice/upland crop ration mode, which are important agricultural production systems in China and other South Asian countries. However, few studies have focused on the remediation in rotation mode, such as rape/rice rotation15 and wheat/rice rotation.16 Rice/wheat rotation, the most important agricultural production system worldwide, accounts for approximately 10.5 million hectares of fields in China and approximately 13.5 million hectares of the Indo-Gangetic Plains.17 Rice and wheat are grown annually in sequence and the soil conditions required for rice growth differ from that required for the growth of upland crops. Soil is puddled before rice transplantation and flooding is maintained to create anaerobic conditions for rice growth. In contrast, upland crops are grown in well-drained soil under tillage and aerobic conditions.18 It has been reported that hydrated lime and organic fertilizer,19 farmyard manure alone and combined with limestone, lignite and biochar are effective in reducing Cd uptake by plants under rice/wheat rotation.20
In China, the Chengdu Plain is a typical agricultural area with the wheat/rice rotation mode. However, in this area, soil Cd has become a serious pollutant due to its geological origin and historical phosphate mining.21 Furthermore, it was reported that the Cd concentrations in the grains of wheat and rice in some areas of the Chengdu Plain exceeded the national limitation.22,23 Thus, to reduce the environmental risk of Cd in soil and ensure the food safety of crops in water/upland rotation in the Chengdu Plain, remediation of Cd-contaminated soils under wheat/rice rotation is urgently needed.
In the present study, composite silicate was selected as an amendment with the advantages of low cost and abundant reserves. This study attempted to comparatively evaluate the potential remediation effects of CSA for Cd in soil, and the inhibitory effects of CSA on Cd accumulation in the grains of rice and wheat under rotation mode.
2. Materials and methods
2.1 Characterization of CSA
Composite silicate as the soil amendment in the current research was collected from a silicate deposit in Sichuan Province of China. The major elements in CSA were characterized by X-ray fluorescence spectroscopy (XRF). The powder (2–4 g) was fused with anhydrous lithium tetraborate to generate homogeneous pellets and analyzed with an X-ray fluorescence spectrometer (Axioms, PANalytical, United Kingdom). The results were calibrated with standard materials. X-ray diffraction (XRD) was employed to analyze the minerals in CSA. XRD patterns were recorded on an X-ray diffractometer (D/Max-2500, Rigaku, Japan) using Cu Kα radiation at a scanning speed of 1.5° min−1 in the 2θ range of 8° to 50° operated at 40 kV and 100 mA.242.2 Field experiment
An in situ field-scale experiment was conducted in Mianzhu, located in Sichuan Province, China. Areas of the agricultural fields were polluted with Cd as a result of long-term industrial pollution and high background value. The soil was derived from river alluvium and the basic properties of the selected field are listed in Table 1. The total Cd concentration was 0.68 mg kg−1 and the pH value of the soil was 5.5.The application dosages of composite silicate were 0.2% (T1, weight ratio), 0.4% (T2), 0.6% (T3), 0.8% (T4), and no amendments (CK). All treatments were applied in triplicate, and the replicates were arranged in a randomized block design. There were 15 plots with a total area of about 450 m2. Composite silicate powder was mixed into the topsoil on September 2017, 30 days before the seeding of winter wheat. The wheat was harvested in May 2018. Meanwhile, rice was planted in June and harvested in September.
The mode plants and cultivars in the current research were Mianmai-41 of wheat (Triticum aestivum L.) and Mianyou-5323 of rice (Oryza sativa L. subsp. hsien Ting). The average growth periods of Mianmai-41 and Mianyou-5323 were 189 and 146 days, respectively.
2.3 Plant and soil analyses
The whole plants of wheat and rice were collected when harvested and separated into grains and roots for further analysis. The fresh roots were washed with deionized water and dried at 105 °C to a constant weight and the mature grains were naturally dried. Dry roots and grains were powdered and passed through a 200 mesh nylon sieve. A 0.50 g sample of husked wheat or rice powder was digested using 10 mL mixed solution of HNO3–HClO4 (4![[thin space (1/6-em)]](https://www.rsc.org/images/entities/char_2009.gif) :
:![[thin space (1/6-em)]](https://www.rsc.org/images/entities/char_2009.gif) 1, v/v).
1, v/v).
Soil samples were taken from the surface layer, and each sample was obtained by mixing at least five sub-samples from one sampling site after harvest. pH was measured at a soil: water ratio of 1![[thin space (1/6-em)]](https://www.rsc.org/images/entities/char_2009.gif) :
:![[thin space (1/6-em)]](https://www.rsc.org/images/entities/char_2009.gif) 2.5 (w/v) using a pH meter (PB-10, Sartorius, Germany).
2.5 (w/v) using a pH meter (PB-10, Sartorius, Germany).
The total Cd concentration in the soil was determined by digestion with HNO3–HF–HClO4 (2![[thin space (1/6-em)]](https://www.rsc.org/images/entities/char_2009.gif) :
:![[thin space (1/6-em)]](https://www.rsc.org/images/entities/char_2009.gif) 2
2![[thin space (1/6-em)]](https://www.rsc.org/images/entities/char_2009.gif) :
:![[thin space (1/6-em)]](https://www.rsc.org/images/entities/char_2009.gif) 1, v
1, v![[thin space (1/6-em)]](https://www.rsc.org/images/entities/char_2009.gif) :
:![[thin space (1/6-em)]](https://www.rsc.org/images/entities/char_2009.gif) v
v![[thin space (1/6-em)]](https://www.rsc.org/images/entities/char_2009.gif) :
:![[thin space (1/6-em)]](https://www.rsc.org/images/entities/char_2009.gif) v) solution at a 1
v) solution at a 1![[thin space (1/6-em)]](https://www.rsc.org/images/entities/char_2009.gif) :
:![[thin space (1/6-em)]](https://www.rsc.org/images/entities/char_2009.gif) 25 soil/liquid ratio in Teflon beakers on a hot plate (ED54, LabTech, China). The available Cd concentrations in the soil were determined via diethylenetriaminepentaacetic acid (DTPA) extraction and HCl extraction, and denoted as DTPA-Cd, HCl-Cd, respectively. Soil weighing 5.0 g was dispersed in 25 mL of DTPA extraction solution (0.005 mol L−1 DTPA, 0.01 mol L−1 CaCl2 and 0.1 mol L−1 triethanolamine adjusted to pH 7.3 with HCl) and shaken for 120 min.25 The available Cd concentration in the soil was determined via chemical extraction using 0.025 mol L−1 HCl solution.26 Changes in the Cd fractions in the soil were analyzed via sequential extraction.27 Five Cd fractions in the soil were extracted as follows: exchangeable fraction (Exc-Cd) by 1.0 mol L−1 MgCl2 (pH = 7.0), carbonate-bound (CB-Cd) fraction by 1.0 mol L−1 NaOAc–HOAc (pH = 5.0), Fe and Mn oxide-bound fraction (OX-Cd) by NH2OH·HCl in 25% HOAc, organic matter-bound fraction (OM-Cd) by 30% H2O2 at pH = 2 with HNO3, and residual fraction (Res-Cd) by HF–HClO4.
25 soil/liquid ratio in Teflon beakers on a hot plate (ED54, LabTech, China). The available Cd concentrations in the soil were determined via diethylenetriaminepentaacetic acid (DTPA) extraction and HCl extraction, and denoted as DTPA-Cd, HCl-Cd, respectively. Soil weighing 5.0 g was dispersed in 25 mL of DTPA extraction solution (0.005 mol L−1 DTPA, 0.01 mol L−1 CaCl2 and 0.1 mol L−1 triethanolamine adjusted to pH 7.3 with HCl) and shaken for 120 min.25 The available Cd concentration in the soil was determined via chemical extraction using 0.025 mol L−1 HCl solution.26 Changes in the Cd fractions in the soil were analyzed via sequential extraction.27 Five Cd fractions in the soil were extracted as follows: exchangeable fraction (Exc-Cd) by 1.0 mol L−1 MgCl2 (pH = 7.0), carbonate-bound (CB-Cd) fraction by 1.0 mol L−1 NaOAc–HOAc (pH = 5.0), Fe and Mn oxide-bound fraction (OX-Cd) by NH2OH·HCl in 25% HOAc, organic matter-bound fraction (OM-Cd) by 30% H2O2 at pH = 2 with HNO3, and residual fraction (Res-Cd) by HF–HClO4.
The Cd concentrations in the digested solutions were determined using an inductively coupled plasma mass spectrometer (iCAP Q, Thermo Scientific, USA). Quality assurance procedures and precautions were implemented to ensure the accuracy and precision of the results. Duplicate and blank samples were included in each batch of analyses for quality control purposes.
2.4 Sorption experiment
The maximum sorption amounts of Cd2+ on composite silicate and the soils containing composite silicate were determined by batch sorption experiment. Soil samples (0.05 g) were placed in 100 mL centrifugal tubes, and then filled with 50 mL of Cd(NO3)2 solution with different Cd2+ concentrations (0–50 mg L−1). The tubes were then shaken at 25 °C for 120 min in a thermostatic water bath shaker (ZWY110X30, Zhicheng, China). Thereafter, the suspensions were centrifuged at a speed of 13![[thin space (1/6-em)]](https://www.rsc.org/images/entities/char_2009.gif) 000 rpm. The equilibrium Cd2+ concentrations in the supernatant were determined using an atomic absorption spectrometer (ZEEnit 700P, Analytik Jena, Germany). The sorption amount was calculated from the decrease of Cd2+ concentration in the aqueous solution.
000 rpm. The equilibrium Cd2+ concentrations in the supernatant were determined using an atomic absorption spectrometer (ZEEnit 700P, Analytik Jena, Germany). The sorption amount was calculated from the decrease of Cd2+ concentration in the aqueous solution.
2.5 Statistical analyses
All data were statistically analyzed using one-way ANOVA at a significance level of p < 0.05. Single-step multiple comparisons of means were performed via Tukey's post hoc test. Pearson correlation coefficients among various parameters were performed with SPSS 21.0.3. Results and discussion
3.1 Characterization of CSA
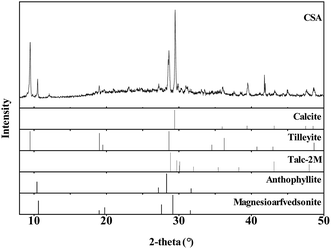
CSA was obtained from the local county and used without purification. The XRF result indicated the main components were SiO2: 35.41% (weight ratio), CaO: 37.79%, and MgO: 22.13%. As shown in Fig. 1, in the XRD pattern of CSA, several minerals were detected using Jade XRD pattern processing (v6.2, Material Data, Inc.),28 including calcite (CaCO3, JCPDS No. 05-0586), tilleyite (Ca5Si2O7(CO3)2, JCPDS No. 24-0184), talc-2M (Mg3Si4O10(OH)2, JCPDS No. 13-0558), anthophyllite (Mg7Si8O22(OH)2, JCPDS No. 16-0401) and magnesioarfvedsonite (Na3(Mg, Fe)5Si8O22(OH)2, JCPDS No. 42-1369). Specifically, the amendment was a mixture of some clay minerals. As phyllosilicates without a layer charge, talc and anthophyllite have excellent chemical stability and adsorption capacity for heavy metals. Calcite as an alternative low-cost adsorbent for metal cations in aqueous solution has application potential for the immobilization of heavy metals in soils.293.2 Inhibitory effects of CSA on Cd accumulation in wheat and rice
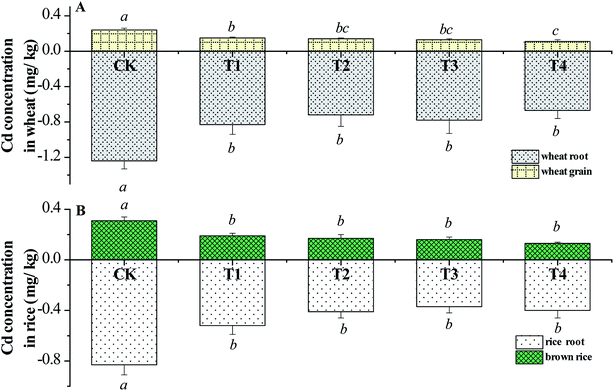
As illustrated in Fig. 2, CSA simultaneously reduced the Cd accumulation in the roots and grains of the winter wheat in the upland mode. The Cd concentration in the wheat grain in the CK group was 0.23 mg kg−1, which exceeded the limitation (0.1 mg kg−1) of the Chinese National Standard GB 2762-2017 and the maximum level of Cd concentration in wheat grains (0.2 mg kg−1) in GC 0654 of the Codex Alimentarius International Food Standard 193-1995 proposed by the Food and Agriculture Organization of the United Nations (FAO). Compared with CK, the Cd concentrations in the wheat grains in the CSA groups declined by 37.5–58.3%. CSA even at a dosage of 0.2% in T1 reduced the Cd concentration in the wheat grain to less than the limitation set by the FAO. Meanwhile, the Cd concentrations in the wheat roots declined significantly after the addition of CSA. In general, the Cd in roots originates from the absorption of Cd from soil pore water or solution through the root. The decreased Cd concentration in the root confirmed the remediation effect of CSA in the Cd-polluted soil.Fig. 1B shows the Cd concentrations in the grains and roots of the hybrid rice in the second growing season of paddy mode. The Cd concentration in the brown rice in CK was 0.31 mg kg−1, which exceeded the maximum permitted level of GB 2762-2017. CSA reduced the Cd concentration in the brown rice by 38.7–58.1% compared with CK, and the minimum value was 0.12 mg kg−1 with the T4 treatment. There were no statistical differences among the CSA treatments.
The grains are the aerial parts of wheat and rice, and thus the Cd concentration in grains is the most important index for the safety of agricultural products, which is the critical factor determining the success of remediation amendments. Thus, the significant reduction in the Cd concentrations in the wheat grain and brown rice in the field-scale experiment demonstrates the remarkable remediation effects of CSA.
The decreased concentrations of Cd in the grains of the wheat and rice are related to the transfer factor (TF) from the root to the husked grain. TF is defined as the ratio of Cd concentration in the wheat or rice grain to that in the root. For example, the TFs for wheat and rice in CK were 0.194 and 0.212, but they declined to 0.164–0.171 and 0.126–0.165 after the addition of CSA, respectively. The results reveal that CSA could inhibit the translocation of Cd from the root to the crop grain by means of a physiological response.
3.3 Effects of CSA on pH and sorption capacity of the soil
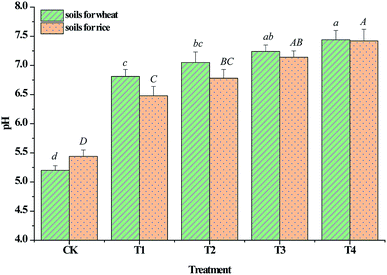
The soil in the current field was slightly acidic, which increases the stress of heavy metals on crops. As shown in Fig. 3, the pH values increased to different extents (p < 0.05) following the application of CSA, indicating that CSA could effectively improve the acidic soil. The calcite in CSA played an important role in increasing the soil pH. Increasing the soil pH can reduce the solubility and mobility of soil heavy metals because elevated pH increases the negative charge of soil colloids, and results in the increased sorption of positively charged metal cations.30,31 In addition, an increase in soil pH can lead to the formation of metal carbonate precipitate complexes, thus decreasing metal availability.The point of zero charge and initial pH values of the soil in CK were 5.75 and 5.50, respectively, indicating that the surfaces of the soil particles were positive. The pH of the soil following silicate treatment was higher than 5.75, indicating that the surface of the soil particles was negatively charged, which is beneficial for the sorption of metal cations. Cd has been shown to be less available in neutral or calcareous than in acidic soils.32
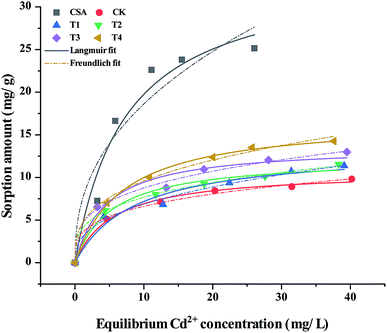
The sorption capacity can be represented by sorption isotherms,33 and the sorption isotherms of Cd2+ on CSA and the soils are shown in Fig. 4. The Langmuir isotherm and Freundlich isotherms were employed to fit the sorption data.34
(i) Langmuir isotherm
 | (1) |
(ii) Freundlich isotherm35
| Qe = KFCne | (2) |
According to the fitting parameters listed in Table 2, the Langmuir isotherm fits the sorption of Cd2+ on the CSA and soil samples better than the Freundlich isotherm. The maximum sorption amounts for CSA and the soil in CK calculated using the Langmuir isotherm were 34.27 mg g−1 and 10.78 mg g−1, respectively. The experimentally obtained maximum sorption amounts are in excellent agreement with the calculated values. CSA caused the maximum sorption amount to increase by 14.6–56.2% in comparison with CK. The increased maximum sorption amount of Cd on the soil particles revealed that the soil amended by CSA had a greater affinity for Cd2+ than CK, which is beneficial for inhibiting the release of Cd from soil particles to soil solutions. Thus, the significant difference and extra sorption amount indicate that the sorption of Cd2+ on the soil was enhanced. In the T4 treatment with the CSA dosage of 0.8%, the maximum sorption amount calculated was 16.84 mg g−1. If the CSA added to the soil itself adsorbed Cd2+ in aqueous solution directly without any other effects, the maximum sorption amount of the soil containing 0.8% CSA can be calculated as follows:
| 10.78 × 99.2% + 34.27 × 0.8% = 10.97 mg g−1 |
| Isotherms | CSA | Soil samples | |||||
|---|---|---|---|---|---|---|---|
| CK | T1 | T2 | T3 | T4 | |||
| Langmuir isotherm | Qm | 34.27 ± 4.66 | 10.78 ± 0.36 | 12.34 ± 1.38 | 12.36 ± 0.74 | 13.72 ± 1.02 | 16.84 ± 0.34 |
| KL | 0.14 ± 0.05 | 0.18 ± 0.02 | 0.12 ± 0.04 | 0.19 ± 0.05 | 0.22 ± 0.07 | 0.15 ± 0.01 | |
| R2 | 0.95368 | 0.99382 | 0.96145 | 0.98101 | 0.98515 | 0.99827 | |
| Freundlich isotherm | KF | 7.20 ± 0.25 | 3.43 ± 0.23 | 2.96 ± 0.35 | 3.92 ± 0.14 | 4.48 ± 0.41 | 4.51 ± 0.42 |
| N | 0.41 ± 0.11 | 0.28 ± 0.02 | 0.37 ± 0.03 | 0.29 ± 0.01 | 0.29 ± 0.03 | 0.33 ± 0.03 | |
| R2 | 0.90141 | 0.99058 | 0.98942 | 0.99062 | 0.98122 | 0.99282 | |
Accordingly, the calculated value was slightly more than 10.78 mg g−1 but much less than 16.84 mg g−1. This result indicates that the sorption or fixation of Cd contaminant on the soil particles was enhanced. A similar trend was reported in the soil amended with biochar, which had a significant increase in the maximum sorption amount for Cd2+.36
3.4 Effects of CSA on extractable Cd concentrations in the soil
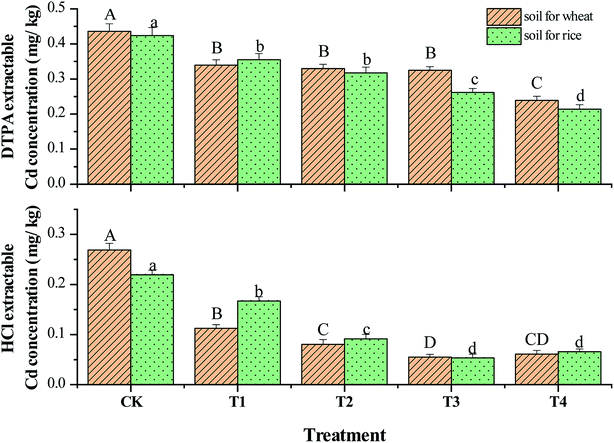
Mutual transformation of different fractions of heavy metals in soils is an important process for heavy metals immobilization, and the available fractions are usually transformed to less available phases by the amendments. The recognition of chemical fractions of heavy metals in soil can qualitatively distinguish their phytoavailability. As shown in Fig. 5, for the soil planting winter wheat in the first growing season, DTPA-Cd and HCl-Cd were 0.45 and 0.25 mg kg−1, which were about 70% and 40% of the total Cd amounts, indicating high environmental ecological risk, respectively. Compared with CK, DTPA-Cd and HCl-Cd in the soil after the addition of CSA gradually declined by 22.4–45.2% and 58.2–79.6%, respectively.For the soil planting hybrid rice in the second growing season, there were no obvious changes in HCl-Cd in CK compared with that in the first growing season. The data indicates that it was difficult to reduce the available Cd concentrations in the soil via accumulation in normal crops in a short period. In the second growing season, there was no additional CSA or other amendments, but the remediation effect of CSA added in the first growing season remained. Compared with CK in the current growing season, DTPA-Cd and HCl-Cd decreased by 16.2–49.5% and 23.8–75.6%, respectively. Overall, the absolute values of HCl-Cd in the second growing season of the hybrid rice, were similar to that in the first growing season of the winter wheat, indicating that there were no substantial changes in the bioavailability of Cd in the sequential crops. The significant reduction in DTPA-Cd and HCl-Cd in the soil was the best evidence for the immobilization effect on Cd pollutant in the soil under rotation mode.
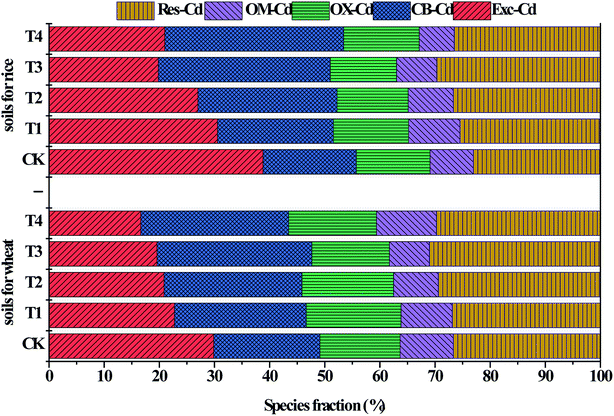
The sequential extraction results are shown in Fig. 6. The exchangeable, carbonated bound and residual fraction were dominant. The exchangeable fraction could be absorbed directly by plants, and thus the greater the exchangeable fraction, the more active the soil heavy metal is and the higher its bio-availability.37 In the end of the first growing season of winter wheat, Exc-Cd decreased by 21.5–41.6% and CB-Cd increased by 23.1–46.2% compared with CK.
3.5 Pearson correlation analyses and remediation mechanisms
Pearson correlations between the relative parameters, such as the Cd concentration in the crop grain, pH, DTPA-Cd and HCl-Cd, and Tessier extraction concentrations were calculated and listed in Table 3. For both the wheat and rice, the Cd concentrations in their grains and roots were negatively correlated with pH and positively correlated with HCl-Cd (p < 0.05) and Exc-Cd fraction of soil. The HCl-Cd content was negatively correlated with CB-Cd and positively correlated with Exc-Cd. Exc-Cd was negatively correlated with pH and CB-Cd of the soil. CB-Cd was positively correlated with pH and negatively correlated with HCl-Cd. There were strong relationships between HCl-Cd and Exc-Cd in the soil and Cd concentrations in the grains of the wheat and rice.38–40 Thus, the results demonstrate that these indicators can effectively estimate the grain Cd concentration. DTPA is a stronger extracting reagent than 0.025 mol L−1 HCl and 1.0 mol L−1 MgCl2 (pH = 7), and thus could extract more Cd from the contaminated soils.| Index | B | C | D | E | F | G | H | I | J | K | ||
|---|---|---|---|---|---|---|---|---|---|---|---|---|
| a **Correlation is significant at the 0.01 level (two-tailed). *Correlation is significant at the 0.05 level (two-tailed). Wheat-Cd, rice-Cd, root-Cd: Cd concentration in wheat grains, brown rice and their corresponding roots, respectively. | ||||||||||||
| Wheat | A | Wheat-Cd | 0.98** | −0.66 | −0.99** | 0.94* | 0.98** | 0.99** | −0.93* | −0.61 | 0.099 | −0.69 |
| B | Rice-Cd | −0.63 | −0.98** | 0.91* | 0.97** | 0.96** | −0.89* | −0.63 | 0.12 | −0.67 | ||
| C | Grain yield | 0.70 | −0.38 | −0.76 | −0.57 | 0.76 | 0.11 | −0.70 | 0.53 | |||
| D | pH | −0.91* | −0.99** | −0.98** | 0.95* | 0.57 | −0.17 | 0.72 | ||||
| E | DTPA-Cd | 0.87 | 0.97** | −0.82 | −0.72 | −0.23 | −0.60 | |||||
| F | HCl–Cd | 0.96* | −0.96** | −0.49 | 0.27 | −0.76 | ||||||
| G | Exc-Cd | −0.93* | −0.59 | 0.013 | −0.73 | |||||||
| H | CB-Cd | 0.29 | −0.34 | 0.87 | ||||||||
| I | OX-Cd | 0.55 | −0.10 | |||||||||
| J | OM-Cd | −0.46 | ||||||||||
| K | Res-Cd | 1.00 | ||||||||||
| Rice | A | Wheat-Cd | 0.97** | 0.34 | −0.98** | 0.91* | 0.89* | 0.91* | −0.88* | −0.45 | 0.23 | −0.82 |
| B | Rice-Cd | 0.30 | −0.95* | 0.86 | 0.93* | 0.92* | −0.86 | −0.32 | 0.16 | −0.91* | ||
| C | Grain yield | −0.46 | 0.56 | 0.43 | 0.60 | −0.59 | 0.24 | 0.53 | −0.50 | |||
| D | pH | −0.97** | −0.95* | −0.96** | 0.95* | 0.29 | −0.39 | 0.86 | ||||
| E | DTPA-Cd | 0.93* | 0.96* | −0.99** | −0.16 | 0.60 | −0.80 | |||||
| F | HCl–Cd | 0.97** | −0.96** | −0.015 | 0.48 | −0.92* | ||||||
| G | Exc-Cd | −0.98** | −0.070 | 0.47 | −0.93* | |||||||
| H | CB-Cd | 0.029 | −0.62 | 0.86 | ||||||||
| I | OX-Cd | 0.47 | −0.040 | |||||||||
| J | OM-Cd | −0.25 | ||||||||||
| K | Res-Cd | 1.00 | ||||||||||
The inhibitory effect due to Cd accumulation in the crops was the result of Cd immobilization in the soil. The immobilization effect of CSA observed in the present study involved two processes. The first is the direct effect on exchangeable Cd by sorption on the surface of CSA or precipitation with carbonate impurities to form hydroxide or carbonate precipitate,41 where pristine silicate as an alkaline mineral can immobilize Cd in soil by precipitation in the form of cadmium hydroxide or carbonate. The second is an indirect process involving the regulation of the soil environment to enhance the sorption of Cd on soil colloids,42 including clay minerals and Fe–Mn oxides, and inhibit the release of Cd in soil particles to soil solutions.
3.6 Environmental friendliness of CSA
CSA was added to the soil as the immobilization amendment, and thus its impacts on the normal growth of crops and the soil environmental quality should be considered. Thus, in the present study, its environmental friendliness with respect to the plants and soil was investigated.Because of the effect of heavy metal stress on plant growth, the grain yields of both wheat and rice in the local area were affected to varying degrees. As listed in Table 4, the grain yields of the wheat and rice were within the range of 5472–5514 kg hm−2 and 7598–7646 kg hm−2, respectively. There were no statistical differences among the treatments (p > 0.05). These results indicate that CSA had no adverse impact on crop yield. CSA contained no excess nutrients or heavy metals, and therefore had no notable effect on the grain yields.
| Plant | Grain yield (kg hm−2) | ||||
|---|---|---|---|---|---|
| CK | T1 | T2 | T3 | T4 | |
| a The same letter next to the numbers indicated there were no significant differences among the CK and treatments (p > 0.05). | |||||
| Wheat | 5472 ± 73a | 5504 ± 61a | 5497 ± 54a | 5514 ± 69a | 5487 ± 45a |
| Rice | 7646 ± 101a | 7639 ± 82a | 7677 ± 110a | 7598 ± 75a | 7613 ± 80a |
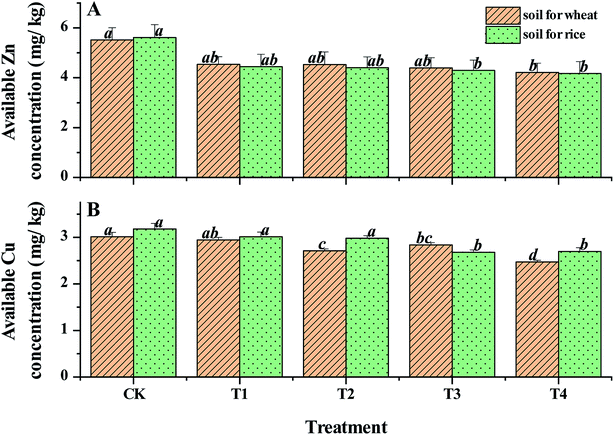
As shown in Fig. 7, the dynamics of available Zn and Cu concentrations in the soil tended to decrease slightly. Following the application of CSA, the reduced contents were 5.8–11.6% and 6.0–22.1% for available Zn and Cu concentrations, respectively. For Cu and Zn, their availabilities in the soil decreases with an increase in pH if pH > 7 in general.43 Thus, the slight decrease was impacted by the pH-regulating effect of CSA. The available Zn concentration in CK was 18 mg kg−1, meanwhile the range reported in acid paddy soil in China is trace to 19.9 mg kg.44 Thus, the data indicates that the soil here had abundant Zn available for plant growth. Despite the slight decline in the available Zn concentration following the addition of CSA, the values were much higher than the critical concentration of available Zn in the soil required for normal plant growth (1.5 mg kg−1).45 The available Cu in CK was approximately 5.0 mg kg−1 and the minimum value with the CSA treatment was 3.5 mg kg−1, which is much higher than 0.2 mg kg−1, the critical concentration of available Cu in the soil required for normal plant growth. In terms of trace element accumulation in crop grains, as illustrated in Table 5, the total concentrations of Cu and Zn in the grains of the rice and wheat with the CSA treatments were similar to that in their own CK. There was no statistical difference among all the treatments (p > 0.05). Thus, the dynamics of available Cu and Zn concentrations in the soil and the grains of wheat and rice indicate that the adverse inhibitory effects of CSA on available Cu and Zn concentrations are negligible.
| Treatment | Rice grain (mg kg−1) | Wheat grain (mg kg−1) | ||
|---|---|---|---|---|
| Cu | Zn | Cu | Zn | |
| a The same letter next to the numbers indicated there were no significant differences among the CK and treatments (p > 0.05). | ||||
| CK | 5.89 ± 0.10a | 37.73 ± 1.73a | 3.84 ± 0.25a | 32.66 ± 2.67a |
| T1 | 5.76 ± 0.20a | 37.58 ± 1.48a | 4.01 ± 0.10a | 32.72 ± 2.11a |
| T2 | 5.88 ± 0.16a | 37.76 ± 0.99a | 3.85 ± 0.08a | 32.18 ± 4.10a |
| T3 | 5.75 ± 0.33a | 37.45 ± 1.57a | 3.79 ± 0.25a | 31.75 ± 2.49a |
| T4 | 5.88 ± 0.37a | 40.37 ± 0.95a | 3.91 ± 0.28a | 31.57 ± 0.95a |
3.7 Economic cost analysis
Economic cost of the amendment is an important index that has a remarkable impact on its utilization in a large area. An excellent amendment should have a significant remediation effect and must be cost-effective. The conventional amendments and their general recommended dosages and cost are listed in Table 6. It was found that CSA in the current research was cheaper than many other amendments. The application dosages and the prices of sepiolite and palygorskite are higher than that of CSA. Biochar has excellent performance, but its strict preparation conditions and special parent materials limit its large-area utilization. Compared with biochar and hydroxyapatite, the abundant reserve of natural composite silicate without any other chemical purification or modification is a great advantage. Although the application cost of CSA is more expensive than limestone, considering its environmental friendliness and the ecological benefit of its remediation practice, its price is affordable in the local area.| No | Amendment | Dosage (weight ratio) | Pricea ($ per ton) | Cost ($ per hm2) | Reference |
|---|---|---|---|---|---|
| a Estimated by market survey in 2019, including the cost of materials without the cost of transport or operation. | |||||
| 1 | Limestone | 0.1% | 140 | 420 | 16 |
| 2 | Sepiolite | 0.5% | 300 | 4500 | 11 and 46 |
| 3 | Palygorskite | 0.5% | 400 | 6000 | 11 |
| 4 | Hydroxyapatite | 0.1% | 11![[thin space (1/6-em)]](https://www.rsc.org/images/entities/char_2009.gif) 000 000 |
33![[thin space (1/6-em)]](https://www.rsc.org/images/entities/char_2009.gif) 000 000 |
19 |
| 5 | Biochar | 0.1% | 450 | 1350 | 16 |
| 6 | Composite silicate | 0.2% | 100 | 600 | This study |
4. Conclusion
In situ field-scale remediation under wheat/rice rotation mode confirmed the inhibitory effect of CSA on the accumulation of Cd in crop grains. CSA increased the soil pH and enhanced the sorption of Cd on soil particles, resulted in the reduction in DTPA- and HCl-extractable Cd concentrations in the soil, and meanwhile decreased the exchangeable Cd fraction in the soil. The immobilization effect was retained in both growing seasons. CSA had negligible effects on the normal growth of wheat and rice, and the available Zn and Cu concentrations in the soil, indicating its environmental friendliness. Considering its low cost and abundant reserves, CSA can be recommended as an immobilization amendment for Cd-polluted soil in wheat/rice rotation mode.Conflicts of interest
The authors declare no conflict of interest.Acknowledgements
The current research was supported by the National Key Research and Development Program of China (2018YFD0800705), the Funds for China Agriculture Research System and Tianjin Natural Science Foundation Key Project (17JCZDJC34200).References
- F.-J. Zhao, Y. Ma, Y.-G. Zhu, Z. Tang and S. P. McGrath, Environ. Sci. Technol., 2015, 49, 750–759 CrossRef CAS.
- B. M. Shanmugaraj, A. Malla and S. Ramalingam, in Cadmium Toxicity and Tolerance in Plants, ed. M.Hasanuzzaman, M. N. V.Prasad and M.Fujita, Academic Press, 2019, pp. 1–17, DOI:10.1016/B978-0-12-814864-8.00001-2.
- A. Fristachi and H. Choudhury, in International Encyclopedia of Public Health (Second Edition), ed. S. R.Quah, Academic Press, Oxford, 2017, pp. 316–319, DOI:10.1016/B978-0-12-803678-5.00043-6.
- L. Liu, W. Li, W. Song and M. Guo, Sci. Total Environ., 2018, 633, 206–219 CrossRef CAS.
- Y. Gong, D. Zhao and Q. Wang, Water Res., 2018, 147, 440–460 CrossRef CAS PubMed.
- N. Bolan, A. Kunhikrishnan, R. Thangarajan, J. Kumpiene, J. Park, T. Makino, M. B. Kirkham and K. Scheckel, J. Hazard. Mater., 2014, 266, 141–166 CrossRef CAS.
- A. Mahar, P. Wang, R. Li and Z. Zhang, Pedosphere, 2015, 25, 555–568 CrossRef CAS.
- W. L. Qun, L. U. O. Lei, M. Yi-bing, W. E. I. Dong-pu and H. U. A. Luo, Chin. J. Appl. Ecol., 2009, 20, 1214–1222 Search PubMed.
- Y. F. Zhou and R. J. Haynes, Crit. Rev. Environ. Sci. Technol., 2010, 40, 909–977 CrossRef CAS.
- T. K. Udeigwe, P. N. Eze, J. M. Teboh and M. H. Stietiya, Environ. Int., 2011, 37, 258–267 CrossRef CAS.
- X. Liang, J. Han, Y. Xu, Y. Sun, L. Wang and X. Tan, Geoderma, 2014, 235–236, 9–18 CrossRef CAS.
- Y. Sun, Y. Li, Y. Xu, X. Liang and L. Wang, Appl. Clay Sci., 2015, 105–106, 200–206 CrossRef CAS.
- R. Bian, S. Joseph, L. Cui, G. Pan, L. Li, X. Liu, A. Zhang, H. Rutlidge, S. Wong, C. Chia, C. Marjo, B. Gong, P. Munroe and S. Donne, J. Hazard. Mater., 2014, 272, 121–128 CrossRef CAS.
- H. Zhou, X. Zhou, M. Zeng, B.-H. Liao, L. Liu, W.-T. Yang, Y.-M. Wu, Q.-Y. Qiu and Y.-J. Wang, Ecotoxicol. Environ. Saf., 2014, 101, 226–232 CrossRef CAS PubMed.
- H. Ran, Z. Guo, L. Shi, W. Feng, X. Xiao, C. Peng and Q. Xue, Environ. Sci. Pollut. Res., 2019, 26, 14128–14136 CrossRef CAS.
- M. Z. u. Rehman, H. Khalid, F. Akmal, S. Ali, M. Rizwan, M. F. Qayyum, M. Iqbal, M. U. Khalid and M. Azhar, Environ. Pollut., 2017, 227, 560–568 CrossRef.
- X.-b. Du, C. Chen, L.-j. Luo, L.-p. Xia, K. Liu, Y.-h. Chen and X.-q. Yu, Rice Sci., 2014, 21, 210–216 CrossRef.
- W. Zhou, T.-F. Lv, Y. Chen, A. P. Westby and W.-J. Ren, Sci. World J., 2014, 2014, 856352 Search PubMed.
- F. Guo, C. Ding, Z. Zhou, G. Huang and X. Wang, Ecotoxicol. Environ. Saf., 2018, 148, 303–310 CrossRef CAS.
- M. Z. u. Rehman, M. Rizwan, H. Khalid, S. Ali, A. Naeem, B. Yousaf, G. Liu, M. Sabir and M. Farooq, Chemosphere, 2018, 199, 468–476 CrossRef.
- Q. Li, C. Wang, T. Dai, W. Shi, X. Zhang, Y. Xiao, W. Song, B. Li and Y. Wang, Sci. Rep., 2017, 7, 7115 CrossRef.
- Q. Xu, C. Wang, S. Li, B. Li, Q. Li, G. Chen, W. Chen and F. Wang, Environ. Sci. Pollut. Res., 2017, 24, 11319–11330 CrossRef CAS.
- Y.-E. Chen, J.-M. Cui, J.-C. Yang, Z.-W. Zhang, M. Yuan, C. Song, H. Yang, H.-M. Liu, C.-Q. Wang, H.-Y. Zhang, X.-Y. Zeng and S. Yuan, J. Hazard. Mater., 2015, 296, 201–209 CrossRef CAS PubMed.
- S. Wu, H. He, X. Li, C. Yang, G. Zeng, B. Wu, S. He and L. Lu, Chem. Eng. J., 2018, 341, 126–136 CrossRef CAS.
- M. C. Amacher, in Methods of Soil Analysis Part 3 Chemical Methods, ed. J. M.Bartels, Soil Science Society of America, Inc. American Society of Agronomy, Inc., Madison, Wisconsin, 1996, pp. 739–768 Search PubMed.
- T. Ibaraki, K. Kadoshige and M. Murakami, Soil Sci. Plant Nutr., 2005, 51, 893–898 CrossRef CAS.
- A. Tessier, P. G. C. Campbell and M. Bisson, Anal. Chem., 1979, 51, 844–851 CrossRef CAS.
- Y. Lin, S. Wu, C. Yang, M. Chen and X. Li, Appl. Catal., B, 2019, 245, 71–86 CrossRef CAS.
- G. Rangel-Porras, J. B. Garcia-Magno and M. P. Gonzalez-Munoz, Desalination, 2010, 262, 1–10 CrossRef CAS.
- N. S. Bolan, R. Naidu, J. K. Syers and R. W. Tillman, Adv. Agron., 1999, 67, 87–140 CAS.
- N. S. Bolan, D. C. Adriano and D. Curtin, Adv. Agron., 2003, 78, 215–272 CAS.
- H. Hattori, K. Kuniyasu, K. Chiba and M. Chino, Soil Sci. Plant Nutr., 2006, 52, 89–94 CrossRef CAS.
- Y. Huang, C. Yang, Z. Sun, G. Zeng and H. He, RSC Adv., 2015, 5, 11475–11484 RSC.
- M. Wu, H. Liu, J. Guo and C. Yang, Appl. Microbiol. Biotechnol., 2018, 102, 9831–9842 CrossRef CAS.
- H. J. He, Z. H. Xiang, X. J. Chen, H. Chen, H. Huang, M. Wen and C. P. Yang, Int. J. Environ. Sci. Technol., 2018, 15, 1491–1500 CrossRef CAS.
- S. Bashir, M. S. Rizwan, A. Salam, Q. Fu, J. Zhu, M. Shaaban and H. Hu, Bull. Environ. Contam. Toxicol., 2018, 100, 727–732 CrossRef CAS.
- Q. Zhu, J. Wu, L. Wang, G. Yang and X. Zhang, Water, Air, Soil Pollut., 2015, 226, 1–10 CAS.
- J. Li and Y. Xu, Chemosphere, 2015, 122, 131–136 CrossRef CAS PubMed.
- P. Kosolsaksakul, J. G. Farmer, I. W. Oliver and M. C. Graham, Environ. Pollut., 2014, 187, 153–161 CrossRef CAS PubMed.
- Q. Li, Y. Chen, H. Fu, Z. Cui, L. Shi, L. Wang and Z. Liu, J. Hazard. Mater., 2012, 227–228, 148–154 CrossRef CAS.
- Y. Xu, X. Liang, L. Wang, Y. Sun and Q. Huang, in Twenty Years of Research and Development on Soil Pollution and Remediation in China, ed. Y.Luo and C.Tu, Springer Singapore, Singapore, 2018, pp. 399–411, DOI:10.1007/978-981-10-6029-8_22.
- X. Liang, N. Li, L. He, Y. Xu, Q. Huang, Z. Xie and F. Yang, Sci. Total Environ., 2019, 688, 818–826 CrossRef CAS.
- J. M. McGrath, J. Spargo and C. J. Penn, in Encyclopedia of Agriculture and Food Systems, ed. N. K.Van Alfen, Academic Press, Oxford, 2014, pp. 166–184, DOI:10.1016/B978-0-444-52512-3.00249-7.
- Z. Cao and J. Zhou, Soil Quality of China, Science Press, Beijing, 2008 Search PubMed.
- C. W. Wood, J. F. Adams and B. H. Wood, in Encyclopedia of Soils in the Environment, ed. D.Hillel, Elsevier, Oxford, 2005, pp. 387–393, DOI:10.1016/B0-12-348530-4/00278-2.
- X. Yin, Y. Xu, R. Huang, Q. Huang, Z. Xie, Y. Cai and X. Liang, Environ. Sci.: Processes Impacts, 2017, 19, 1563–1570 RSC.
| This journal is © The Royal Society of Chemistry 2019 |

