DOI:
10.1039/C9RA06929A
(Paper)
RSC Adv., 2019,
9, 42459-42469
Three dimensional coupled reaction–diffusion modeling of calcium and inositol 1,4,5-trisphosphate dynamics in cardiomyocytes
Received
31st August 2019
, Accepted 28th November 2019
First published on 20th December 2019
Abstract
Nanoparticles have shown great promise in improving cancer treatment efficacy by changing the intracellular calcium level through activation of intracellular mechanisms. One of the mechanisms of the killing of the cancerous cell by a nanoparticle is through elevation of the intracellular calcium level. Evidence accumulated over the past decade indicates a pivotal role for the IP3 receptor mediated Ca2+ release in the regulation of the cytosolic and the nuclear Ca2+ signals. There have been various studies done suggesting the role of IP3 receptors (IP3R) and IP3 production and degradation in cardiomyocytes. In the present work, we have proposed a three-dimensional unsteady-state mathematical model to describe the mechanism of cardiomyocytes which focuses on evaluation of various parameters that affect these coupled dynamics and elevate the cytosolic calcium concentration which can be helpful to search for novel therapies to cure these malignancies by targeting the complex calcium signaling process in cardiomyocytes. Our study suggests that there are other factors involved in this signaling which can increase the calcium level, which can help in finding treatment for cancer. The cytosolic calcium level may be controlled by IP3 signaling, leak, source influx of calcium (σ) and maximum production of IP3 (VP). We believe that the proposed model suggests new insight into finding treatment for cancer in cardiomyocytes through elevation of the cytosolic Ca2+ concentration by various parameters like leak, σ, VP and especially by other complex cell signaling dynamics, namely IP3 dynamics.
1 Introduction
The emerging field of nanomedicine aims to diagnose and treat various diseases with nanostructures. The design of such nanosystems for imaging and therapeutic applications requires a thorough understanding of the interactions between nanoparticles and biological systems. Cancer represents the 2nd largest cause of death in the United States, and one out of eight women is estimated to develop invasive breast cancer in her lifetime.1 Nanoparticles have shown great promise in improving cancer treatment efficacy while reducing toxicity and treatment side effects.2 Different nanoparticles can change the intracellular calcium level through activation of intracellular machinery. In cancer therapy, nanoparticles are used to kill the malignant cells.3 One of the mechanisms of the killing of the cancerous cell by nanoparticles is through elevation of the intracellular calcium level. One study reported that after 48 hours of nanoparticle treatment, the cytosolic calcium level increases 1.8 times in adenocarcinoma cells.4
Also, some attempts have been reported in the literature, for other different cells like hepatocytes,5 neurons,6 astrocytes,7,8 fibroblasts,9 pancreatic acinar cells10 and oocytes,11 to model the calcium diffusion and regulation in the presence of time-dependent influx for the smooth muscle cell to study the magnitude, and spatial and temporal characteristics of calcium transients in restricted diffusion spaces between the plasma membrane and intracellular organelles.12 Gregory D. Smith et al.13 proposed a simple numerical model of calcium spark formation and detection in cardiomyocytes. According to their model, the elementary events of excitation–contraction coupling in the heart muscle are Ca2+ sparks, which arise from one or more ryanodine receptors in the endoplasmic reticulum (ER). Backx et al.14 constructed a model of propagating calcium-induced calcium release mediated by calcium diffusion in cardiomyocytes. The model was used to evaluate whether propagation of calcium transients and the range of propagation velocities observed experimentally (0.05–15 mm s−1) could be predicted. Y. Hamam et al.15 proposed a model for calcium dynamics in cardiomyocytes. After the identification of the endoplasmic reticulum parameters, the SERCA pump and ryanodine channels activities, they made a comparison between experimental and calculated responses.
Consequently, it is of great interest to determine the mechanisms involved in these dynamics. In many cell types, these signaling processes depend on the inositol 1,4,5-trisphosphate (IP3) signaling.16–20 For both atrial and ventricular cells, a role for the cytosolic IP3 has been reported for the modulation of the cytosolic Ca2+ transients in a variety of animal models.21–25 IP3R channel activity, with type-2 IP3Rs as the most prevalent isoform in cardiomyocytes, depends on IP3 concentration and Ca2+ concentration.23,26,27 By the hydrolysis of phosphatidylinositol 4,5-bisphosphate (PIP2) by phospholipase C (PLC), two distinct second messengers, diacylglycerol and IP3, are produced that diffuse through the cytoplasm and bind to and open IP3 receptors (IP3Rs) on the endoplasmic reticulum (ER) membrane, leading to the release of Ca2+ from the ER. The released Ca2+ is then sent back into the ER by pumps like the SERCA pump in cardiomyocytes.28 Recently, Li et al.29 also uncaged IP3 in cell cytoplasm from 2.1 to 5.3 nm AuNP-coated liposomes to activate cell signaling. They encapsulated IP3 in the liposome complex which then binds with the IP3R. The binding event then causes Ca2+ release from the endoplasmic reticulum (ER) into the cytosol. Also, El-Sayed et al.30 demonstrated that AuNPs with integrin-targeting properties could inhibit cancer cell migration through affecting cytoskeletal proteins. Furthermore, the highest increase in the calcium signal was observed, and the calcium response was likely due to the inflow of Ca2+ as well as intracellular signaling via the IP3 pathway.
For these reasons, although experimental methods17,31,32 are being developed to measure [IP3] directly, the question of the underlying oscillatory mechanism often remains unresolved. Many investigations on calcium dynamics in cardiomyocytes have not included the role of ryanodine receptors (RyR) and IP3R.33–36 whereas there are various investigations to understand the role of ryanodine receptors (RyR) in cardiomyocytes37–39 but the importance of IP3 dynamics in Ca2+ in the cardiomyocyte is less explored. But there are pieces of literature40–42 that suggest the impact of IP3 signaling on Ca2+ signaling in other cells. Also, there are few works showing the important role of IP3 signaling in Ca2+ signaling in the cardiomyocyte.26,28,43 Motivated by the above and the intriguing possibility of cancer treatment with nanoparticles by elevation of the cytosolic calcium level, we have explored another biological factor inside the cardiomyocyte, IP3, which strongly influences the cytosolic calcium ions concentrations. Earlier we have developed one44–46 and two dimensional models47 for the coupled dynamics but to make the study more realistic and have better insights into various processes involved in calcium regulation it is necessary to develop a model in a three-dimensional cylindrical-shaped cardiomyocyte. In this paper, an attempt has been made in this direction to propose a three-dimensional model to study spatiotemporal calcium and IP3 distribution in cardiomyocytes involving various parameters and their role in controlling calcium concentration in the cytosol for the better understanding and exploring of various treatments for cancer.
2 Methods
2.1 The mathematical model
Experimental investigations have been reported in the literature for interdependent Ca2+ and IP3 dynamics in oocytes.48 Also, few works have been reported for interdependent Ca2+ and IP3 dynamics in cardiomyocytes. However, elementary Ca2+ release events and functional properties of IP3 are available in the literature.17,49,50
Apart from this, the reaction–diffusion equations for Ca2+ and IP3 dynamics are available in the literature.48 Thus, the functional properties of IP3 release and the dynamics with Ca2+ in cardiomyocytes can be used as a basis to develop a coupled model of Ca2+ and IP3 dynamics in a cell. This coupling will be based on the relationships between the processes of Ca2+ and IP3 dynamics in a cell. In the present study the relationship between reaction–diffusion of Ca2+, as well as IP3, has been explored to propose a coupled model for Ca2+ and IP3 in cardiomyocytes (Fig. 1).
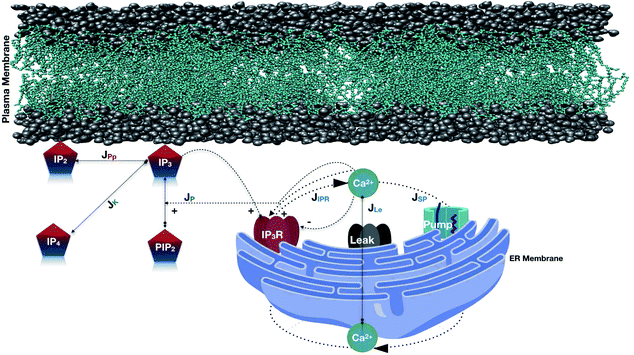 |
| | Fig. 1 Schematic representation of the Ca2+ and IP3 dynamics model. In this model, various fluxes are involved such as Ca2+ is released from the ER via the IP3 receptor (JIPR), and reuptake occurs via SERCA ATPase pumps (JSP). A leak is used to maintain basal Ca2+ levels (JLe). IP3 is produced at the ER membrane via Ca2+-dependent activation of PLC (JP). The terms responsible for IP3 degradation are these two fluxes JPp (Phosphatase) and JK (Kinase). | |
The model incorporates three mechanisms for Ca2+ release and reuptake: the IP3 receptor/Ca2+ channel, a small leak to maintain resting Ca2+ levels and SERCA pumps. The reaction–diffusion equations for Ca2+ and IP3 are given by,48
| |
 | (1) |
| |
 | (2) |
| |
 | (3) |
where [Ca
2+]
C and [Ca
2+]
E are the concentrations of Ca
2+ in the cytosol and ER, respectively.
DC and
DE are the diffusion coefficients of Ca
2+ in the cytosol and ER. Also,
DI is the diffusion coefficient of IP
3.
JP,
JK and
JPp are fluxes of IP
3 production, Kinase and Phosphatase respectively in terms of total cell volume. All the flux terms are given by,
48| | |
JIPR = VIPRd3e3([Ca2+]E − [Ca2+]C),
| (4) |
| | |
JLe = VLe([Ca2+]E − [Ca2+]C),
| (5) |
| |
 | (6) |
In this formulation, FC and FE are the volume fractions, relative to total cell volume, of the cytosol and ER, respectively (with FC + FE = 1), so the fluxes are also in terms of total cell volume. IP3 receptor dynamics are treated using the Li–Rinzel simplification of the eight-state De Young–Keizer model. In both formulations, the IP3 receptor is comprised of four identical subunits, each of which can bind an IP3, an activating Ca2+, and an inactivating Ca2+, with the conducting state corresponding to any three of the subunits having IP3 and activating Ca2+ bound.48
| |
 | (7) |
| |
 | (8) |
and
| |
 | (9) |
The Ca2+ dependence of the 3-kinase degradation pathway is described by a Hill function,48
| |
 | (10) |
The Li–Rinzel model, however, utilizes time scale arguments to eliminate two of the three binding reactions, replacing them with the equilibrium equation,48
| |
 | (11) |
The variable e represents the fraction of subunits not yet inactivated by Ca2+ given by,48
| |
 | (12) |
where
| |
 | (13) |
is the equilibrium value, and
τ is the inactivation time scale. The analysis of the complete model is not possible using basic phase plane techniques. However, in a whole-cell model (
i.e. where the diffusion terms are eliminated), the [Ca
2+]
E equation can be eliminated using the conservation relation for the total cellular Ca
2+ concentration,
48| | |
[Ca2+]T = FC[Ca2+]C + FE[Ca2+]E.
| (14) |
The e nullcline is the surface e = e∞, which after substitution is,48
| |
 | (15) |
a relatively simple, monotonically decreasing function of Ca
2+. This allows the model to be reduced to the three variables [Ca
2+]
C, [IP
3], and
e.
48 This model has been employed to perform a numerical study of Ca
2+ and IP
3 dynamics in cardiomyocytes. The calcium diffusion and IP
3 diffusion in cardiomyocytes for a three-dimensional unsteady-state case can be rewritten as,
| |
 | (16) |
| |
 | (17) |
The height of the cardiomyocyte is 100 μm and width of the cytosol of the cardiomyocyte is 8 μm. Therefore, it is assumed that 0 ≤ r ≤ 4 μm, 0 ≤ θ ≤ 2π, 0 ≤ z ≤ 4, where z = 0 means 0 μm, z = 1 means 25 μm, z = 2 means 50 μm, z = 3 means 75 μm and z = 4 means 100 μm. The three-dimensional finite difference discretization of the cardiomyocyte is shown in Fig. 2.
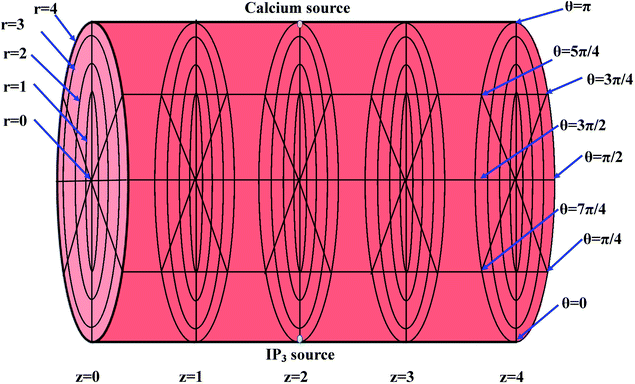 |
| | Fig. 2 Discretization of the cytosol of the cell, where the yellow point at the top (at r = 4, θ = π, z = 2) and the green point at the bottom (at r = 4, θ = 0, z = 2) denote the point sources of Ca2+ and IP3, respectively. | |
The initial and boundary conditions governing the Ca2+ and IP3 diffusion processes are given by,34,51,52
(i) Initial condition
| | |
[Ca2+]Cr,θ,z,t=0 = 0.1 μM,
| (18) |
| | |
[IP3]r,θ,z,t=0 = 0.16 μM.
| (19) |
(ii) Boundary condition
Point sources of calcium and IP3 are assumed at r = 4, θ = π, z = 2 and r = 4, θ = 0, z = 2 respectively. Thus, the boundary conditions at t > 0 are given below. Here, the source influx can be expressed as
| |
 | (20) |
here, an influx of free Ca
2+ is taken at the rate
σ by Faraday’s law,
13| |
 | (21) |
where
I is the amplitude of the element of Ca
2+ release,
F is Faraday’s constant and
z is the valence of the Ca
2+ ion.
| |
 | (22) |
At the rest of the boundary points there is no flux, thus the boundary conditions are as follows,
| |
 | (23) |
| |
 | (24) |
| |
 | (25) |
| |
 | (26) |
It is assumed that at the boundary far away from the source of calcium, the calcium concentration is maintained at background calcium concentration which can be written as follows,
| |
 | (27) |
| |
 | (28) |
It is assumed that at the boundary far away from the source of IP3, the IP3 concentration is maintained at background concentration which can be written as follows,
| |
 | (29) |
| |
 | (30) |
2.2 Solution
The model eqn (16)–(30) are solved numerically using the Forward Time Centered Space Approach. Using the Forward Time Centered Space Approach, the above eqn (16) and (17) take the following form,| |
 | (31) |
| |
 | (32) |
where ‘c’ denotes the calcium concentration in the cytosol, ‘cE’ denotes calcium concentration in the ER and ‘d’ denotes the IP3 concentration, which are a function of (r, θ, z, t). Here, ‘h’ represents the radial step, ‘l’ represents the angular step, ‘q’ represents the height step and ‘k’ represents the time step. The indexes of the radial, angular and height are ‘i’, ‘j’ and ‘m’ respectively and n represent the index of time. Va is the maximum rate constant at low Ca2+ (3-kinase), Vb is the maximum rate constant at high Ca2+ (3-kinase) and VPp is the maximum rate constant (phosphatase). The initial and boundary conditions governing the Ca2+ and IP3 diffusion processes are given by eqn (18)–(29), which are rewritten as given below.
(i) Initial condition
At time t = 0 s, we have following initial conditions,
(ii) Boundary condition
The above equation is not valid at (r = 0, 0 ≤ θ ≤ 2π, 0 ≤ z ≤ 4), near the sources (r = 4, θ = 0, π, z = 2) and far away from the sources (r = 4, θ = 0, π, 1 ≤ z ≤ 3) and (0 ≤ r ≤ 4, 0 ≤ θ ≤ 2π, z = 0, 4); therefore the approximation at these nodes at t > 0 is given by,
| |
 | (35) |
| | |
d4,0,2n = 0.1882(kn)6 + 1.3121(kn)5 + 3.5391(kn)4 + 4.5312(kn)3 + 2.5893(kn)2 + 0.3648(kn) + 0.1691 ≤ 3
| (36) |
| |
 | (37) |
| |
 | (38) |
| |
 | (39) |
| |
 | (40) |
| | |
c4,0,mn = 0.1 μM; at (1 ≤ z ≤ 3),
| (41) |
| | |
ci,j,mn = 0.1 μM; at (0 ≤ r ≤ 4, 0 ≤ θ ≤ 2π, z = {0,4}),
| (42) |
| | |
d4,π,mn = 0.16 μM at (1 ≤ z ≤ 3),
| (43) |
| | |
di,j,mn = 0.16 μM; at (0 ≤ r ≤ 4, 0 ≤ θ ≤ 2π, z = {0,4}),
| (44) |
The resulting system (31)–(44) provides simultaneous algebraic equations for unknown node concentrations ci,j,mn and di,j,mn. The Gaussian elimination method has been employed to solve the resulting equations.
3 Results and discussion
To start with, we analyzed the cardiomyocyte parameters for biological systems to confirm the accuracy of the computational analysis used in this study. Table 1 presents these properties in a cardiomyocyte. The parameters used for the computation of numerical results are given in Table 1.48 To facilitate our discussion, all calculations utilize the standard model parameters in Table 1, except where noted otherwise.
Table 1 The experimental values of different parameters in the cardiac cardiomyocyte
| Parameter |
Value48 |
Parameter |
Value48 |
| VIPR |
8.5 s−1 |
Va |
0.001 μM s−1 |
| VLe |
0.01 s−1 |
Vb |
0.005 μM s−1 |
| VSP |
0.65 μM s−1 |
VPp |
0.02 μM s−1 |
| KIP3 |
0.15 μM |
VP |
0.075 μM s−1 |
| KP |
0.4 μM |
FC |
0.83 |
| KAt |
0.8 μM |
λ |
30 |
| KSP |
0.4 μM |
DC |
16 μm2 s−1 |
| KIn |
1.9 μM |
DI |
283 μm2 s−1 |
Firstly, we discuss the variations of IP3 and Ca2+ in the cardiomyocyte as a function of angle, radius, height and time (spatio-temporal variation).
Oscillatory [Ca2+] dynamics
The variation of the calcium profile in the cardiomyocyte with respect to time is shown in Fig. 3. Here, the Ca2+ source is assumed to be situated at r = 4, θ = π and z = 2 (i.e. 50 μm). With the increase in time, the calcium concentration near the source also increases and reaches the maximum concentration at r = 4 μm. Also, the maximum calcium concentration was found at r = 4, θ = π, z = 2 because the source of Ca2+ is located there. Moreover, a small variation occurs but visible away from r = 4 and symmetric variations in both sides around θ = π. Also, the calcium concentration increases with increasing time and at time t = 0 it satisfied the boundary condition because there is no variation of calcium concentration at the source of calcium.
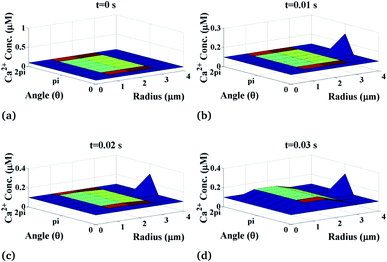 |
| | Fig. 3 Ca2+ concentration profile in the cardiomyocyte at different points of time (t = 0 s to 0.03 s with intervals of 0.01 s) in the cytosol at the z = 2 (i.e. 50 μm) position. | |
Initially, the calcium concentration is high at the source because the source channel opens and starts releasing Ca2+, the calcium concentration in the cytosol increases very fast and then it decreases due to the removal of calcium out of the cell by the pump as we go away from the source. Away from the source, the calcium concentration reaches its steady-state of 0.1 μM to maintain the Ca2+ concentration in the cytosol.
Oscillatory [IP3] dynamics
Now, we discuss the variation of calcium concentration which depends on the spatiotemporal function. Fig. 4 shows the radial and angular distributions of Ca2+ concentration in the cytosol of the cardiomyocyte at different positions z and z is varying from 0 to 4 with intervals of 1 in the cell at fixed time t = 0.03 s. It can be observed from the graph that the Ca2+ concentration near the position of the source of Ca2+, i.e. at z = 2, is lower than that at z = 1 and z = 3 as the released Ca2+ from the source moves through the cytosol to bind with many proteins like calmodulin to activate various cellular responses like contraction, metabolism etc. Also, we can see that the calcium concentrations are very small at the end of the cytosol of the cardiomyocyte (z = 0 and z = 4) because it is away from the calcium source. Moreover, z = 2 means at the calcium source, and the Ca2+ concentration is high near the source, and away from the source, its concentration decreases very slowly as shown in Fig. 4 at z = 2. According to this, calcium signaling shows a wave-like nature at the source of calcium. Also, away from the source, i.e. at z = 0 and z = 4, IP3 concentration again decreases gradually to attain its background concentration 0.1 μM.
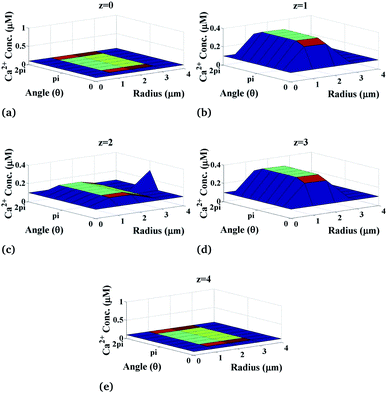 |
| | Fig. 4 Ca2+ concentration profile in the cardiomyocyte at different positions z in the cytosol at t = 0.03 s. | |
Furthermore, we have systematically investigated the effect of the IP3 source on each parameter of the spatiotemporal function and its variation is shown in Fig. 5. Fig. 5 shows the changes in IP3 concentration at different time intervals. Here, the IP3 source is assumed to be situated at r = 4, θ = 0 and z = 2 (i.e. 50 μm). With the increase in time, the IP3 concentration near the source also increases. As the time increases, the concentration of IP3 increases and shows an oscillatory type of behaviour in the radial as well as the angular directions. Also, the maximum variation is seen at time t = 0.03 s at the source of IP3 and oscillations start from θ = π where maximum values are reached either side of the source (θ = 0, 2π). Initially, the IP3 concentration decreases as we go away from the source then it increases to match the boundary concentration i.e. 3 μM.
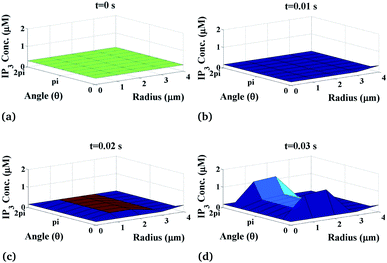 |
| | Fig. 5 IP3 concentration profile in the cardiomyocyte at different points of time in the cytosol at the z = 2 (i.e. 50 μm) position. | |
Moreover, the variation of IP3 concentration which is the function of the radial as well as the angular part also depends on the height of the cylindrical cardiomyocyte. Fig. 6 shows the radial and angular distributions of the IP3 concentration in the cytosol of the cardiomyocyte at different positions z in the cell at t = 0.03 s. It can be observed from the graph that the IP3 concentration near the position of the source of IP3, i.e. at z = 2, is lower than that at z = 1 and z = 3 as the released IP3 from the source moves through the cytosol to bind with the calcium release channel IP3R in order to allow the channel to open so that free Ca2+ ions can be released from the endoplasmic reticulum to balance the Ca2+ concentration in the cytosol and also to allow various cellular responses. Also, away from the source, i.e. at z = 0 and z = 4, the IP3 concentration again decreases gradually to attain its background concentration of 0.16 μM.
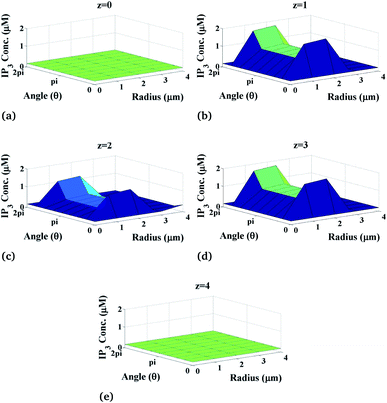 |
| | Fig. 6 IP3 concentration profile in the cardiomyocyte at different positions z in the cytosol at t = 0.03 s. | |
Influence of [IP3] in the [Ca2+] dynamics
Now, we discuss the ratio of Ca2+ and IP3 concentrations as a function of time at fixed height z = 2 and different radial and angular positions as shown in Fig. 7. As time increases at a different position in the cytosol, the ratio of c = [Ca2+] and d = [IP3] decreases very fast, after that it starts increasing and after a small decrease, it increases again and attains a steady-state. The maximum variation is seen at (r = 4, θ = 0, z = 2) which is the location of the source of IP3. Physiologically this behaviour of interdependent Ca2+ and IP3 is justified. At the center of the cytosol, i.e. at z = 2, maximum interdependent dynamics and non-linearity in these signaling patterns are observed which is shown in Fig. 7. This is due to the positioning of the two source channels of Ca2+ and IP3. The source of Ca2+ is located at (r = 4, θ = π, z = 2) and the source of IP3 is located at (r = 4, θ = 0, z = 2) which are just opposite to each other. Initially, d = [IP3] is higher as compared to c = [Ca2+]C due to the initial conditions of both the signals. At time t = 0 s, initial conditions are c0i,j,m = 0.1 μM and d0i,j,m = 0.16 μM. Also, the equation for the source of IP3 increases rapidly with time as compared to the source of Ca2+. Therefore, a rapid decrease in the ratio of c = [Ca2+]C and d = [IP3] is seen in the first few milliseconds. But after that, it is observed that there is a sharp peak in the ratio c/d, after this point of time the ratio c/d starts increasing. At this point of time, the IP3 binds with the IP3 receptor (IP3R), opens the IP3R channel and facilitates the outflow of Ca2+ ions from the ER to the cytosol. As a result, the amount of Ca2+ ions increases in the cytosol. Therefore, the ratio c/d increases. This increase in the cytosolic Ca2+ concentration will help in finding treatment for cancer.4 These released free Ca2+ ions from the ER are not all breaking PIP2 to form IP3 ions, there are many proteins available in the cytosol which bind with the released free Ca2+ ion to stimulate various cell responses. Also, the SERCA pump is present which pumps out the extra free Ca2+ ions from the cytosol to the ER to maintain a balanced amount of free Ca2+ ions inside the cytosol. This binding of free Ca2+ ions with proteins and pumping out process lead to a decrease in the amount of free cytosolic Ca2+ ions as compared to the cytosolic IP3. This is the reason behind the decrease in ratio c/d. Near 0.6 s again the ratio c/d increases and attains an equilibrium state. Physiologically, when the amount of free Ca2+ ions in the cytosol decreases then the leak (Le) located at the ER membrane starts releasing a small amount of Ca2+ ions into the cytosol to maintain the balance and initiate the whole process of intracellular cell signaling cell signaling. It is observed that after 0.6 s, at all the positions equilibrium between c = [Ca2+]C and d = [IP3] is attained.
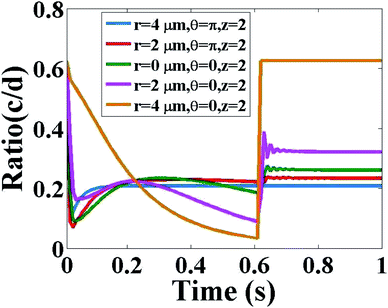 |
| | Fig. 7 Ratio of c = [Ca2+]C and d = [IP3] with respect to time in the cytosol of the cardiomyocyte at different positions (r = 4 μm, θ = π, z = 2), (r = 2 μm, θ = π, z = 2), (r = 0 μm, θ = 0, z = 2), (r = 2 μm, θ = 0, z = 2) and (r = 4 μm, θ = 0, z = 2). | |
Effect of leak on Ca2+ dynamics
Fig. 8 shows the behaviour of the ratio of concentrations as a function of time, and we have as well included the effects of leak. The main function of leak helps to facilitate the flow of Ca2+ ions in the cytosol from the ER which increases the Ca2+ concentration in the cytosol and initiates the complete Ca2+ dynamic processes. The ratio concentration of Ca2+ and IP3 initially decreases with time and then immediately the ratio concentration starts increasing at a certain time, showing an oscillatory pattern and then it goes to a steady-state with the presence of leak. In the case of absent leak, the behaviour is the same but there is a decrease in ratio concentration which is shown in Fig. 8(a)–(e).
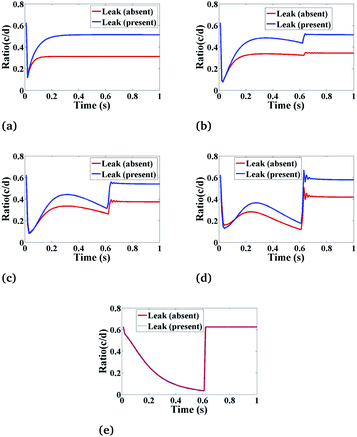 |
| | Fig. 8 The effect of leak (Le) on the ratio of c = [Ca2+]C and d = [IP3] with respect to time at various positions i.e., radius (r) and angle (θ) in the cardiomyocyte. (a) (r = 4 μm, θ = π, z = 2), (b) (r = 2 μm, θ = π, z = 2), (c) (r = 0 μm, θ = 0, z = 2), (d) (r = 2 μm, θ = 0, z = 2) and (e) (r = 4 μm, θ = 0, z = 2) in the cytosol of the cardiomyocyte. | |
Also, we have simulated the other compositions of the radial and angular parts of a cardiomyocyte inside the cytosol which is the function of ratio concentration and time. We found that the behaviour is similar to Fig. 8(a)–(e) but at z = 2 the graph shows a better oscillatory type nature due to the positioning of both the sources is at z = 2. This shows that the cytosolic Ca2+ concentration can be increased by increasing the effect of leak in the cardiomyocyte.
Effect of σ on Ca2+ dynamics
Fig. 9 shows the behaviour of the ratio concentration as a function of time at different amounts of the Ca2+ source influx. The same behaviour is found as in Fig. 8 but if we increase the amount of Ca2+ source influx, the ratio concentrations of Ca2+ and IP3 continuously increase. But in the case of r = 4 μm and θ = 0, there is no change in the ratio as at this position which is far away from the source of calcium it is assumed in the boundary condition that c = [Ca2+]C is fixed i.e. 0.1 μM. Therefore, the effect of an increase in Ca2+ source influx (σ) is negligible here. This analysis also suggests that the cytosolic Ca2+ concentration can be increased by increasing the source influx of calcium (σ) in the cardiomyocyte which will help in finding various treatments for cancer.
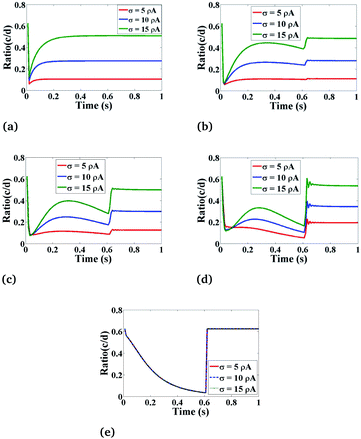 |
| | Fig. 9 The effect of the source influx of Ca2+ (σ) on the ratio of c = [Ca2+]C and d = [IP3] with respect to time at various positions i.e., radius (r) and angle (θ) in the cardiomyocyte. (a) θ = π and r = 4 μm, (b) θ = π and r = 2 μm, (c) θ = 0 and r = 0 μm, (d) θ = 0 and r = 2 μm, (e) θ = 0 and r = 4 μm in the cytosol of the cardiomyocyte. | |
Effect of VP on Ca2+ dynamics
Lastly, we have simulated the ratio concentration with respect to time at various values of the maximum rate of production of IP3 as depicted in Fig. 10. Here, we can see that the variation in ratio concentration initially decreases and then it increases very rapidly showing an oscillatory behaviour after that it goes to a steady-state. But in the case of r = 4 μm and θ = 0, the ratio concentration is the same at different VP because it is a boundary point which is away from the source so it is not affected by the maximum rate production of IP3. From Fig. 9 and 10 we can easily see that the Ca2+ and IP3 concentrations affect each other non-linearly. But Fig. 9 and 10 suggest that the maximum rate of production of IP3 (VP) can affect more as compared to the Ca2+ source influx (σ) because if we are increasing the maximum rate of production of IP3, the ratio peaks are shifted towards higher values. This means that the Ca2+ concentration in the cytosol is much more affected by IP3 parameters which indicates that experimental researchers can explore various ways to kill the cancerous cell by increasing the cytosolic calcium concentration with the help of controlling IP3 dynamics in cardiomyocytes as IP3 signaling plays a very important role in regulation of the calcium concentration in cardiomyocytes.
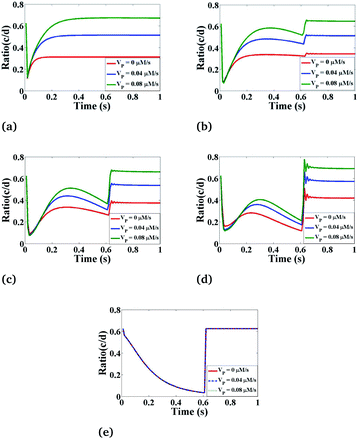 |
| | Fig. 10 The effect of the maximum IP3 production rate (VP) on the ratio of c = [Ca2+]C and d = [IP3] with respect to time at various positions i.e., radius (r) and angle (θ) in the cardiomyocyte. (a) θ = π and r = 4 μm, (b) θ = π and r = 2 μm, (c) θ = 0 and r = 0 μm, (d) θ = 0 and r = 2 μm, (e) θ = 0 and r = 4 μm in the cytosol of the cardiomyocyte. | |
[Ca2+] dynamics in cancer therapy
Dynamics of free intracellular calcium concentration ([Ca2+]) are a crucial control mechanism in many cell types.53 The temporal and spatial information encoded by these dynamic signals controls many processes, including contraction of the cardiac tissues, information processing in the brain, gene expression, release of digestive enzymes by the liver, differentiation and cell movement.54 Imbalanced calcium signaling has been associated with major pathologies, such as cardiovascular disease, stroke and cancer.55,56 The results found here are in good agreement with the experimental as well as theoretical work26,28,43,57 and suggest new insights into finding treatment for cancer in cardiomyocytes through elevation of the cytosolic Ca2+ concentration by various parameters like leak, σ, VP and especially by other complex cell signaling dynamics, namely the IP3 dynamics.
4 Conclusion
As suggested by Chaochu Cui et al.,58 alterations in intracellular Ca2+ signaling for cancer therapy has become an emerging research area. Thus, keeping in mind this ideology, the physiological processes like reaction–diffusion of calcium and IP3 are taken into consideration. One of the mechanisms of the killing of the cancerous cell by nanoparticles is through elevation of the intracellular calcium level. Our study suggests that there are other factors involved in this signaling which can increase the calcium level, which can help in finding a cure for cancer. Thus, a possible treatment for cancer may be studied and the preventive step of increasing the calcium concentration can be studied mathematically. In this piece of research, the effect of IP3 dynamics in the presence of leak, source influx of calcium (σ) and maximum production of IP3 (VP) on the cytosolic calcium dynamics is presented. Several graphs depicting the physiological phenomenon of calcium and IP3 dynamics are plotted here to give a better insight into the interdependence of these signaling processes. In all the ratio graphs (see Fig. 7–10), the nonlinear relationship between these two signaling processes is visible. Here, leak, source influx of calcium (σ) and maximum production of IP3 (VP) are taken into consideration and are found to play important roles in increasing the amount of cytosolic calcium concentration with the help of IP3 signaling that would be helpful in finding treatment for cancer. Hence, the impact of IP3 signaling in calcium diffusion is found to be significant. The cytosolic calcium level may be controlled by IP3 signaling, leak, source influx of calcium (σ) and maximum production of IP3 (VP). The present work focuses on the evaluation of the various parameters that affect these coupled dynamics and elevate the cytosolic calcium concentration which can be helpful to search for novel therapies to treat these malignancies by targeting complex calcium signaling processes in cardiomyocytes.
Conflicts of interest
There are no conflicts to declare.
Acknowledgements
The authors are greatly thankful to the Department of Biotechnology, New Delhi, India for providing the bioinformatics infrastructure facility for carrying out this work.
References
- R. L. Siegel, K. D. Miller and A. Jemal, Ca-Cancer J. Clin., 2015, 65, 5–29 CrossRef PubMed.
- T. A. Brocato, E. N. Coker, P. N. Durfee, Y.-S. Lin, J. Townson, E. F. Wyckoff, V. Cristini, C. J. Brinker and Z. Wang, Sci. Rep., 2018, 8, 7538 CrossRef PubMed.
- A. Onodera, K. Yayama, H. Morosawa, Y. Ishii, Y. Tsutsumi and Y. Kawai, Biochem. Biophys. Rep., 2017, 9, 330–334 Search PubMed.
- J. Wang, X. Fang and W. Liang, ACS Nano, 2012, 6, 5018–5030 CrossRef CAS PubMed.
- T. Höfer, Biophys. J., 1999, 77, 1244–1256 CrossRef.
- J. W. Shuai, S. Nadkarni, P. Jung, A. Cornell-Bell and V. Trinkaus-Randall, Adv. Mol. Cell Biol., 2003, 31, 689–706 Search PubMed.
- B. K. Jha, N. Adlakha and M. N. Mehta, International Journal of Modeling, Simulation, and Scientific Computing, 2013, 4, 1250030 CrossRef.
- S. Tewari and K. R. Pardasani, IAENG Int. J. Appl. Math., 2010, 40, 108–112 Search PubMed.
- M. Kotwani and N. Adlakha, Int. J. Comput. Mater. Sci. Eng., 2017, 6, 1750004 CAS.
- N. Manhas and K. R. Pardasani, J. Bioenerg. Biomembr., 2014, 46, 403–420 CrossRef CAS PubMed.
- P. A. Naik and K. R. Pardasani, Alexandria J. Med., 2016, 52, 43–49 CrossRef.
- N. Singh and N. Adlakha, Mathematical Modelling and Scientific Computing with Applications, Springer Nature Singapore Pte Ltd, 2019, ch. 6 Search PubMed.
- G. D. Smith, J. E. Keizer, M. D. Stern, W. J. Lederer and H. Cheng, Biophys. J., 1998, 75, 15–32 CrossRef CAS.
- P. H. Backx, P. P. De Tombe, J. H. Van Deen, B. J. Mulder and H. E. Ter Keurs, J. Gen. Physiol., 1989, 93, 963–977 CrossRef CAS PubMed.
- Y. Hamam, F. Pecker, F. Rocaries, H. Lorino, C. Pavoine and R. Natowicz, Simul. Pract. Theory, 2000, 8, 3–15 CrossRef.
- M. J. Berridge, Biochim. Biophys. Acta, Mol. Cell Res., 2009, 1793, 933–940 CrossRef CAS.
- A. P. Dawson, Curr. Biol., 1997, 7, R544–R547 CrossRef CAS.
- T. J. Hund, A. P. Ziman, W. J. Lederer and P. J. Mohler, J. Mol. Cell. Cardiol., 2008, 45, 159–161 CrossRef CAS PubMed.
- G. Ullah, P. Jung and K. Machaca, Cell Calcium, 2007, 42, 556–564 CrossRef CAS.
- A. Tanimura, T. Morita, A. Nezu and Y. Tojyo, J. Med. Investig., 2009, 56, 357–361 CrossRef PubMed.
- A. V. Zima and L. A. Blatter, J. Physiol., 2004, 555, 607–615 CrossRef CAS PubMed.
- A. Proven, J. Cell Sci., 2006, 119, 3363–3375 CrossRef CAS PubMed.
- T. L. Domeier, A. V. Zima, J. T. Maxwell, S. Huke, G. A. Mignery and L. A. Blatter, Am. J. Physiol. Heart Circ. Physiol., 2008, 294, H596–H604 CrossRef CAS PubMed.
- D. Harzheim, M. Movassagh, R. S.-Y. Foo, O. Ritter, A. Tashfeen, S. J. Conway, M. D. Bootman and H. L. Roderick, Proc. Natl. Acad. Sci. U. S. A., 2009, 106, 11406–11411 CrossRef CAS PubMed.
- J.-C. Kim, M.-J. Son, K. P. Subedi, Y. Li, J. R. Ahn and S.-H. Woo, Prog. Biophys. Mol. Biol., 2010, 103, 59–70 CrossRef CAS.
- J. Kockskämper, A. V. Zima, H. L. Roderick, B. Pieske, L. A. Blatter and M. D. Bootman, J. Mol. Cell. Cardiol., 2008, 45, 128–147 CrossRef.
- R. H. Michell, C. K. Kirk, L. M. Jones, C. P. Downes and J. A. Creba, Philos. Trans. R. Soc., B, 1981, 296, 123–138 CrossRef CAS.
- F. Hohendanner, A. D. McCulloch, L. A. Blatter and A. P. Michailova, Front. Pharmacol., 2014, 5, 1–15 CAS.
- X. Li, Z. Che, K. Mazhar, T. J. Price and Z. Qin, Adv. Funct. Mater., 2017, 27, 1605778 CrossRef.
- M. R. K. Ali, Y. Wu, Y. Tang, H. Xiao, K. Chen, T. Han, N. Fang, R. Wu and M. A. El-Sayed, Proc. Natl. Acad. Sci. U. S. A., 2017, 114, E5655–E5663 CrossRef CAS.
- B. Ciapa, D. Pesando, M. Wilding and M. Whitaker, Nature, 1994, 368, 875–878 CrossRef CAS.
- G. Dupont and C. Erneux, Cell Calcium, 1997, 22, 321–331 CrossRef CAS.
- A. Hatano, J.-i. Okada, T. Washio, T. Hisada and S. Sugiura, Biophys. J., 2011, 101, 2601–2610 CrossRef CAS PubMed.
- K. B. Pathak and N. Adlakha, J. Med. Imaging Health Inform., 2015, 5, 683–688 CrossRef.
- K. Pathak and N. Adlakha, Adv. Comput. Sci. Technol., 2017, 10, 11–23 Search PubMed.
- K. Pathak and N. Adlakha, Alexandria J. Med., 2016, 52, 261–268 CrossRef.
- D. A. Eisner, J. L. Caldwell, K. Kistamás and A. W. Trafford, Circ. Res., 2017, 121, 181–195 CrossRef CAS PubMed.
- A. Michailova, F. DelPrincipe, M. Egger and E. Niggli, Biophys. J., 2002, 83, 3134–3151 CrossRef CAS PubMed.
- J. S. Sham, L. Cleemann and M. Morad, Proc. Natl. Acad. Sci. U. S. A., 1995, 92, 121–125 CrossRef CAS PubMed.
- C. E. Adkins and C. W. Taylor, Curr. Biol., 1999, 9, 1115–1118 CrossRef CAS.
- G. W. De Young and J. Keizer, Proc. Natl. Acad. Sci. U. S. A., 1992, 89, 9895–9899 CrossRef CAS.
- B. D. Stewart, C. E. Scott, T. P. McCoy, G. Yin, F. Despa, S. Despa and P. M. Kekenes-Huskey, Cell Calcium, 2018, 71, 65–74 CrossRef CAS.
- P. Lipp, M. Laine, S. C. Tovey, K. M. Burrell, M. J. Berridge, W. Li and M. D. Bootman, Curr. Biol., 2000, 10, 939–942 CrossRef CAS.
- N. Singh and N. Adlakha, Netw. Model. Anal. Health Inform. Bioinform., 2019, 8, 18 CrossRef.
- N. Singh and N. Adlakha, J. Anal. Comput., 2019, 1–4 Search PubMed.
- N. Singh and N. Adlakha, Communications in Mathematical Biology and Neuroscience, 2019, 1–17 Search PubMed.
- N. Singh and N. Adlakha, Math. Biol. Bioinf., 2019, 14, 290–305 CrossRef.
- J. Wagner, C. P. Fall, F. Hong, C. E. Sims, N. L. Allbritton, R. A. Fontanilla, I. I. Moraru, L. M. Loew and R. Nuccitelli, Cell Calcium, 2004, 35, 433–447 CrossRef CAS PubMed.
- G. Handy, M. Taheri, J. A. White and A. Borisyuk, J. Comput. Neurosci., 2017, 42, 257–273 CrossRef PubMed.
- A. Harootunian, J. Kao, S. Paranjape and R. Tsien, Science, 1991, 251, 75–78 CrossRef CAS.
- S. A. Brown, F. Morgan, J. Watras and L. M. Loew, Biophys. J., 2008, 95, 1795–1812 CrossRef CAS PubMed.
- C. C. Fink, B. Slepchenko, I. I. Moraru, J. Watras, J. C. Schaff and L. M. Loew, Biophys. J., 2000, 79, 163–183 CrossRef CAS.
- N. L. Allbritton, T. Meyer and L. Stryer, Science, 1992, 258, 1812–1814 CrossRef CAS PubMed.
- M. J. Berridge, J. Physiol., 1997, 499, 291–306 CrossRef CAS PubMed.
- E. Przybytkowski, M. Behrendt, D. Dubois and D. Maysinger, FEBS J., 2009, 276, 6204–6217 CrossRef CAS PubMed.
- N. Rizaner, R. Onkal, S. P. Fraser, A. Pristerá, K. Okuse and M. B. Djamgoz, Eur. Biophys. J., 2016, 45, 735–748 CrossRef CAS.
- M. Cooling, P. Hunter and E. J. Crampin, Biophys. J., 2007, 93, 3421–3433 CrossRef CAS PubMed.
- C. Cui, R. Merritt, L. Fu and Z. Pan, Acta Pharm. Sin. B, 2017, 7, 3–17 CrossRef PubMed.
|
| This journal is © The Royal Society of Chemistry 2019 |
Click here to see how this site uses Cookies. View our privacy policy here.  Open Access Article
 * and
Neeru Adlakha


