DOI:
10.1039/C9RA07005B
(Paper)
RSC Adv., 2019,
9, 36266-36270
Electrostatic attraction-induced aggregation of polymer dots for the facile detection of melamine migration†
Received
2nd September 2019
, Accepted 21st October 2019
First published on 7th November 2019
Abstract
Many polymer dot (Pdot)-based assays involve complicated modifications for target recognition and detection. In this work, the fluorescence quenching of Pdots based on electrostatic attraction-induced aggregation was proposed for the first time. It was demonstrated that the prepared Pdots were negatively charged and electron-rich (e-Pdots), while protonated melamine was positively charged and electron-withdrawing. Therefore, the melamine was likely to electrostatically attract the e-Pdots, resulting in the aggregation of a melamine–e-Pdot complex. Meanwhile, the electron-transfer from the e-Pdots to the protonated melamine resulted in a remarkable fluorescence quenching. Accordingly, an e-Pdot-based assay was developed for the facile detection of melamine in the range of 0.1–100 nM and the limit of detection was as low as 0.03 nM. Furthermore, this method was applied for monitoring the melamine migration from a resin bowl, and the satisfactory results prove the promising applications of these e-Pdots.
Introduction
Polymer dots (Pdots) have emerged as fascinating fluorescence nanoprobes owing to their unique advantages, such as extraordinary fluorescence brightness, excellent photostability, convenient modification, and minimal cytotoxicity.1–3 To date, Pdots have been employed as excellent fluorescent nanoprobes for bioimaging,4,5 for the sensing of diverse targets, including biomolecules,6,7 pollutants,8,9 and so on.10,11 For example, Pdots have been modified with 15-crown-5 moieties on the surface for the selective detection of Pb2+,12 and β-cyclodextrin-modified Pdots have been used for cholesterol detection based on host-guest inclusion.13 To avoid complicated modifications, a simple approach is to directly mix Pdots with functional groups to fabricate special Pdots. Chen et al. integrated pH and oxygen-sensitive dyes into Pdots, achieving the simultaneous imaging of intracellular pH and O2.14 Jia et al. fabricated Pdots containing ternary components in response to nitroaromatics, and concluded that the fluorescence quenching mechanism arises from the electron-transfer from the electron-rich Pdots to the electron-withdrawing nitroaromatics. Although the potential applications of Pdots are attractive, new sensing mechanisms and simplification of the detection operations are still under exploration.
Melamine, a triazine molecule, when unintentionally uptaken by the human body can cause serious kidney stones and badly harm human health.15,16 Research has shown that products made from melamine formaldehyde resin, such as utensils and food contact materials, can easily release melamine under heating conditions, acidic solutions, and organic solvents.17 Therefore, monitoring the migrated melamine in our daily life is significant. Methods like HPLC,18 LC-MS,19 and GC-MS20 are reliable for the detection of melamine, but they suffer from some problems, such as complicated pre-treatment, time-consuming analysis and the requirement of expensive instruments, which make them unsuitable for on-site testing. Therefore, the development of a simple but sensitive method for melamine detection is essential, especially to meet the needs of a rapid and low-cost screening test.
In previous work, our group has researched the fluorescence resonance energy transfer (FRET) between Pdots and some quenching materials (i.e. Au nanoparticles, and metal–organic frameworks), and then further developed several sensitive fluorescent biosensors.21,22 It was found that carboxyl-functionalized Pdots were negatively charged and electron-rich, namely e-Pdots. Since protonated melamine is positively charged and electron-withdrawing, the presence of melamine easily induces the aggregation of Pdots via electrostatic attraction.23 The electron transfer from the e-Pdots to the protonated melamine results in a remarkable fluorescence quenching, which is proportional to the concentration of melamine. Accordingly, an e-Pdot-based assay was developed and used for the sensitive detection of melamine that has migrated from a resin bowl, showing convenient operation and good results.
Experimental
Reagents
Melamine was purchased from Dr. Ehrensorfer (Hamburg, Germany) and dissolved in methanol to prepare a stock solution (1 mM) for further use. Poly (9,9-dioctylfluorenyl-2,7-diyl) (PFO, average MW = 58![[thin space (1/6-em)]](https://www.rsc.org/images/entities/char_2009.gif) 200, polydispersity = 3.7), and poly (styrene-co-maleic anhydride) (PSMA, average MW = 1700, styrene content 68%) were purchased from Sigma-Aldrich (St. Louis, USA). Tetrahydrofuran (THF, anhydrous, 99.9%) and other reagents were all analytical grade, and supplied by Sinopharm Chemical Reagent Co., Ltd (Shanghai, China). Ultrapure water (18.2 MΩ.cm) was prepared with a Milli-Q system (Millipore, Bedford, MA, USA) and used throughout the study.
200, polydispersity = 3.7), and poly (styrene-co-maleic anhydride) (PSMA, average MW = 1700, styrene content 68%) were purchased from Sigma-Aldrich (St. Louis, USA). Tetrahydrofuran (THF, anhydrous, 99.9%) and other reagents were all analytical grade, and supplied by Sinopharm Chemical Reagent Co., Ltd (Shanghai, China). Ultrapure water (18.2 MΩ.cm) was prepared with a Milli-Q system (Millipore, Bedford, MA, USA) and used throughout the study.
Apparatus
An ultrasonic cleaning machine (KQ-700V, Kunshan, China) with an output power of 700 W was used for the synthesis of Pdots. The morphology of the prepared nanoparticles was characterized by atomic force microscopy (AFM, Veeco Instruments, USA). Transmission electron microscopy (TEM) was performed on a Tecnai G2 F20 (FEI Company, USA). Particle sizes and zeta potentials were measured by dynamic light scattering (DLS) on a Nano ZS90 Zetasizer analyzer (Malvern, U.K.). Fourier-transform infrared spectroscopy (FTIR) spectra were recorded using a Magna-IR 750 Fourier-transform infrared spectrometer (Nicolet, USA). UV-Vis spectra were recorded using a Lambda 750 spectrometer (PerkinElmer, USA). Fluorescence measurements were carried out on a Cary Eclipse Fluorescence Spectrometer (Varian, USA).
Preparation of the e-Pdots
The e-Pdots were prepared according to our previous work.21 In brief, PFO and PSMA were respectively dissolved in THF, and then mixed and sonicated to get a homogeneous solution (PFO 50 ppm, PSMA 20 ppm). In a vigorous bath sonicator, the mixture solution was added into ultrapure water, and the remaining THF was removed by evaporation under vacuum. The solution gradually became turbid indicating the formation of e-Pdots, which were further filtrated through a 0.22 μm membrane filter. It is worth noting that the maleic anhydride units of PSMA molecules were easily hydrolyzed in aqueous solution, generating carboxyl groups on the e-Pdots during nanoparticle formation. The e-Pdots were dispersed well in water and stable for a few months without aggregation.
Migration of melamine from a resin bowl
The test samples were prepared by using a simulated solution to extract melamine from a resin bowl.17 Specifically, ultrapure water, acetic acid solution (the acetic acid content was 4%), and ethanol–water solution (the ethanol content was 10%) were selected as the simulating solutions. These simulated solutions (100 mL) were preheated and poured into resin bowls for 4 hours of incubation under 70 °C. Then, the soaking solutions were separately recycled for the subsequent test, or concentrated to 1 mL for LC-MS detection.
Fluorescence measurement
The stock solution of melamine (1 mM) was diluted with ultrapure water. Then, a certain amount of e-Pdots and different concentrations of melamine (or the test samples extracted from a resin bowl) were incubated in PBS buffer (10 mM, pH = 4.0) for 45 min. Afterwards, fluorescence spectra of the final solution were recorded; the excitation wavelength was 380 nm while the fluorescence intensity at 440 nm was used for quantification.
Results and discussion
Characterization of the prepared e-Pdots
The morphology of the e-Pdots was characterized by AFM and TEM (Fig. S1†). Fig. 1A shows that the prepared e-Pdots appeared as spherical dots and were homogeneously dispersed. The size distribution of the particles was measured and the statistics analyzed by DLS, which revealed that the particles possessed an average diameter of 52 nm (Fig. 1B).21 Besides, the chemical groups on the surface of the e-Pdots were investigated by FTIR. As shown in Fig. 1C, the peak around 2850 cm−1 (stretching vibrations of C–H), the peak at 1700 cm−1 (stretching vibrations of C![[double bond, length as m-dash]](https://www.rsc.org/images/entities/char_e001.gif) O), and the band around 1440 cm−1 (bending vibrations of O–H) confirm the existence of carboxyl groups on the carbon polymer chain. More importantly, the zeta potential of the prepared e-Pdots was measured to be −30.7 mV, indicating the negative charges on the surface of the e-Pdots.
O), and the band around 1440 cm−1 (bending vibrations of O–H) confirm the existence of carboxyl groups on the carbon polymer chain. More importantly, the zeta potential of the prepared e-Pdots was measured to be −30.7 mV, indicating the negative charges on the surface of the e-Pdots.
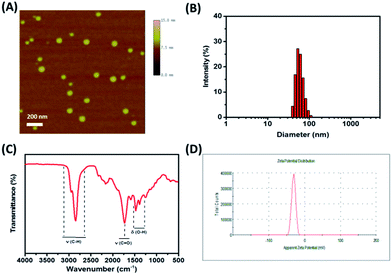 |
| | Fig. 1 (A) AFM image, (B) size distribution by DLS, (C) FTIR spectrum and (D) zeta potential of the prepared e-Pdots. | |
Principle of the proposed assay
The mechanism of the proposed assay is displayed in Scheme 1. The prepared e-Pdots were rich in carboxyl groups and exhibited strong electronegativity, which kept the nanoparticles stable in buffer solution. There was strong blue fluorescence (440 nm) of the e-Pdots under proper excitation (380 nm). On the other hand, melamine was easy to combine with H+ under acidic conditions and became an electron-withdrawing molecule. Therefore, the protonated melamine afforded strong electrostatic attraction towards the e-Pdots, eventually resulting in the aggregation of the e-Pdots. Meanwhile, an electron-transfer process occurred between the electron-rich e-Pdots and the electron-withdrawing melamine, and the apparent fluorescence was quenched. Since the quenched fluorescence was heavily related to the amount of melamine, melamine was quantitatively detected.
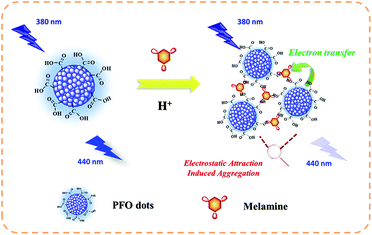 |
| | Scheme 1 Schematic diagram of the proposed assay based on the melamine-induced aggregation of e-Pdots. | |
Feasibility of the proposed assay
Relevant experiments have been performed to verify our principle. As shown in Fig. 2A, under the same excitation wavelength, the e-Pdots emitted a strong fluorescence emission (curve a), while melamine barely gave off any fluorescence emission (curve b). But when melamine was added into the sensing system containing e-Pdots, the fluorescence intensity dramatically decreased (curve c). This phenomenon indicated that melamine could induce the fluorescence quenching of the e-Pdots. By comparing the absorbance spectra of the e-Pdots, melamine, and mixture of e-Pdots with melamine, the interaction between melamine and the e-Pdots was investigated (Fig. 2B). The results revealed that the mixture of e-Pdots with melamine generated a new absorbance peak (254 nm) at the “E band”, and had a maximum absorbance at the “R band”. These changes could be attributed to the formation of hydrogen-bonds between melamine and the e-Pdots, inducing the aggregation of the e-Pdots.24–26 Furthermore, the zeta potentials of the e-Pdots before and after the addition of melamine were measured. The results showed that the zeta potential decreased from −30.7 mV to −2.8 mV (Fig. S2†), indicating that the melamine–e-Pdot complex was unstable and aggregated. Overall, it was deduced that melamine induced the aggregation of the e-Pdots and caused fluorescence quenching.
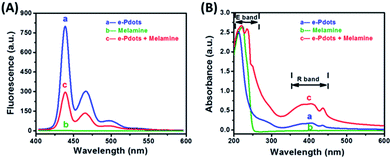 |
| | Fig. 2 (A) Fluorescence and (B) absorbance spectra of the sensing system: (a) e-Pdots (1 mg L−1), (b) melamine (100 nM), and (c) e-Pdots with melamine. | |
Optimization of the experimental conditions
According to the mechanism above, the pH value of the buffer solution affected the melamine protonation greatly, so this was investigated. The results in Fig. 3A reveal that the e-Pdots exhibited a comparatively stable fluorescence at pH values ranging from 3.0 to 9.0. But in the presence of melamine, the fluorescence intensity clearly decreased and obtained the maximum degree when the pH value was 4.0. Thus, the optimal pH value was 4.0 for the experiments. The incubation time also affected the fluorescence quenching of the sensing system, as melamine was hydrolyzed over time. The results in Fig. 3B show that the fluorescence intensity decreased with increasing incubation time, and tended to be stable until 45 min. After that, the fluorescence intensity slightly increased during a longer period of incubation. The reason for this might be that the hydrolyzed melamine can also self-aggregate into a high-molecular-weight network, decreasing the electrostatic attraction towards e-Pdots.15 Taking practical operations into consideration, 45 min was chosen as the optimal incubation time in this work.
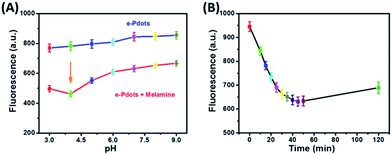 |
| | Fig. 3 (A) Fluorescence intensity of the e-Pdots (1 mg L−1) before and after addition of melamine (10 nM) at different pH values. (B) Fluorescence intensity of the e-Pdots (1 mg L−1) quenched by melamine (1 nM) at different incubation times. | |
Melamine detection and linear relationship
Under the optimal conditions, different concentrations of melamine were added into the sensing system for tests. As shown in Fig. 4, the fluorescence intensity was sensitive to melamine and gradually decreased with an increase in the concentration of melamine. It was found that the fluorescence intensity had a linear relationship with the logarithm of the concentration of melamine in the range of 0.1–100 nM. The linear equation is given as follows:
I = −234.99 − 95.89![[thin space (1/6-em)]](https://www.rsc.org/images/entities/char_2009.gif) log log![[thin space (1/6-em)]](https://www.rsc.org/images/entities/char_2009.gif) C, R2 = 0.9978 C, R2 = 0.9978 |
where I represents the fluorescence intensity, C represents the melamine concentration, and R2 represents the regression coefficient. The detection limit of this present method was as low as 0.03 nM (S/N = 10). Compared with other methods for melamine detection (shown in Table 1), the present method not only possesses a lower limit of detection (LOD), but also avoids complicated operations, suggesting its promising applications for real sample detection.
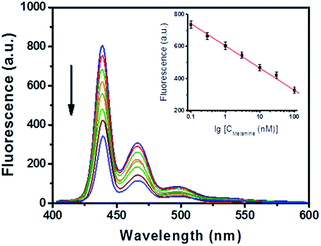 |
| | Fig. 4 Fluorescence intensity of PFO (1 mg L−1) in response to different concentrations of melamine (from top to bottom: 0, 0.1, 0.3, 1, 3, 10, 30, and 100 nM) in a PBS solution (10 mM, pH = 4.0). Inset is the linear relationship between the fluorescence intensity and the logarithmic concentration of melamine. Each level has been measured three times. | |
Table 1 Comparison of different methods for melamine detection
| Method |
Linear range (nM) |
LOD (nM) |
Reference |
| LC-MS |
10–500 |
10.0 |
27 |
| Electrochemistry |
10–5000 |
3.0 |
28 |
| Colorimetry |
8–400 |
2.5 |
24 |
| Fluorescence |
0.1–100 |
0.1 |
This work |
Interference study
Some potential interferents, including common ions, carbohydrates, and amino acids, were added into the sensing system to investigate its specificity for melamine detection. As shown in Fig. 5, these substances induced limited fluorescence quenching of the sensing system, all far lower than that of melamine. These results also confirmed the specific interaction between the e-Pdots and melamine, discriminating against other interferents. This indicated that the selectivity of this sensing system was acceptable.
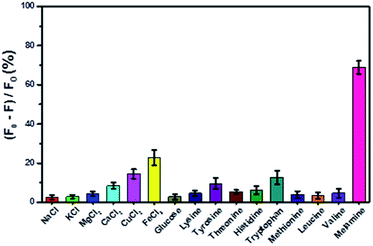 |
| | Fig. 5 Selectivity of the assay. The concentrations of the other interferents were each 10 μM, while the melamine concentration was 100 nM. The results are the average values of three independent measurements. | |
Determination of melamine released from a resin bowl
This fluorescence assay was then applied to detect the melamine released from a resin bowl and study the rule of migration. As shown in Table 2, the migratory quantities of melamine were different depending on the type of simulated solution. This showed that the resin bowl was able to release melamine under acidic conditions. These results were further verified by the LC-MS method, and the deviations between the two methods were less than 7%, suggesting the reliability of the proposed method. However, different from the LC-MS method that requires concentration of the extraction solution, this sensitive method offered direct analysis of the extraction solution, leading to convenient operation.
Table 2 Detection results of the melamine released from a resin bowla
| Sample |
Detected by this method (mg dm−2) |
Detected by the LC-MS method (mg dm−2) |
Deviation (%) |
| Results are the average values of three independent measurements. |
| Ultrapure water |
0.111 ± 0.006 |
0.106 ± 0.005 |
4.63% |
| Acetic acid solution |
0.203 ± 0.011 |
0.196 ± 0.009 |
3.16% |
| Ethanol-water solution |
0.083 ± 0.004 |
0.078 ± 0.003 |
6.25% |
Conclusions
In summary, the fluorescence quenching of e-Pdots based on melamine-induced electrostatic attraction and aggregation was proposed for the first time. The protonated melamine was electron-withdrawing and electrostatically attracted the electron-rich e-Pdots, resulting in the aggregation of the e-Pdots. Since an electron transfer process occurred between the e-Pdots and melamine, the sensing system exhibited a remarkable fluorescence decrease in response to melamine. Therefore, a facile assay for melamine, as well as the migration of melamine, was accordingly developed. The proposed method shows many advantages, including convenient operations, low cost, high sensitivity, and robust anti-interference capacity, suggesting its promising applications for melamine detection.
Conflicts of interest
There are no conflicts to declare.
Acknowledgements
This project was financially supported by the Science and Technology Project of Fujian Province (2018N2002), the Education-Science Research Project for Young and Middle-aged Teachers of Fujian (JA15690), and the Natural Science Foundation of Zhangzhou (zz2018j46).
Notes and references
- C. Wu, B. Bull, C. Szymanski, K. Christensen and J. McNeill, ACS Nano, 2008, 2, 2415–2423 CrossRef CAS.
- J. Pecher and S. Mecking, Chem. Rev., 2010, 110, 6260–6279 CrossRef CAS.
- C. Wu, T. Schneider, M. Zeigler, J. Yu, P. G. Schiro, D. R. Burnham, J. D. McNeill and D. T. Chiu, J. Am. Chem. Soc., 2010, 132, 15410–15417 CrossRef CAS.
- C. S. Ke, C. C. Fang, J. Y. Yan, P. J. Tseng, J. R. Pyle, C. P. Chen, S. Y. Lin, J. Chen, X. Zhang and Y. H. Chan, ACS Nano, 2017, 11, 3166–3177 CrossRef CAS.
- J. Yu, Y. Rong, C. T. Kuo, X. H. Zhou and D. T. Chiu, Anal. Chem., 2017, 89, 42–56 CrossRef CAS.
- J. Sun, H. Mei, S. Wang and F. Gao, Anal. Chem., 2016, 88, 7372–7377 CrossRef CAS.
- J. Sun, H. Mei and F. Gao, Biosens. Bioelectron., 2017, 91, 70–75 CrossRef CAS.
- C. Y. Shi, N. Deng, J. J. Liang, K. N. Zhou, Q. Q. Fu and Y. Tang, Anal. Chim. Acta, 2015, 854, 202–208 CrossRef CAS.
- J. Sun, H. Mei and F. Gao, Biosens. Bioelectron., 2017, 91, 70–75 CrossRef CAS.
- Q. Zhao, C. Zhang, S. Liu, Y. Liu, K. Y. Zhang, X. Zhou, J. Jiang, W. Xu, T. Yang and W. Huang, Sci. Rep., 2015, 5, 16420 CrossRef CAS.
- J. Wang, S. Zhang, H. Dai, H. Zheng, Z. Hong and Y. Lin, Biosens. Bioelectron., 2019, 142, 111567 CrossRef CAS.
- S. Kuo, H. Li, P. Wu, C. Chen, Y. Huang and Y. Chan, Anal. Chem., 2015, 87, 4765–4771 CrossRef CAS.
- J. Sun, S. Wang and F. Gao, Langmuir, 2016, 32, 12725–12731 CrossRef CAS.
- W. Xu, S. Lu, M. Xu, Y. Jiang, Y. Wang and X. Chen, J. Mater. Chem. B, 2016, 4, 292–298 RSC.
- C. Lam, L. Lan, X. Che, S. Tam, S. S.-Y. Wong, Y. Chen, J. Jin, S. Tao, X. Tang, K.-Y. Yuen and P. K.-H. Tam, Clin. Chim. Acta, 2009, 402, 150–155 CrossRef CAS PubMed.
- E. Y. Y. Chan, S. M. Griffiths and C. W. Chan, Lancet, 2008, 372, 1444–1445 CrossRef CAS.
- C. Fu, C. Liu, Y. Li, Y. Guo, F. Luo, P. Wang, L. Guo, B. Qiu and Z. Lin, Anal. Chem., 2016, 88, 10176–10182 CrossRef CAS.
- H. Yan, X. Cheng, N. Sun, T. Cai, R. Wu and K. Han, J. Chromatogr. B: Anal. Technol. Biomed. Life Sci., 2012, 908, 137–142 CrossRef CAS.
- X. Deng, D. Guo, S. Zhao, L. Han, Y. Sheng, X. Yi, Y. Zhou and T. Peng, J. Chromatogr. B: Anal. Technol. Biomed. Life Sci., 2010, 878, 2839–2844 CrossRef CAS.
- X. Zhu, S. Wang, Q. Liu, Q. Xu, S. Xu and H. Chen, J. Agric. Food Chem., 2009, 57, 11075–11080 CrossRef CAS.
- Z. Lin, G. Zhang, W. Yang, B. Qiu and G. Chen, Chem. Commun., 2012, 48, 9918–9920 RSC.
- W. Yang, G. Zhang, W. Weng, B. Qiu, L. Guo, Z. Lin and G. Chen, RSC Adv., 2014, 4, 58852–58857 RSC.
- W. Yang, J. Ni, F. Luo, W. Weng, Q. Wei, Z. Lin and G. Chen, Anal. Chem., 2017, 89, 8384–8390 CrossRef CAS PubMed.
- K. Ai, Y. Liu and L. Lu, J. Am. Chem. Soc., 2009, 131, 9496–9497 CrossRef CAS.
- Q. Cao, H. Zhao, Y. He, X. Li, L. Zeng, N. Ding, J. Wang, J. Yang and G. Wang, Biosens. Bioelectron., 2010, 25, 2680–2685 CrossRef CAS.
- M. Zhang, X. Cao, H. Li, F. Guan, J. Guo, F. Shen, Y. Luo, C. Sun and L. Zhang, Food Chem., 2012, 135, 1894–1900 CrossRef CAS.
- General Administration of Quality Supervision, Inspection and Quarantine of the People's Republic of China and China National Standardization Management Committee, GB/T 22388-2008, Determination of melamine in raw milk and dairy products, China Standards Press, Beijing, 2008 Search PubMed.
- Q. Cao, H. Zhao, Y. He, N. Ding and J. Wang, Anal. Chim. Acta, 2010, 675, 24–28 CrossRef CAS PubMed.
Footnote |
| † Electronic supplementary information (ESI) available. See DOI: 10.1039/c9ra07005b |
|
| This journal is © The Royal Society of Chemistry 2019 |
Click here to see how this site uses Cookies. View our privacy policy here.  Open Access Article
 *b
*b
![[thin space (1/6-em)]](https://www.rsc.org/images/entities/char_2009.gif) 200, polydispersity = 3.7), and poly (styrene-co-maleic anhydride) (PSMA, average MW = 1700, styrene content 68%) were purchased from Sigma-Aldrich (St. Louis, USA). Tetrahydrofuran (THF, anhydrous, 99.9%) and other reagents were all analytical grade, and supplied by Sinopharm Chemical Reagent Co., Ltd (Shanghai, China). Ultrapure water (18.2 MΩ.cm) was prepared with a Milli-Q system (Millipore, Bedford, MA, USA) and used throughout the study.
200, polydispersity = 3.7), and poly (styrene-co-maleic anhydride) (PSMA, average MW = 1700, styrene content 68%) were purchased from Sigma-Aldrich (St. Louis, USA). Tetrahydrofuran (THF, anhydrous, 99.9%) and other reagents were all analytical grade, and supplied by Sinopharm Chemical Reagent Co., Ltd (Shanghai, China). Ultrapure water (18.2 MΩ.cm) was prepared with a Milli-Q system (Millipore, Bedford, MA, USA) and used throughout the study.
![[double bond, length as m-dash]](https://www.rsc.org/images/entities/char_e001.gif) O), and the band around 1440 cm−1 (bending vibrations of O–H) confirm the existence of carboxyl groups on the carbon polymer chain. More importantly, the zeta potential of the prepared e-Pdots was measured to be −30.7 mV, indicating the negative charges on the surface of the e-Pdots.
O), and the band around 1440 cm−1 (bending vibrations of O–H) confirm the existence of carboxyl groups on the carbon polymer chain. More importantly, the zeta potential of the prepared e-Pdots was measured to be −30.7 mV, indicating the negative charges on the surface of the e-Pdots.


![[thin space (1/6-em)]](https://www.rsc.org/images/entities/char_2009.gif) log
log![[thin space (1/6-em)]](https://www.rsc.org/images/entities/char_2009.gif) C, R2 = 0.9978
C, R2 = 0.9978


