 Open Access Article
Blank experimental study on the determination of nitrogen and oxygen isotopes by chemical conversion method
Yuhan Zong ab,
Jing Huc,
Yadi Wangab,
Hongliang Sund,
Yuliang Li*ab and
Weiguo Liuc
aKey Laboratory of Subsurface Hydrology and Ecological Effects in Arid Region, Ministry of Education, Chang'an University, Xi'an 710054, China. E-mail: yulianglee@Hotmail.com; Tel: +86-29-82334853
bSchool of Environmental Science and Engineering, Chang'an University, Xi'an 710054, China
cState Key Laboratory of Loess and Quaternary Geology, Institute of Earth Environment, Chinese Academy of Sciences, Xi'an, China
dChinese Academy for Environmental Planning, Beijing, 100012, China
First published on 14th November 2019
Abstract
The reduction of nitrate to nitrous oxide by chemical conversion has the characteristics of simple operation and high sensitivity. Therefore, it is widely used in the pretreatment of nitrogen and oxygen isotopes. In this paper, a series of blank experiments were performed to determine various factors influencing the determination process for the chemical conversion method. To determine blank background values for reagents such as deionized water, NaCl and cadmium powder used in the experiment, the optimal experimental conditions of NaN3, NaCl and cadmium powder were determined to maximize the nitrate reduction rate. The results showed that NaCl was burned at 450 °C for 48 hours, and the placement time was not more than one day, which could minimize the pollution introduced by NaCl. When 0.3 g of cadmium powder and 600 nmol of NaN3 were added, the overall reduction efficiency reached 90%. After measuring actual standard samples, the method demonstrated a good accuracy and applicability.
Introduction
Nitrogen is an important component for all living things, the primary limiting factor for the productivity of most terrestrial ecosystems and affects the global nitrogen cycle. Nitrate is an important nitrogen source in terrestrial and aquatic ecosystems. With the increase in fossil fuel combustion and agricultural activities, the importance of nitrate in atmospheric deposition, plants, soil and aquatic ecosystems has become the focus of environmental science and ecological research.1–4 The isotopic composition of nitrogen in nitrate (δ15N and δ18O) can provide valuable information to characterize the dominant sources of nitrate contamination.5 The nitrate stable isotope technique, with its tracer, indicator and integrative functions, has been widely used to study the dynamics and sources of nitrate in atmospheric deposition, aquatic ecosystems, soil and plants.6–10With the development of testing technology, the latest methods for the determination of nitrogen and oxygen isotopes in nitrate are the chemical conversion method and biological conversion method. The biological conversion method has more requirements in the laboratory; the bacterial survival conditions are strict and the survival rate is lower.11 However, chemical conversion is easy to operate and the mechanism is simple where nitrate is reduced to nitrous oxide in only two steps.
Lachouani et al. used vanadium chloride (VCl3) as a reducing agent in the first step to convert NO3− into NO2− and sodium azide was used in the second step under acidic conditions to convert NO2− into N2O.12 However, this method could not determine the value of δ18O and the nitrate pollution in the second step of the reductant, sodium azide, led to a larger blank value for the entire method. McIlvin et al. reduced the nitrate to nitrite with sponge cadmium or active cadmium in the first step of the reduction process.13 The greatest advantage of this method is that it could simultaneously determine the nitrogen and oxygen isotope composition in nitrate. However, the preparation of sponge cadmium or active cadmium is complicated. Therefore, Tu et al. improved the azide method for the analysis of nitrate isotopes.14 In other words, NO3− was reduced to NO2− using cadmium powder instead of sponge cadmium or active cadmium under an ultrasonic wave. In addition, the amount of the toxic azoic acid acetate buffer in the second reduction reaction was reduced to 1/100th the original trial amount. The method is simple in operation, short in preparation time and easy to establish.15
The results from Bell et al. showed that the background nitrate contamination introduced by different brands of KCl were different.16 However, in the chemical denitrification process, more chemical reagents such as NaCl, NaN3, Cd power, etc. are used in the reagent preparation process. Different levels of nitrogen pollution are inevitable. Therefore, the background value of nitrogen introduced by the reagents during the chemical denitrification process could not be ignored. At present, there are few studies on reducing the influence of the blank background value on a nitrogen-oxygen stable isotope measurement by controlling the pretreatment method and chemical reagent process.17
Based on the above analysis, the blank value and reduction rate were studied using the modified azide method. More specifically, the blank value of each reagent was first measured. The experimental blank value was reduced by changing the NaCl placement time after firing and the purge time for the sodium azide acetate buffer. The amount of cadmium added, the addition of sodium azide and the reaction time in the nitrous oxide experimental conditions were optimized to ensure a high yield.18–21
In this paper, we examined the blank background values for NaCl, Cd power and deionized water with the chemical denitrification method, determined the optimal experimental conditions for the method and established a good experimental basis for the subsequent detection of sample isotope values. By measuring the isotope value of the natural sample, it showed that the above method has good applicability.22
Experimental
Sample analysis
There were two main steps performed before determining the nitrogen and oxygen isotopes in the sample.14 First, nitrate was reduced to nitrite by cadmium powder. Specifically, a sample containing 25 nmol of nitrate was added to a 10 mL centrifuge tube, followed by dilution with deionized water to 5 mL. NaCl was added to provide a final Cl− concentration of 5 M. Then, 0.3 g of Cd powder without pretreatment was added, followed by 0.1 mL of a 1 M imidazole solution. The centrifuge tube was sealed, mixed, placed in an ultrasonic environment, sonicated at 40 °C for 2 h and allowed to stand at room temperature overnight after sonication. Second, sodium azide reduced nitrite to nitrous oxide. Specifically, 0.65 g of NaN3 in a 20 mL headspace bottle was added to 5 mL of deionized water in a fume hood and the mixture was shaken. Then, 5 mL of a 20% acetic acid solution was added for acidification. The solution was purified with the reagent at 70 mL min−1 N2 for 1.5 h (long needle air intake, short needle gas outlet) to remove the N2O gas in the solution. The supernatant was removed from the centrifuge tube in the 4 mL to 20 mL headspace bottle. The rubber plug and aluminum cover were installed. The above reaction was added to each headspace bottle with 0.2 mL of NaN3 buffer. The mixture was shaken for 30 min and the reaction was terminated by the addition of 0.4 mL of 10 M NaOH. Lastly, a certain amount of gas in the upper part of the headspace bottle was injected into an isotope ratio mass spectrometer with an automatic preconcentration device to determine the nitrogen and oxygen isotope ratio of N2O in the gas sample.Experiment 1: effect of NaCl on its background N2O value
To evaluate the background N2O value for NaCl caused by the firing temperature for NaCl and the time after firing, NaCl was pre-combusted at 450 °C and 550 °C for 48 hours in the muffle furnace. Then, NaCl was placed in a glass vacuum dryer for different days (1 to 6 days). The purpose of the pre-combusted NaCl was to remove any moisture and other impurities from the crystal.Experiment 2: effect of whether or not the supernatant was filtered on the second step of the reduction
Since the experiment was performed two steps, the solution containing the cadmium powder obtained in the first step of the reduction process may have affected the second step reaction. The solution obtained in the first step was filtered to see if filtration had an effect on the experimental results. We chose two different types of filters, 0.2 μm and 0.45 μm hydrophilic filters.Experiment 3: effect of the Cd powder addition on the reduction efficiency of NO3− to NO2−
In order to maximize the NO3− reduction yield, we checked the effect of the Cd powder addition on the reduction efficiency. In this experiment, except for the amount of Cd powder, all reaction conditions were the same as those in the previous experiment. Before this experiment, we compared the reduction rate of nitrate during the first step of the reduction process with several of the same experiments.Experiment 4: effect of the NaN3 purge time on its background N2O value and NaN3 on the reduction efficiency of NO2− to N2O
In the experiment, the sample was purged with a nitrogen gas flow to remove the nitrogen impurities in NaN3 and eliminate the negative pressure in the headspace bottle. To determine if the background N2O value for NaN3 was affected by its purge time, we tested four different times (0.5 hours, 1 hour, 1.5 hours and 2 hours). In the second reduction reaction step, NO2 was converted into N2O using the azide buffer. Because NaN3 is extremely toxic and volatile, reducing the amount of NaN3 is important for the experiment. Therefore, we implemented a program to test its minimum usage without affecting its results.Results and discussion
The whole blank composition of chemical conversion method
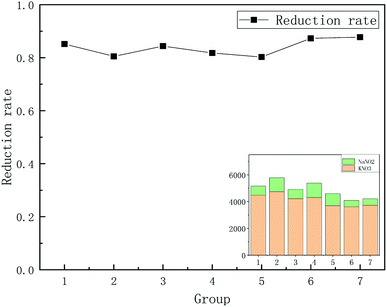
Based on the above experimental methods, we first determined the blank composition of some major substances. These substances included deionized water (DIW), NaCl, Cd and a total blank composition. The m/z 44 peak amplitude detected by the mass spectrometer indicated the N2O content in the substance (Fig. 1). Then, the value of the m/z 44 peak represented the ion signal strength and was based on the response value for N2O. We analyzed the composition of the total blank during the experiment by measuring the m/z 44 peak.16 As shown in Fig. 1, a lack of attention to detail could result in different blank errors, even with the same operation. Therefore, we needed to refine the details of each step. If NO3− was not completely converted to N2O, isotopic fractionation could be caused, resulting in measurement errors. Therefore, we needed to determine the conversion rate of nitrate. We calculated the reduction rate of nitrate by measuring the m/z 44 peak for KNO3 and NaNO2. After the calculation, we determined that the reduction rate of nitrate during the first step of the reduction was between 80% and 90% (Fig. 2).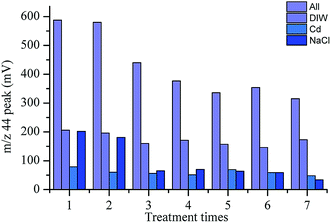 | ||
| Fig. 1 Variation in the peak amplitude range (m/z 44) for three main substances and the total blank composition. | ||
The exploration of N2O background value in NaCl
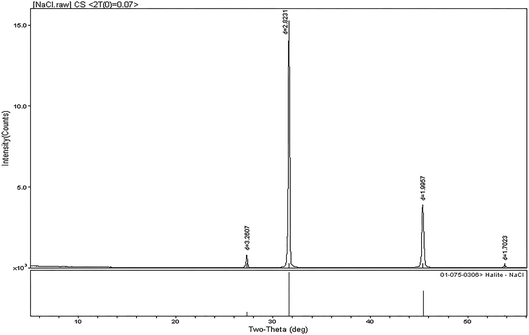
The N2O produced by the NO3− reduction was introduced into an isotope-ratio mass spectrometer. The N and O isotopic composition was measured for N2O. The value for N2O was closely related to the measured isotope value. It was necessary to explore the N2O background value in the reagents used. We found that the blank value for deionized water in the first two experiments was about 200, which was higher than the other experimental values (150–170). This was because the blank value for deionized water in the first two experiments was relatively large after being added for a period of time. Therefore, deionized water was used immediately after receival. Then, the value for the m/z 44 peak in Cd ranged from 30 to 80. In the previous experiment, we determined that NaCl had a greater impact on the background value (Fig. 1). Therefore, it made sense to explore the impact of NaCl on the blank value. In this experiment, the variation in the m/z 44 peak for NaCl was larger and the difference was obvious. The minimum value was 33 and the maximum value was 202. This indicated that although the blank for deionized water was relatively large, the influence of NaCl was the largest.18 This effect was minimized by making the standards and blanks in the same NaCl solution.NaCl was analyzed by X-ray diffraction. As shown in Fig. 3, the content for the other impurities in the NaCl reagent was all below the normal range, which indicated that the higher N2O background value in NaCl was caused by operation and pretreatment during the experimental process.
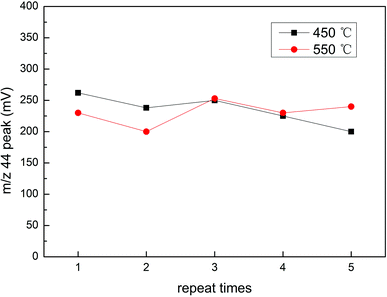
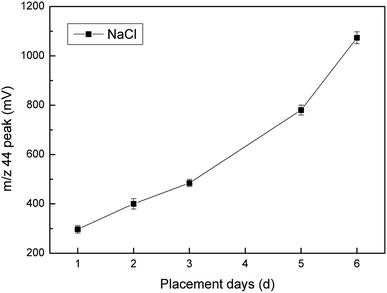
The NaCl added in the experiment required pre-combustion. By comparing the combustion at two temperatures (450 °C and 550 °C), we saw that there was no distinct difference between the two temperatures (Fig. 4). The results of our study suggest that a pre-combustion of NaCl at 450 °C ensured that the contaminant content was minimized. We did not find a significant effect of the firing temperature on the m/z 44 peak amplitude for the NaCl blanks. However, we did find that the NaCl placement days was correlated with its blank value. As shown in Fig. 5, the longer the placement time, the larger the N2O background value for NaCl. We speculated that this phenomenon might have been due to increased reagent purity reducing other background molecules that interfered with the bacterial conversion of NO3− into N2O. Therefore, NaCl was used immediately on the day of pre-combustion.
NO3− conversion efficiency
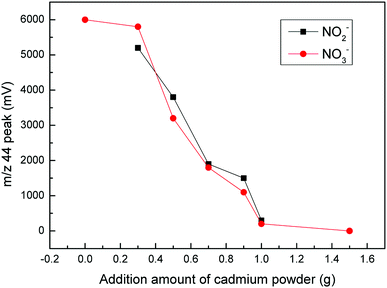
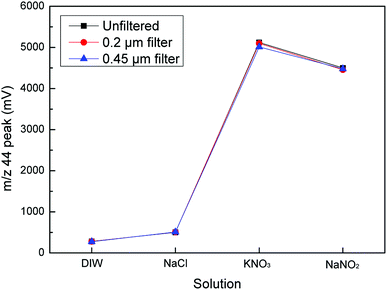
Cadmium powder plays a vital role in the first step of the reduction process as it has the ability to reduce nitrate to nitrite. By changing the amount of Cd powder added, we found that the m/z 44 peak for NO3− and NO2− changed significantly. As the added amount of cadmium powder increased, the peak decreased. More specifically, when the added amount of cadmium powder was less than 0.3 g, the m/z 44 peak value for NO3− showed no significant changes. However, when it was larger than 0.3 g, the m/z 44 peak value began to decrease. As the cadmium powder content increased to 1.5 g, the m/z 44 peak value for NO3− was reduced to zero. The reason, however, for this situation was not that the reduction capacity of the cadmium powder was insufficient. The reduction was too strong due to the excessive cadmium powder content, which further reduced N2O to N2, making it impossible to detect in an isotope mass spectrometer. The results showed that 0.3 g of Cd powder efficiently reduced the 5 mL samples from NO3− to NO2−. In addition, the m/z 44 peak for NO2− also decreased with the addition of Cd powder. These results indicated that the optimal amount of Cd powder was 0.3 g (Fig. 6).Based on previous research, in order to eliminate the influence of cadmium powder on the second step in the reduction process, we further explored whether filtration of the supernatant obtained in the first step of the reduction process for cadmium powder would affect the second step of the reduction (Fig. 7). The m/z 44 peak values for each substance measured before and after filtration were compared. Then, we found that the results were consistent. Therefore, the supernatant could be used without filtration.
Influence of NaN3
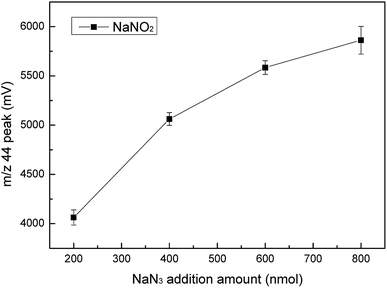
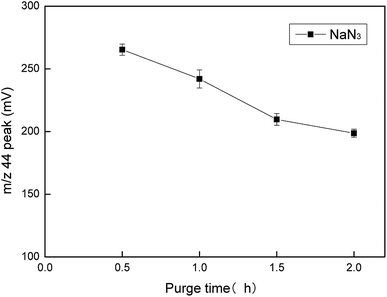
NaN3 was a key reagent throughout the experiment as it formed an azide buffer with acetic acid and reduced NO3− to NO2−. With the increase in the NaN3 consumption, we found that the m/z 44 peak value for NaNO2 increased. However, when the added amount of NaN3 was more than 600 nm, the growth range decreased, which meant that the reduction efficiency was not significantly improved (Fig. 8). We could also conclude that 200 nmol of NaN3 could not completely reduce 25 nmol of NO3−. If too much NaN3 is added, it will increase the pollution during the experiment, which may cause unnecessary harm. Therefore, 600 nmol was selected as the best added amount of NaN3. The purge time for NaN3 had an effect on the m/z 44 peak value of NaN3 (Fig. 9). The results showed that the measured m/z 44 peak value for NaN3 was 261 when the purge time was 0.5 hours. As the purge time increased, the m/z 44 peak value was lower. However, when the purge time was increased from 1.5 hours to 2 hours, the change in the m/z 44 peak was very small. The numerical difference was only 8. Therefore, we think that 1.5 hours already had a good purge effect. Taking into account the time and cost, we chose 1.5 hours as the best purge time.Calibration of measurement results
It can be seen from the above studies that in the process of chemical denitrification, the nitrogen and oxygen isotope determination will inevitably produce blank pollution, so we used the standard material solution to prepare the standard curve to correct the measurement results.23 Commonly used international standard substances that participate in the calibration curve are USGS-32(KNO3), USGS-34(KNO3), USGS-35(NaNO3) and IAEA-N3(KNO3). The calibration equation for the δ15N value is:14
 | (1) |
The standard curve shown in Fig. 10 indicates a good correlation between the measured δ15N value and the true value of δ15N. In Table 1, we list the true values and corrected values that passed the standard curve of the four international standard samples. We found that the blank contamination could be calculated and calibrated using the calibration curve. Therefore, during the chemical experiment process, as long as we strictly followed the above measurement conditions, the blank pollution in the experiment could be corrected using the standard curve.
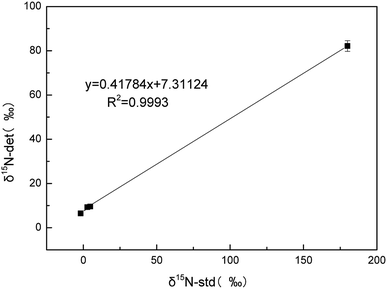 | ||
| Fig. 10 Linear regression analysis of the measured values and true values for δ15N in four standard substance solutions. | ||
| Standard sample | Standard value (‰) | Calculated value (‰) | RE (%) |
|---|---|---|---|
| USGS-32 | 180 | 185 | 2.7 |
| USGS-34 | −1.8 | −2.0 | 11.1 |
| USGS-35 | 2.7 | 3.3 | 22.2 |
| IAEA-N3 | 4.7 | 5.3 | 12.7 |
We believe that the chemical conversion method for the determination of nitrogen and oxygen isotopes can more accurately determine the sample.
Conclusion
This paper presented a relatively simple, highly accurate chemical conversion method (azide method) for the determination of nitrogen and oxygen isotope values in nitrate. Our study revealed the influencing factors for the blank background value in this method and determined the best experimental conditions to improve the reduction conversion efficiency.By testing the blank background values in the experiment, it was found that NaCl was the root cause of the fluctuation in the blank value. Then, we explored the cause of the change in the blank value by changing the burning time of NaCl and the time of placement. We found that a temperature of 450 °C was sufficient to remove nitrogen impurities. However, NaCl should be used immediately after burning and should not be added for a long time. After adding 0.3 g of Cd powder and 600 nmol of NaN3, NO3− was completely reduced and the reduction effect was better.
Afterwards, we plan to apply this method to practical measurements, which can be used to measure nitrogen sources in soil and rivers.
Conflicts of interest
There are no conflicts to declare.Acknowledgements
This work was sponsored by the National Natural Science Foundation of China (21706038), State Key Laboratory of Loess and Quaternary Geology (SKLLQGYQ1802) and the National Training Projects of the University Students' Innovation and Entrepreneurship Program (201910710124, 201910710125 and s201910710244).Notes and references
- X. Liu, Y. Zhang and W. Han, et al., Enhanced nitrogen deposition over China, Nature, 2013, 494(7438), 459–462 CrossRef CAS PubMed.
- J. Liu, B. Peng and Z. Xia, et al., Different fates of deposited NH4+ and NO3− in a temperate forest in northeast China: a 15N tracer study, Glob. Chang. Biol., 2017, 23(6), 2441–2449 CrossRef PubMed.
- E. Minet, C. E. Coxon and R. Goodhue, et al., Evaluating the utility of 15N and 18O isotope abundance analyses to identify nitrate sources: a soil zone study, Water Res., 2012, 46(12), 3723–3736 CrossRef CAS PubMed.
- M. M. M. Kuypers, H. K. Marchant and B. Kartal, The microbial nitrogen-cycling network, Nat. Rev. Microbiol., 2018, 16(5), 263–276 CrossRef CAS PubMed.
- M. Zhang, J. Shi and L. Wu, Factors influencing the accuracy of the denitrifier method for determining the oxygen isotopic composition of nitrate, J. Zhejiang Univ., Sci., B, 2019, 20(1), 49–58 CrossRef CAS PubMed.
- Y. Chang, X. Liu and C. Deng, et al., Source apportionment of atmospheric ammonia before, during, and after the 2014 APEC summit in Beijing using stable nitrogen isotope signatures, Atmos. Chem. Phys., 2016, 16, 11635–11647 CrossRef CAS.
- Y. Fang, K. Koba and X. Wang, et al., Anthropogenic imprints on nitrogen and oxygen isotopic composition of precipitation nitrate in a nitrogen-polluted city in southern China, Atmos. Chem. Phys. Discuss., 2011, 10(9), 1313–1325 CrossRef.
- L. Geng, B. Alexander and J. Cole-Dai, et al., Nitrogen isotopes in ice core nitrate linked to anthropogenic atmospheric acidity change, Proc. Natl. Acad. Sci. U. S. A., 2014, 111(16), 5808–5812 CrossRef CAS PubMed.
- M. I. Makarov, The nitrogen isotopic composition in soils and plants: its use in environmental studies (a review), Eurasian Soil Sci., 2009, 42(12), 1335–1347 CrossRef.
- Y. Takebayashi, K. Koba and Y. Sasaki, et al., The natural abundance of 15N in plant and soil-available N indicates a shift of main plant N resources to NO3− from NH4+ along the N leaching gradient, Rapid Commun. Mass Spectrom., 2010, 24, 1001–1008 CrossRef CAS PubMed.
- B. Yang, H. Wang and Y. Jiang, et al., Combing δ15N and δ18O to identify the distribution and the potential sources of nitrate in human-impacted watersheds, Shandong, China, RSC Adv., 2018, 8, 23199–23205 RSC.
- P. Lachouani, A. H. Frank and W. Wanek, A suite of sensitive chemical methods to determine the δ15N of ammonium, nitrate and total dissolved N in soil extracts, Rapid Commun. Mass Spectrom., 2010, 24(24), 3615–3623 CrossRef CAS PubMed.
- M. R. McIlvin and M. A. Altabet, Chemical Conversion of Nitrate and Nitrite to Nitrous Oxide for Nitrogen and Oxygen Isotopic Analysis in Freshwater and Seawater, Anal. Chem., 2005, 77(17), 5589–5595 CrossRef CAS PubMed.
- Y. Tu, Y. Fang and D. Liu, et al., Modifications to the azide method for nitrate isotope analysis, Rapid Commun. Mass Spectrom., 2016, 30(10), 1213–1222 CrossRef CAS PubMed.
- E. Ryabenko, M. A. Altabet and D. W. R. Wallace, Effect of chloride on the chemical conversion of nitrate to nitrous oxide for δ15N analysis, Limnol. Oceanogr.: Methods, 2009, 7(7), 545–552 CrossRef CAS.
- M. D. Bell and J. O. Sickman, Correcting for background nitrate contamination in KCl−extracted samples during isotopic analysis of oxygen and nitrogen by the denitrifier method, Rapid Commun. Mass Spectrom., 2014, 28(5), 520–526 CrossRef CAS PubMed.
- D. J. Ma, Z. Y. Chen and L. Yi, Development of improved dual-diazonium reagents for faster crosslinking of tobacco mosaic virus to form hydrogels, RSC Adv., 2019, 9(50), 29070–29077 RSC.
- U. Tsunogai, T. Kido and A. Hirota, et al., Sensitive determinations of stable nitrogen isotopic composition of organic nitrogen through chemical conversion into N2O, Rapid Commun. Mass Spectrom., 2008, 22(3), 345–354 CrossRef CAS PubMed.
- M. Mcilvin and M. Altabet, Nitrogen and Oxygen Isotopic Detection of Nitrate in Seawater by Chemical Conversion of Nitrate to Nitrous Oxide, J. Chem. Technol. Biotechnol., 2018, 3(1), 1216–1223 Search PubMed.
- D. Liu, Y. Fang and Y. Tu, et al., Chemical Method for Nitrogen Isotopic Analysis of Ammonium at Natural Abundance, Anal. Chem., 2014, 86(8), 3787–3792 CrossRef CAS PubMed.
- S. Dai, L. Xie and L. Peng, et al., Determination of nitrogen and oxygen isotopes in nitrates: a minireview, Anal. Lett., 2017, 50(13), 2045–2057 CrossRef CAS.
- Y. Zhang, B. C. Cheng and C. Li, et al., Characterization and comparison of Re-Du-Ning aerosol particles generated by different jet nebulizers, RSC Adv., 2019, 9, 30292–30301 RSC.
- L. Rock and B. H. Ellert, Nitrogen-15 and oxygen-18 natural abundance of potassium chloride extractable soil nitrate using the denitrifier method, Soil Sci. Soc. Am. J., 2007, 71(2), 355–361 CrossRef CAS.
| This journal is © The Royal Society of Chemistry 2019 |

