 Open Access Article
Uniform gallium oxyhydroxide nanorod anodes with superior lithium-ion storage†
Jingjing Fenga,
Bowen Fub,
Liang Fang a,
Fang Wangb,
Xin Zhangb,
Yongtao Li
 *a and
Yun Song
 *b
*b
aSchool of Materials Science and Engineering & Key Laboratory of Green Fabrication and Surface Technology of Advanced Metal Materials of Ministry of Education, Anhui University of Technology, Maanshan, 243002, China. E-mail: toni-li@163.com; Fax: +86-555-2311 570; Tel: +86-555-2311 570
bDepartment of Materials Science, Fudan University, Shanghai, 200433, China. E-mail: songyun@fudan.edu.cn
First published on 29th October 2019
Abstract
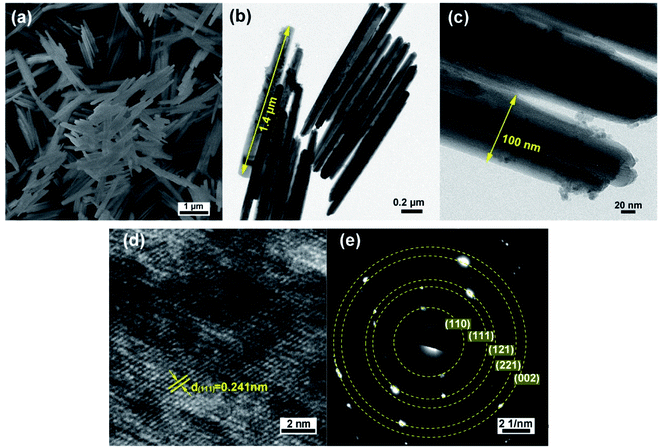
Exploration of a novel metal oxyhydroxide material provides potential candidates for lithium ion battery (LIB) anodes. In the present work, uniform GaOOH nanorods have been successfully synthesized via a simple hydrothermal method and employed as an anode material for LIBs for the first time. The obtained GaOOH nanorods show a high-purity phase with an average length of ∼1.4 μm and a width of ∼100 nm. As an anode, it delivers a stable capacity of ∼1089 mA h g−1 at a 0.5 A g−1 current density upon 300 cycles and a high rate capacity of ∼639 mA h g−1 at 2 A g−1, where the pseudocapacitance plays a dominant role with a capacity contribution ratio of about 83% at 2.0 mV s−1. This enhanced storage performance can be attributed to a 1D nanostructure with efficient electron and ion transfer as well as strain relaxation upon multiple-cycling.
1. Introduction
Lithium-ion secondary batteries (LIBs) have been considered one of the most fascinating energy storage devices for high energy density, suitable voltage and environmental benignity.1,2 However, the unfavorable capacity and rate performance of existing material blocks further practical application in electric vehicles, thus exploring novel anode materials with high performance is desired.3–5 Many reports have demonstrated that the invoked electrochemical performance of anode materials depends on choosing an appropriate material with optimized morphology.6–10The material component is the first important factor for advanced LIBs anodes.11 Sn, Sb, Ge, Si and Ga metal candidates, which can alloy with Li, seem to be the optimal choice. Ga exhibits a unique liquid nature at room temperature with reported self-healing ability,12–15 which can repair electrode cracks by surface tension upon lithiation reactions.16 Moreover, the alloy reactions between Li and Ga undergo the following reversible process: Ga ↔ Li2Ga7 ↔ LiGa ↔ Li2Ga,17 thus delivering a theoretical capacity of ∼768 mA h g−1 from Li2Ga, about twice as much as commercial graphite anode.18 Therefore, Ga-based materials including Ga2O3, Ga2S3, Ga2Se3, etc, have attracted interest as LIBs anodes.19–21
Furthermore, oxyhydroxide has been employed as material for LIBs or supercapacitors,22,23 because of their ultrafast and reversible surface redox reactions between OOH-group and transition metal ions for capacitive charge storage. In this regards, gallium oxyhydroxide (GaOOH) with theoretical capacity of ∼1304 mA h g−1 is also expected to show good performance due to both Ga existence and capacitive behavior from OOH group. However, to the best of our knowledge, GaOOH as LIBs anode has not been reported yet.
On the other hand, the Li-ion storage performance highly depends on the optimized morphology of materials.24,25 It has been demonstrated that one-dimensional (1D) nanomaterials, such as nanorod, nanowire and nanotube exhibit excellent performance due to short electron/ion diffusion pathway, more active sites as well as enough space for volume expansion upon cycling.26,27 For instance, Mai and co-workers have reported uniform manganese oxide nanorods with a length of about 2.5 μm and a diameter of about 180 nm, which exhibits excellent specific capacity of 630 mA h g−1 upon 900 cycles at the current density of 0.1 A g−1, and high rate performance of 595 mA h g−1 at 1 A g−1.28,29 Thus, 1D morphology is rather desired in improving the high-rate cycling performance of GaOOH. Unfortunately, the uniform 1D GaOOH nanorods were difficult to obtain by existed method,30 which confuses the understanding of enhanced lithium storage properties.
Herein, for the first time, GaOOH nanorods with uniform morphology and size have been successfully synthesized via a simple hydrothermal route, and their electrochemical properties are investigated as LIBs anode. The GaOOH anode shows fascinating reversible capacity and superior rate performance, and the contribution of pseudocapacitance was also revealed by kinetical analysis. The obtained results further demonstrate that combined component and morphology tuning is an effective route to further constructing advanced anode materials.
2. Experimental
2.1 Materials preparation
GaOOH nanorods was prepared via a simple hydrothermal method: gallium nitrate hydrate (Ga(NO3)3·xH2O, 99.9% purity, Aladdin) and potassium hydroxide (KOH, AR, Sinopharm) were dissolved in a mixture solution of ethylene glycol (C2H6O2, 99% purity, Sinopharm) and deionized water. The solution was then transferred into Teflon-lined stainless steel autoclave, which was heated at 190 °C for 52 hours in oven and cooled naturally. The resulting precipitate was collected and washed alternately with deionized water and ethanol for 3 times and dried at 90 °C to obtain the final product.2.2 Characterizations and property measurements
Phase structure was determined by X-ray diffraction on D8-ADVANCE Bruker. The morphology, microstructure and chemical state were measured by scanning electron microscopy (SEM, Cambridge S-360), transmission electron microscopy (TEM, JEM-2011) and X-ray photoelectron spectrometer (XPS, PHI5000C type), respectively. The N2 sorption isotherms were performed on QuadraSorb SIMP Station.The electrode slurry was prepared by stirring of active powder, polyvinylidene fluoride (PVDF) and graphene with a weight ratio of 70![[thin space (1/6-em)]](https://www.rsc.org/images/entities/char_2009.gif) :
:![[thin space (1/6-em)]](https://www.rsc.org/images/entities/char_2009.gif) 15
15![[thin space (1/6-em)]](https://www.rsc.org/images/entities/char_2009.gif) :
:![[thin space (1/6-em)]](https://www.rsc.org/images/entities/char_2009.gif) 15 in 1-methyl-2-pyrrolidinone solvent (NMP) (99%, Aldrich). The slurry was then applied onto copper foil and dried under vacuum at 100 °C for 12 h, and the mass loading of copper foil wafer (radius is 6 mm) is about 0.56–0.59 mg. Coin-type CR2032 half-cells were assembled in glove box with the H2O/O2 content below 0.1 ppm. Li foils was used as counter electrodes, with porous polypropylene membrane as separators, and 1.0 mol LiPF6 in a mixture of ethylene carbonate and dimethyl carbonate with a volume ratio of 1
15 in 1-methyl-2-pyrrolidinone solvent (NMP) (99%, Aldrich). The slurry was then applied onto copper foil and dried under vacuum at 100 °C for 12 h, and the mass loading of copper foil wafer (radius is 6 mm) is about 0.56–0.59 mg. Coin-type CR2032 half-cells were assembled in glove box with the H2O/O2 content below 0.1 ppm. Li foils was used as counter electrodes, with porous polypropylene membrane as separators, and 1.0 mol LiPF6 in a mixture of ethylene carbonate and dimethyl carbonate with a volume ratio of 1![[thin space (1/6-em)]](https://www.rsc.org/images/entities/char_2009.gif) :
:![[thin space (1/6-em)]](https://www.rsc.org/images/entities/char_2009.gif) 1 as electrolyte. The constant current charge–discharge test was carried out at room temperature by LAND test system (CT2001A) within voltage range of 0.01–3.0 V vs. Li+/Li. Cyclic voltammetry tests were performed at CHI 760e electrochemical workstation.
1 as electrolyte. The constant current charge–discharge test was carried out at room temperature by LAND test system (CT2001A) within voltage range of 0.01–3.0 V vs. Li+/Li. Cyclic voltammetry tests were performed at CHI 760e electrochemical workstation.
3. Results and discussion
3.1. Characterizations of as-prepared GaOOH nanorods
 | ||
| Fig. 2 (a) SEM image, (b and c) TEM images, (d) HRTEM image and (e) corresponding SAED pattern of GaOOH nanorods. | ||
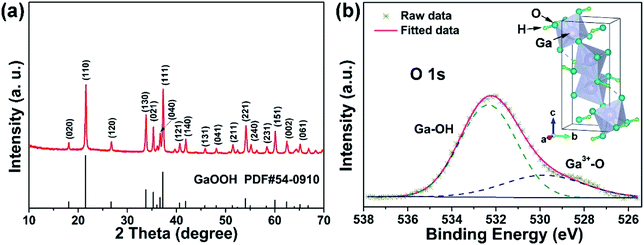
Based on these structure and morphology results, the synthesized GaOOH is orthorhombic structure without impurity, and shows nanoscale one-dimension rod morphology, which is expected to possess promising electrochemical storage performance. Fig. S2† shows the results of N2 adsorption–desorption measurements for the weight GaOOH sample, and its specific surface area was calculated to be ∼8.999 m2 g−1 and the pore diameter is 16.65 nm. The intricate pore structure of the GaOOH nanorods can offer plenty nanochannels to promote the contact between electrolyte and surface–interface interactions.35
3.2. Superior lithium-ion storage properties
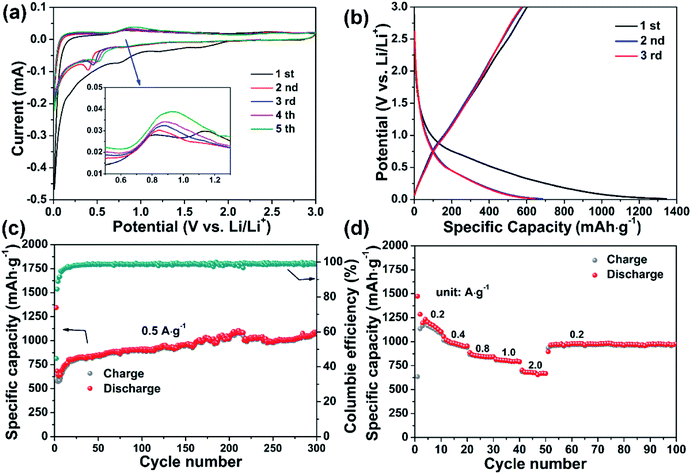
Fig. 3a shows the cyclic voltammograms (CVs) of the GaOOH electrode for the initial five cycles, in voltage range of 0.01–3.0 V vs. Li/Li+ at a scan rate of 0.1 mV s−1. For the first cathodic cycle, there are three peaks located at 1.61 V, 1.18 V and 0.75 V, which can be assigned to intercalation of Li+ into GaOOH crystal, followed by conversion reaction between GaOOH and Li+, and finally end with alloy reaction to generate Li–Ga alloy. Upon anodic scan, there are two peaks located at 0.81 and 1.19 V, attributed to de-alloy process, accompanied by the oxidation process between Ga and O or OH, respectively. The CV curves from the 2nd Cycle onward are quite different from the first cycle, implying that there exist irreversible structural change and formation of solid electrolyte interface (SEI) film upon the initial cathodic cycle. The CV curves are overlapped with each other from the 2nd cycles, indicating the reversibility of GaOOH electrode. This reaction mechanism including first intercalation, conversion reaction and alloy process are similar to previous reports in Ga2O3, Ga2S3, CoGa2S4 and NiGa2O4, etc.14,19,21,36Fig. 3b shows the galvanotactic discharge–charge (GDC) profile for the first three cycles at a current density of 0.5 A g−1, in which the GaOOH electrode shows a discharging capacity of 1343 mA h g−1 and charging capacity of 602 mA h g−1 upon the initial cycle, with coulombic efficiency of 45%. This low coulombic efficiency is in accordance with the observation in above CV curves, which is attributed to irreversible structural change and formation of solid electrolyte interface (SEI) film. Upon the subsequent cycles, the GDC profiles are in high coincidence, as CV curves, showing excellent reversibility. To further confirm the consistency between GDC and CV profiles, dQ/dV vs. potential curves derived from GDC is shown in Fig. S3.† Obtained from dQ/dV vs. potential curves, the peaks at 0.75 and 1.14 V represents the alloy and de-alloy process, and are consistent well with aforementioned results of CVs.
Combining above results and previous works on Ga-based material, the electrochemical reactions of the GaOOH with lithium can be described with reaction equations as follows:37,38
| GaOOH + 3Li+ + 3e− → Ga + Li2O + LiOH | (1) |
 | (2) |
 | (3) |
| GaLi + Li+ + e− → GaLi2 | (4) |
The cycling performance of GaOOH at the current density of 0.5 A g−1 is shown in Fig. 3c. GaOOH electrode can retain a reversible capacity of 1089 mA h g−1 after 300 cycles. It should be noted here that although the initial coulombic efficiency is not so high, the coulombic efficiency of GaOOH electrode reaches to 99% immediately. And the phenomenon of the reversible capacities increase gradually with the increasing cycles can be widely found in many other transition metal materials for LIBs anode, which may due to the growth of a conductive polymer films, thus enhancing lithium ion storage.29,39–41 Moreover, the morphology of the products after 1st, 9th and 100th discharge/charge cycles are shown in Fig. S4,† implying that the rod morphology can be retained very well even after 100 cycles. This cycling performance is superior to most reported Ga-based material applied to lithium ion battery, as compared in Table S1.† The rate performance of GaOOH electrode are evaluated at various currents in the range of 0.2–2 A g−1, as shown in Fig. 3d. The GaOOH electrode delivers a high discharge capacity of 1206, 992, 849, 790 and 639 mA h g−1 at the current density of 0.2, 0.4, 0.8, 1.0 and 2.0 A g−1, respectively. When the current density is shifted back to 0.2 A g−1, the discharge capacity can turn back to 1042 mA h g−1. This result strongly indicates the superior rate performance of our prepared GaOOH nanorods.
3.3. Mechanistic understanding of the capacitance contribution on rate performance
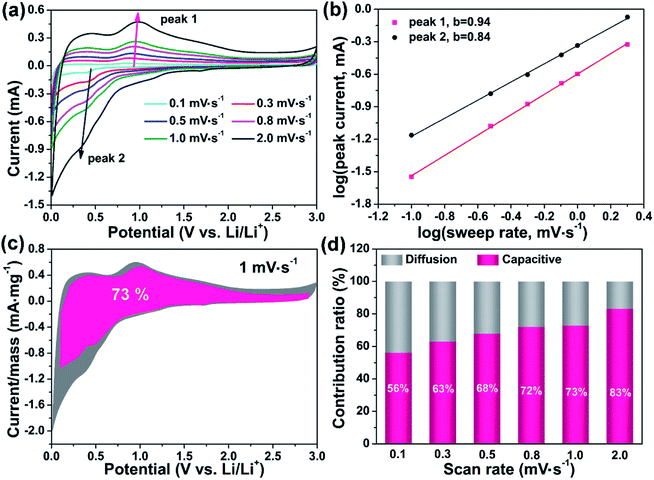
To understand the underlying mechanism responsible for the high-rate performance, the cyclic voltammograms (CVs) curves are employed at different scan rates, as shown in Fig. 4a. The typical alloy and de-alloy reaction peaks are picked, labeled as peak 1 and 2, respectively, from which we can see that the intensity of these peaks both increase with the scan rate increasing from 0.1 mV s−1 to 2 mV· s−1. Moreover, the position of two peaks shows little variation, implying the ultra-fast charge transfer in the process. Specifically, based on previous reports, the relationship between current density (i) and scan rate (v) can be expressed as follow:41| i = avb | (5) |
| log(i) = b × log(v) + log(a) | (6) |
Fig. 4b shows the plots of log(i) and log(v) of GaOOH electrode, where the b-value is linear fitted. The b-value of the peak 1 and 2 are calculated to be 0.94 and 0.84, respectively. Based on above analysis, these calculated values mean that large capacitance contribution is involved in GaOOH electrode. The quantitative analysis is used to determine the specific diffusion-controlled and capacitive capacity contribution. The Li+ capacitive contribution ratios are calculated by separating the current response i at a fixed potential V, which can be translated into diffusion-controlled reactions (k2v1/2) and capacitive effects proportional to the scan rate v, according to following equation:42
| i = k1v + k2v1/2 | (7) |
Moreover, to better identify the role of graphene playing in the capacity contribution of graphene, the electrochemical performance of GaOOH electrodes using super P (mark as GaOOH-super P) rather than graphene as conductive agent has been carried out. Compared with the data from Fig. S6–S8,† the pseudocapacitive contribution for GaOOH which using graphene as conductive is slightly higher than the GaOOH-super P, which implying that the total capacitance is originated from the co-contribution of GaOOH and graphene, and graphene is not playing the major role in the contribution for pseudocapacitance. The rate performance of GaOOH-super P has been tested. As shown in Fig. S9,† GaOOH-super P shows a high discharge capacity of 1186 mA h g−1 while a poor charge capacity of 304 mA h g−1 at the 1st cycle at 0.2 A g−1, and even in the next few cycles, the discharge capacity drastically dropped to 46 mA h g−1 at 0.2 Ah g−1. The significant reduction in capacity may seriously affect subsequent capacity recovery, leading to a poor discharge/charge capacity of GaOOH. After all, the comparation of the rate performance for GaOOH-super P with GaOOH-graphene suggests that graphene plays a more significant role in cycle stability rather than the in the contribute some capacity.
4. Conclusions
In summary, the lithium storage performance of uniform GaOOH nanorods has been revealed for the first time. The as-prepared GaOOH anodes show a highly stable capacity of about 1089 mA h g−1 at current density of 0.5 A g−1 upon 300 cycles with better rate performance, being superior to most reported Ga-based anode materials. This is attributed to the boosted pseudocapacitance contribution as high as approximately 83% at scan rate of 2.0 mV s−1. These findings may stimulate more interest in designing novel oxyhydroxide-based anodes for the applications in the new-generation LIBs.Conflicts of interest
There are no conflicts to declare.Acknowledgements
This work was financially supported by the National Natural Science Foundation of China (No. 51871059, 51601040, 51572948, 51671001 and 51971002) and International Science and Technology Cooperation Project of Anhui Provincial Key Research and Development Program (No. 201904b11020028).Notes and references
- M. Armand and J. M. Tarascon, Nature, 2008, 451, 652 CrossRef CAS.
- F. Fang, Y. Li, Q. Zhang, L. Sun, Z. Shao and D. Sun, J. Power Sources, 2010, 195, 8215 CrossRef CAS.
- W. M. Zhang, X. L. Wu, J. S. Hu, Y. G. Guo and L. J. Wan, Adv. Funct. Mater., 2008, 18, 3941 CrossRef CAS.
- X. Liu, N. Wu, C. Cui, Y. Li and P. Zhou, Mater. Lett., 2015, 149, 12 CrossRef CAS.
- L. Fang, J. Feng, X. Shi, T. Si, Y. Song, H. Jia, H. W. Li, Y. Li and Q. Zhang, Chem. Commun., 2019, 55, 10476 RSC.
- H. Tabassum, R. Zou, A. Mahmood, Z. Liang, Q. Wang, H. Zhang, S. Gao, C. Qu, W. Guo and S. Guo, Adv. Mater., 2018, 30, 1705441 CrossRef.
- W. Xia, A. Mahmood, R. Zou and Q. Xu, Energy Environ. Sci., 2015, 8, 1837 RSC.
- Y. Li, G. Zhou, F. Fang, X. Yu, Q. Zhang, L. Ouyang, M. Zhu and D. Sun, Acta Mater., 2011, 59, 1829 CrossRef CAS.
- S. Zheng, Y. Li, F. Fang, G. Zhou, X. Yu, G. Chen, D. Sun, L. Ouyang and M. Zhu, J. Mater. Res., 2010, 25, 2047 CrossRef CAS.
- Y. Li, X. Ding and Q. Zhang, Sci. Rep., 2016, 6, 31144 CrossRef CAS.
- H. Li, Z. Wang, L. Chen and X. Huang, Adv. Mater., 2009, 21, 4593 CrossRef CAS.
- L. Ji, Z. Lin, M. Alcoutlabi and X. Zhang, Energy Environ. Sci., 2011, 4, 2682 RSC.
- H. Tian, F. Xin, X. Wang, W. He and W. Han, J. Materiomics, 2015, 1, 153 CrossRef.
- X. Tang, X. Huang, Y. Huang, Y. Gou, J. Pastore, Y. Yang, Y. Xiong, J. Qian, J. D. Brock, J. Lu, L. Xiao, H. D. Abruna and L. Zhuang, ACS Appl. Mater. Interfaces, 2018, 10, 5519 CrossRef CAS.
- X. Liu, N. Wu, C. Cui, Y. Li and P. Zhou, Mater. Lett., 2015, 149, 12 CrossRef CAS.
- C. M. Park, J. H. Kim, H. Kim and H. J. Sohn, Chem. Soc. Rev., 2010, 39, 3115 RSC.
- J. Saint, M. Morcrette, D. Larcher and J. M. Tarascon, Solid State Ionics, 2005, 176, 189 CrossRef CAS.
- R. D. Deshpande, J. Li, Y. T. Cheng and M. W. Verbrugge, J. Electrochem. Soc., 2011, 158, 845 CrossRef.
- P. Wang, M. Liu, F. Mo, Z. Long, F. Fang, D. Sun, Y. N. Zhou and Y. Song, Nanoscale, 2019, 11, 3208 RSC.
- Y. Song, Y. Li, L. Zhu, Z. Pan, Y. Jiang, P. Wang, Y. N. Zhou, F. Fang, L. Hu and D. Sun, J. Mater. Chem. A, 2018, 6, 1086 RSC.
- F. Mo, Z. Lian, B. Fu, Y. Song, P. Wang, F. Fang, Y. N. Zhou, S. Peng and D. Sun, J. Mater. Chem. A, 2019, 7, 9051 RSC.
- V. Etacheri, R. Marom, R. Elazari, G. Salitra and D. Aurbach, Energy Environ. Sci., 2011, 4, 3243 RSC.
- Y. Song, Y. Cao, J. Wang, Y. N. Zhou, F. Fang, Y. Li, S. P. Gao, Q. F. Gu, L. Hu and D. Sun, ACS Appl. Mater. Interfaces, 2016, 8, 21334 CrossRef CAS.
- P. Lu, Y. Sun, H. Xiang, X. Liang and Y. Yu, Adv. Energy Mater., 2018, 8, 1702434 CrossRef.
- H. Qi, L. Cao, J. Li, J. Huang, Z. Xu, Y. Cheng, X. Kong and K. Yanagisawa, ACS Appl. Mater. Interfaces, 2016, 8, 35253 CrossRef CAS.
- J. Jiang, Y. Li, J. Liu and X. Huang, Nanoscale, 2011, 3, 45 RSC.
- Y. Li, Q. Zhang, F. Fang, Y. Song, D. Sun, L. Ouyang and M. Zhu, RSC Adv., 2014, 4, 983 RSC.
- D. M. Liu, Q. J. Tan, C. Gao, T. Sun and Y. T. Li, Int. J. Hydrogen Energy, 2015, 40, 6600 CrossRef CAS.
- Z. Cai, L. Xu, M. Yan, C. Han, L. He, K. M. Hercule, C. Niu, Z. Yuan, W. Xu, L. Qu, K. Zhao and L. Mai, Nano Lett., 2014, 15, 738 CrossRef.
- Y. C. Zhang, X. Wu, X. Y. Hu and Q. F. Shi, Mater. Lett., 2007, 61, 1497 CrossRef CAS.
- B. S. Naidu, M. Pandey, J. Nuwad, V. Sudarsan, R. K. Vatsa, R. J. Kshirsagar and C. G. S. Pillai, Inorg. Chem., 2011, 50, 4463 CrossRef.
- Y. H. Hsu, A. T. Nguyen, Y. H. Chiu, J. M. Li and Y. J. Hsu, Appl. Catal., B, 2016, 185, 133 CrossRef CAS.
- J. Zhang, S. Jiao, Y. Wan, S. Gao, D. Wang and J. Wang, CrystEngComm, 2018, 20, 4329 RSC.
- D. K. Kim, P. Muralidharan, H. W. Lee, R. Ruffo, Y. Yang, C. K. Chan, H. Peng, R. A. Huggins and Y. Cui, Nano Lett., 2008, 8, 3948 CrossRef CAS.
- M. Yang, C. Sun, T. Wang, F. Chen, M. Sun, L. Zhang, Y. Shao, Y. Wu and X. Hao, ACS Appl. Energy Mater., 2018, 19, 4708 CrossRef.
- Y. Huang, J. Ouyang, X. Tang, Y. Yang, J. Qian, J. Lu, L. Xiao and L. Zhuang, ACS Appl. Mater. Interfaces, 2019, 11, 8025 CrossRef CAS.
- S. B. Patil, I. Y. Kim, J. L. Gunjakar, S. M. Oh, T. Eom, H. Kim and S. J. Hwang, ACS Appl. Mater. Interfaces, 2015, 7, 18679 CrossRef CAS.
- Y. Song, Y. Li, L. Zhu, Z. Pan, Y. Jiang, P. Wang, Y. N. Zhou, F. Fang, L. Hu and D. Sun, J. Mater. Chem. A, 2018, 6, 1086 RSC.
- S. Laruelle, S. Grugeon, P. Poizot, M. Dollé, L. Dupont and J.-M. Tarascon, J. Electrochem. Soc., 2002, 149, A627 CrossRef CAS.
- S. Grugeon, S. Laruelle, L. Dupont and J.-M. Tarascon, Solid State Sci., 2003, 5, 895 CrossRef CAS.
- V. Augustyn, P. Simon and B. Dunn, Energy Environ. Sci., 2014, 7, 1597 RSC.
- J. Wang, J. Polleux, J. Lim and B. Dunn, J. Phys. Chem. C, 2007, 111, 14925 CrossRef CAS.
Footnote |
| † Electronic supplementary information (ESI) available. See DOI: 10.1039/c9ra07064h |
| This journal is © The Royal Society of Chemistry 2019 |


