 Open Access Article
Enhanced thermal conductivity and tensile strength of Al–17Si–3.5Cu with SiC-nanoparticle addition
D. P. Jiang * and
J. K. Yu
State Key Laboratory of Solidification Processing, Northwestern Polytechnical University, Xi'an 710072, P.R. China. E-mail: jdp@mail.nwpu.edu.cn; Fax: +86-29-88492642
First published on 28th October 2019
Abstract
The morphology and size of primary Si has a significant influence on the thermal conductivity (TC) and strength of Al–17Si–3.5Cu. In this study, the effect of a 1–3 wt% SiC nanoparticle (SiCnps) addition on TC and tensile strength of Al–17Si–3.5Cu was investigated. Nanoparticles distributed at the interface between primary Si and Al led to a significant refinement of primary Si; for example, a primary Si size of 2 μm with 3 wt% SiCnps addition was achieved. TC of SiCnps/Al–17Si–3.5Cu improved with an increase in nanoparticle content. Nanoparticles distributed at the interface between Si and Al reduced the interfacial thermal resistance. Thus, the effective TC of eutectic Si increased. Owing to the refinement of the primary Si and the increased interfacial thermal resistance, originating from the high content of SiCnps at the interface, the effective TC of primary Si decreased. Compared with Al–17Si–3.5Cu, contribution to the improvement of the TC of SiCnps/Al–17Si–3.5Cu resulted mainly from eutectic Si. Due to the refinement of primary Si, the tensile strength of SiCnps/Al–17Si–3.5Cu improved with an increase in SiCnps content. When the SiCnps content was 3 wt%, the yield strength, ultimate tensile strength and elongation of SiCnps/Al–17Si–3.5Cu were ∼176 MPa, 418 MPa and 7%, respectively, which were improved by 37.5%, 53.7% and 218%, respectively, when compared with Al–17Si–3.5Cu.
1. Introduction
Hypereutectic Al–Si alloys are used extensively in many fields, such as automobiles, electronic packaging and military applications, due to their low mass, high corrosion resistance, high thermal conductivity (TC) and outstanding mechanical performance.1–4 In the vehicle field, as piston materials, hypereutectic Al–Si–Cu alloys are required to have a high TC and excellent mechanical properties. Primary Si, an important phase that consists of hypereutectic Al–Si–Cu alloys, exerts a significant influence on the properties of the alloy. Coarse and irregular primary Si deteriorates the mechanical properties and machinability of Al alloys. As a result, numerous efforts have been made to refine primary Si. The refinement of primary Si in hypereutectic Al–Si alloys can be achieved by various methods, such as Al–P, Al–Fe–P and the Al–Ti–P–C master alloy, rare element and ultrasonic treatment, and electromagnetic stirring.5–14 Although primary Si can be refined by traditional processes, many methods are either complex and cannot be used on a large scale, or they reduce the TC of the Al–Si alloy considerably.Recent investigations have shown that Al2O3 nanoparticles can refine the primary Si and eutectic Si in the local hypereutectic Al–Si–Cu alloy area simultaneously.15 Compared with these traditional methods, nanoparticle addition can refine primary Si and activate the Orowan strengthening effect in hypereutectic Al–Si alloys. Al2O3 nanoparticles hinder the primary Si phase from growing by distributing on the Al/Si interface, thereby leading to the refinement of primary Si. It has also been illustrated that nanoparticles in hypoeutectic Al–Si alloys lead to the refinement of the eutectic Si phase, such as TiCN and AlN.16,17 However, some investigations have focused on the effect of nanoparticles on the microstructures of hypereutectic Al–Si, inadequate studies exist on the effect of nanoparticles on the TC of hypereutectic Al–Si. Although nanoparticles have refined the microstructures of Al–Si, the effect of nanoparticles on the TC of the alloy remains unclear. Therefore, additional research focused on the TC of Al–Si is required.
Hasselman reported that the TC of composites is related to the thermal boundary resistance (TBR).18 The effective medium theory that was derived by Nan considered the interfacial thermal resistance and the size and shape of the reinforcement to predict the TC of composites that were reinforced with a low fraction of microsized particles.19 However, effective medium theory is not applicable for particles at the nanoscale. Due to increased interface scattering and because the nanoparticle size approaches the phonon mean-free path, TC of the nanoparticle and matrix are not equal to their bulk values. To address this problem, a modified effective medium approximation (EMA) that considers the increased interfacial scattering and interfacial thermal resistance based on Nan's model was proposed by Minnich and Chen.20 According to the modified EMA, the interfacial density and TBR affect the TC of the nanocomposite. In addition, Huang et al. investigated the effect of the standard deviation (SD) of the nanoparticle size as well as the chemical bonding of the TC of nanocomposites.21,22 SD can significantly affect the TC of nanocomposites. In addition, thermal boundary resistance can be greatly reduced with an increase in the chemical bonding ratio between two crystal phases.
These models are based on a uniform distribution of nanoparticles in the matrix. At present, several investigations are available on the TC of nanocomposites for graphene and CNT.23–25 The distribution of reinforcement is uniform in graphene- and CNT-reinforced metal matrix nanocomposites fabricated by solid-state or other processes. Unlike graphene- and CNT-reinforced nanocomposites, during solidification, nanoparticles will redistribute and segregate in the matrix via a liquid process. Furthermore, the redistribution of nanoparticles leads to the refinement of microstructures and the modification of microstructures' morphology. Thus, additional research on the effect of nanoparticles on TC is necessary.
To address these issues, we studied Al–17Si–3.5Cu with the addition of 1.0–3.0 wt% SiC nanoparticles (SiCnps) via a solidification process combined with ultrasonic treatment. And interfacial nanocomposites layer was proposed to investigate the effect of SiCnps distributed at the interface between Si and Al on TC. The refinement of primary Si with SiCnps addition in Al–Si alloys was studied via high-resolution transmission electron microscopy (HRTEM).
2. Experimental procedure
Al–17Si–3.5Cu samples (Fu Metal Material Co., Ltd.) were melted in an alumina crucible by using an electric resistance furnace, and 1.0, 2.0 and 3.0 wt% SiCnps (Shanghai Yao Tian Nano Material Co., Ltd.) were added to the molten Al alloys. The average particle size of the added SiCnps was 30 nm. The apparatus and solidification process combined with ultrasonic treatment that was used to prepare the SiCnps/Al–17Si–3.5Cu materials is shown in detail in ref. 26. The melt was cast by using a cast-iron cylindrical mold that had been preheated to 400 °C. For comparison, Al–17Si–3.5Cu samples without SiCnps addition were prepared by an equivalent process.Metallographic samples were cut at 51 mm from the bottom of the castings, and then ground with 240-, 600- and 1200-grit emery papers in turn and polished with a 2 μm diamond polishing agent. The samples were etched lightly by using a 0.5% aqueous HF solution. Samples were also etched deeply for 2 h to reveal the three-dimensional morphology of the Si phase. The Si-phase morphology was characterized by using scanning electron microscopy (SEM; FEI Nova NanoSEM 450, Hillsboro, USA) with energy dispersive X-ray spectroscopy (EDS; INCA X-Max, Oxford, UK). X-ray diffraction (XRD; PANalytical X'Pert PRO, Almelo, The Netherlands) was used to analyze the crystalline phases of the Al–17Si–3.5Cu and SiCnps/Al–17Si–3.5Cu. The distributions of SiCnps in the eutectic Al regions and at the interface between Si and Al were investigated using HRTEM with high-angle annular dark-field scanning (HAADF, Tecani F30 G′, FEI, Hillsboro, OR, USA). A laser-flash apparatus (LFA 447, NETZSCH, Selb, Germany) was used to investigate TC of the SiCnps/Al–17Si–3.5Cu samples at room temperature. Results were based on an average of the three samples. To test the TC of the samples, all samples were machined into 3 mm-thick, 12.7 mm-diameter disks. The sample density was determined by the Archimedes method from three repeated measurements, and the specific heat capacity was calculated by the rule of mixtures based on the fraction of each phase. The TC of the samples was the product of the density, thermal diffusivity and specific heat capacity. Image Pro-Plus soft (IPP, Media Cybernetics, Rockville, MD, USA) was applied to measure the average size of primary Si. According to ASTM B108-03a, all samples were cast as tensile bars with a gauge diameter of 5 mm and machined to the specified dimensions according to ASTM E8 with a diameter of 3 mm and a gauge length of 15 mm for the tensile test. A tensile testing machine (INSTRON 3382, INSTRON, Norwood, MA, USA) was used to study the tensile properties of the samples with a crosshead speed of 1 mm min−1. All results were based on the average of three samples.
3. Results
3.1 Effect of SiCnps on the microstructure of SiCnps/Al–17Si–3.5Cu
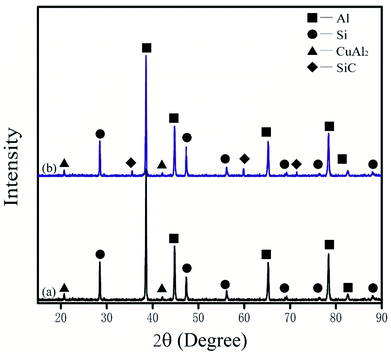
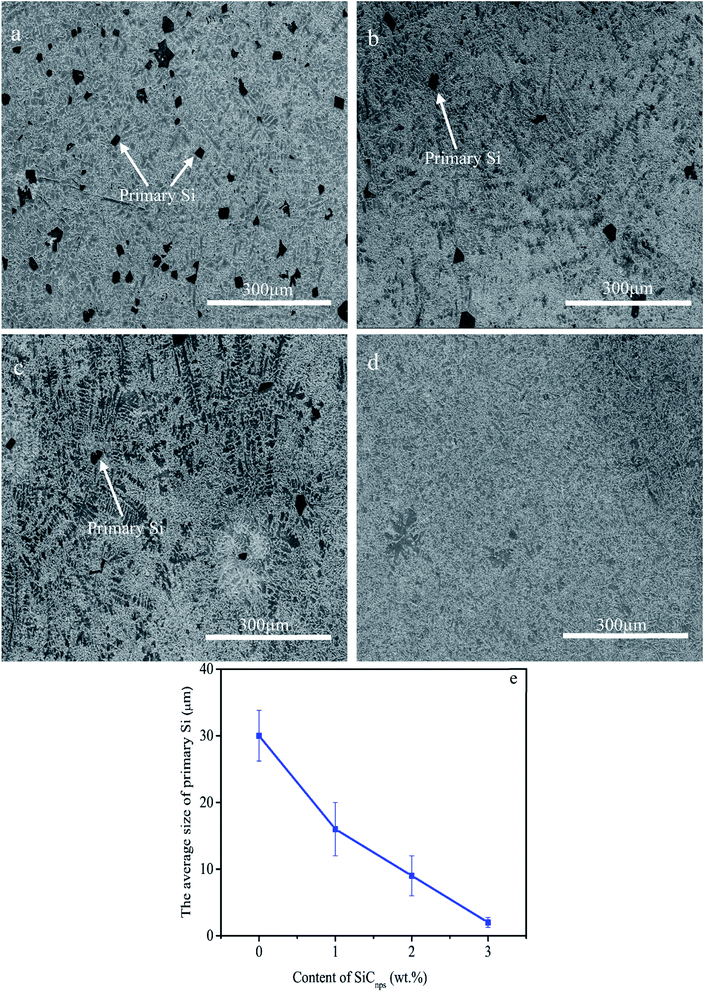
The XRD patterns that were obtained for Al–17Si–3.5Cu and the 3.0 wt% SiCnps/Al–17Si–3.5Cu samples are shown in Fig. 1(a) and (b), respectively. Fig. 1(a) shows that Al–17Si–3.5Cu is composed of Al, CuAl2 and Si phases only. Fig. 1(b) shows that the SiCnps/Al–17Si–3.5Cu sample includes four crystalline phases, namely, Al, CuAl2, Si and SiC. A comparison of Fig. 1(a) and (b) indicates that SiCnps was incorporated into the Al–17Si–3.5Cu alloy, and in addition to CuAl2, no other intermetallic crystalline materials were detected. Therefore, the SiCnps did not react visibly with the matrix alloy.The morphology and size of primary Si in the Al–17Si–3.5Cu with different SiCnps additions are presented in Fig. 2. The microstructures of Al–17Si–3.5Cu were characterized by coarse primary Si with an average grain size of 30 μm and eutectic microstructures. Fig. 2(b)–(d) show that with an increase in SiCnps content from 1 wt% to 3 wt%, the primary Si is refined significantly and the coarse primary Si content per unit volume is reduced clearly. When the addition of SiCnps reaches 3 wt%, the coarse primary Si is refined completely. Hence, the addition of SiCnps leads to a refinement of primary Si in the hypereutectic Al–Si alloy. The average size variation of primary Si with the SiCnps content is shown in Fig. 2(e). When the SiCnps content is 1 wt%, the average size of the primary Si is 16 μm, which is reduced by 47% compared with Al–17Si–3.5Cu. The average size of the primary Si with 3 wt% SiCnps addition was reduced to 2 μm, which is a 97% decrease compared with Al–17Si–3.5Cu.
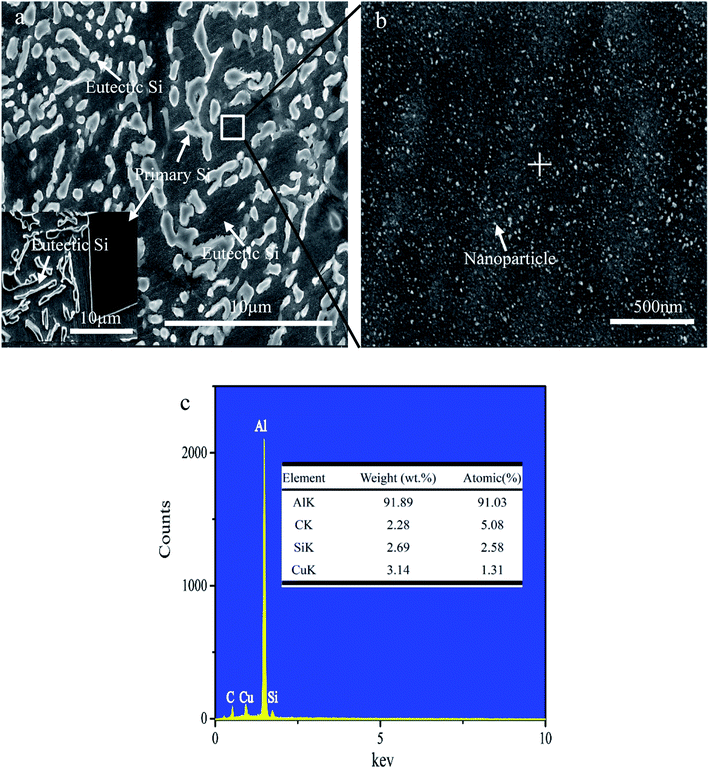
Fig. 3 shows SEM images of the 3.0 wt% SiCnps/Al–17Si–3.5Cu. Fig. 3(a) shows that compared with Al–17Si–3.5Cu, the primary Si and eutectic Si were refined extensively in 3.0 wt% SiCnps/Al–17Si–3.5Cu. The cross-sectional morphology of many Si phases became spheroidized. Because of the nanoparticles, the morphology of some Si phases transformed from platelets to more curved and rounder. Fig. 3(b) shows that the nanoparticles distribute uniformly and are dispersed completely in the eutectic Al. To obtain the nanoparticle composition, EDS spot analysis of the area marked with “+” in Fig. 3(b) was conducted. According to the EDS results, four elements were detected: C, Si, Al and Cu. According to the XRD results, CuAl2 is present in 3.0 wt% SiCnps/Al–17Si–3.5Cu. Hence, the Cu signal comes from CuAl2. Therefore, in addition to CuAl2, SiCnps are present in eutectic Al.
To illustrate the distribution of nanoparticles, microstructures and elemental mapping micrographs for 3.0 wt% SiCnps/Al–17Si–3.5Cu are shown in Fig. 4. Fig. 4(a) shows the SiCnps/Al–17Si–3.5Cu microstructures. Fig. 4(b)–(e) reveal the spatial distributions of C, Al, Si and Cu, respectively. Elemental C that is derived mainly from SiCnps is distributed mainly around the Si phase and on the Si phase surface. The remaining elemental C distributes in the eutectic Al. The elemental Cu is not enriched around the Si phase. This result shows that the refinement of Si phase results because of nanoparticle distribution on the surface of the Si phase.
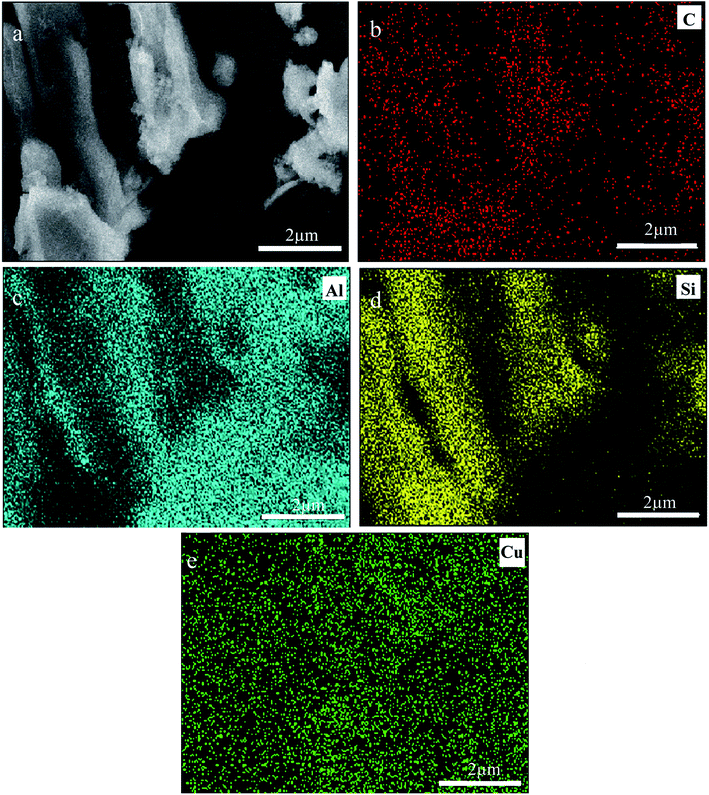 | ||
| Fig. 4 Microstructures and elemental mapping micrographs of 3.0 wt% SiCnps/Al–17Si–3.5Cu. (a) SEM images, and (b–e) mapping micrographs for elemental C, Al, Si and Cu, respectively. | ||
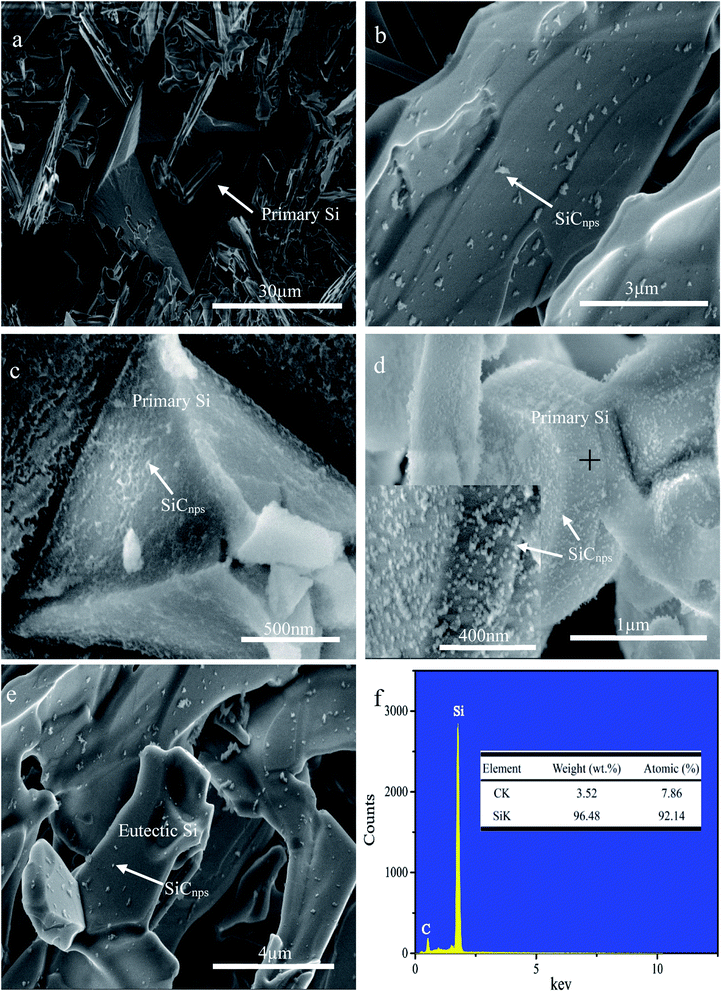
SEM images of samples that were etched for 2 h are presented in Fig. 5. The three-dimensional morphology of the Si phase in Al–17Si–3.5Cu is characterized by a large thin plate-like eutectic Si and blocky primary Si. No particles adhere to the Si phase surface. Fig. 5(b) shows that some nanoparticles are distributed on the surface of primary Si in 1 wt% SiCnps/Al–17Si–3.5Cu. Fig. 5(b)–(d) show that with an increasing SiCnps content in the Al–17Si–3.5Cu, nanoparticle distribution on the primary Si surface increased. Fig. 5(d) shows that the primary Si is encapsulated by a dense layer of nanoparticles. The inset in Fig. 5(d) shows that nanoparticles on the surface of primary Si are clear, and except for some nanoclusters, the nanoparticles are well dispersed. Fig. 5(e) shows that some nanoparticles distribute on the surface of eutectic Si in 3 wt% SiCnps/Al–17Si–3.5Cu. Because of the increase of nanoparticles in alloys, some nanoparticles distribute at the interface between eutectic Si and Al. To obtain the nanoparticle composition, EDS analysis was conducted on the marked area in Fig. 5(d). Fig. 5(f) shows that only elemental Si and C were detected. Therefore, nanoparticles on the primary Si surface are SiC. This result is consistent with the EDS element mapping analysis in Fig. 4.
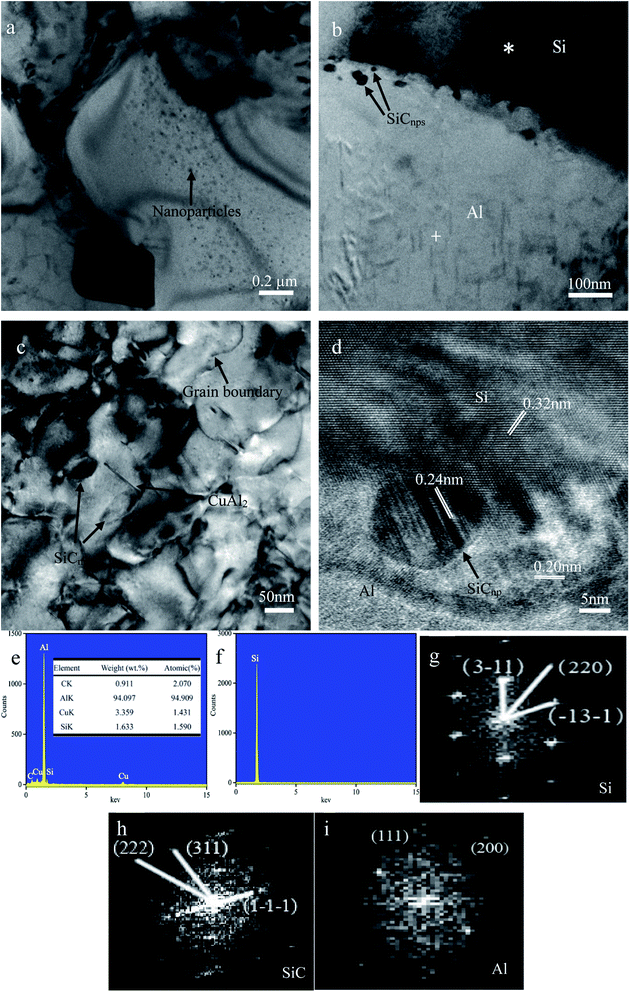
TEM analysis was used to investigate the effect of SiCnps on the primary Si microstructure. Fig. 6 shows a series of HRTEM images from 3.0 wt% SiCnps/Al–17Si–3.5Cu. Fig. 6(a) shows that many nanoparticles, including CuAl2 and SiCnps, are distributed in the SiCnps/Al–17Si–3.5Cu microstructures. Fig. 6(b) shows that some nanoparticles are distributed at the interface between the primary Si and Al. Nanoparticles at the interface between Si and Al restrict primary Si growth by inhibiting solute atom diffusion.16 Fig. 6(c) shows that some acicular and granular second phases, namely CuAl2 and SiCnps, respectively, are distributed in the eutectic Al. The nanoparticles are dispersed uniformly. Fig. 6(d) shows a HRTEM image of the interface between the primary Si and Al. SiCnp with a 30 nm diameter and an interplanar distance of 0.24 nm distributes at the interface between primary Si with an interplanar distance of 0.32 nm and Al with an interplanar distance of 0.20 nm. Fig. 6 (e) and (f) show EDS analysis of the area marked by “+” and “*” in (b), respectively. From Fig. 6(e), four elements were detected: C, Si, Al and Cu. It indicates that two phases, SiC and CuAl2, exist in eutectic Al. This result is consistent with Fig. 6(b). According to EDS results shown in Fig. 6(f), it can be seen that this phase is the Si phase. Fig. 6 (g)–(i) show the fast Fourier transformation of primary Si, SiCnp and Al, respectively. The electron diffraction spot of the phases in Fig. 6 (g)–(i) was consistent with that of Si, SiCnps and Al, respectively. No interfacial product was observed at the interface between the SiCnp and Si and Al.
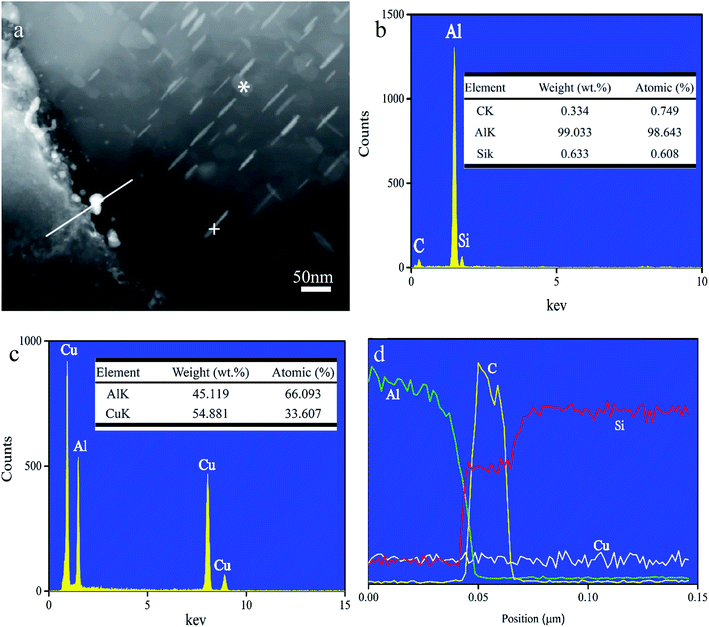
To evaluate the interface between the primary Si and Al, HADDF images of the interface between primary Si and Al are shown in Fig. 7(a). Many nanoparticles are distributed at the interface and acicular phase, and some granular phases exist in the eutectic Al. Fig. 7(b) and (c) show EDS spot analysis of the area marked with “*” and “+” in Fig. 7(a), respectively. EDS results of the granular phase show that elemental Al, Si and C are present. In addition to Al, Si and C, the signal derives mainly from SiCnp. According to the EDS result in Fig. 7(c), elemental Cu and Al originate from the acicular phase. Combined with XRD analysis, the acicular phase is CuAl2. EDS line-scanning results of the interface between the primary Si and Al are shown in Fig. 7(d). The line-scanning results show that the elements Si and C are enriched at the interface between the primary Si and Al, which indicates that the SiCnps that is distributed at the interface leads to the refinement of primary Si. These results are consistent with the EDS mapping analysis in Fig. 4.
3.2 Effect of SiCnps on TC and tensile strength of SiCnps/Al–17Si–3.5Cu
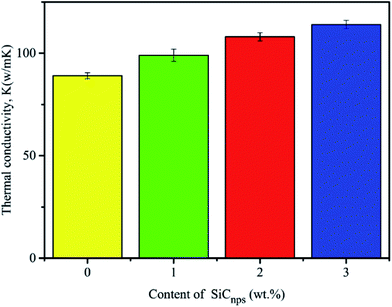
Fig. 8 shows that the TC of 1 wt% SiCnps/Al–17Si–3.5Cu, 2 wt% SiCnps/Al–17Si–3.5Cu, 3 wt% SiCnps/Al–17Si–3.5Cu and Al–17Si–3.5Cu was 98, 108, 114 and 89 W m−1 K−1, respectively. As the content of SiCnps increases, the TC of the SiCnps/Al–17Si–3.5Cu increases. Compared with Al–17Si–3.5Cu, the improvement in TC of the 3 wt% SiCnps/Al–17Si–3.5Cu was 28%, which indicates that the TC of SiCnps/Al–17Si–3.5Cu can be improved by SiCnps addition.Engineering stress–strain curves and tensile properties of the SiCnps/Al–17Si–3.5Cu and Al–17Si–3.5Cu are shown in Fig. 9. The tensile properties of the SiCnps/Al–17Si–3.5Cu are improved significantly compared with those of the Al–17Si–3.5Cu. The yield strength (YS), ultimate tensile strength (UTS) and elongation (EL) of SiCnps/Al–17Si–3.5Cu increased with the increase in SiCnps content. The YS, UTS and EL of 3 wt% SiCnps/Al–17Si–3.5Cu were ∼176 MPa, 418 MPa and 7% respectively, which represents an increase of 37.5%, 53.7% and 218% compared with the Al–17Si–3.5Cu, respectively. The primary Si is refined significantly because of SiCnps distribution at the interface between the primary Si and Al, which results in an improvement in the UTS, YS and EL of the SiCnps/Al–17Si–3.5Cu. Furthermore, nanoparticles can inhibit dislocation motion, which leads to the Orowan strengthening effect. Compared with previous work,12,27–30 the average size of the primary Si in this study is smaller, and the UTS and TC of our samples are higher than those previously reported, as shown in Fig. 9(c).
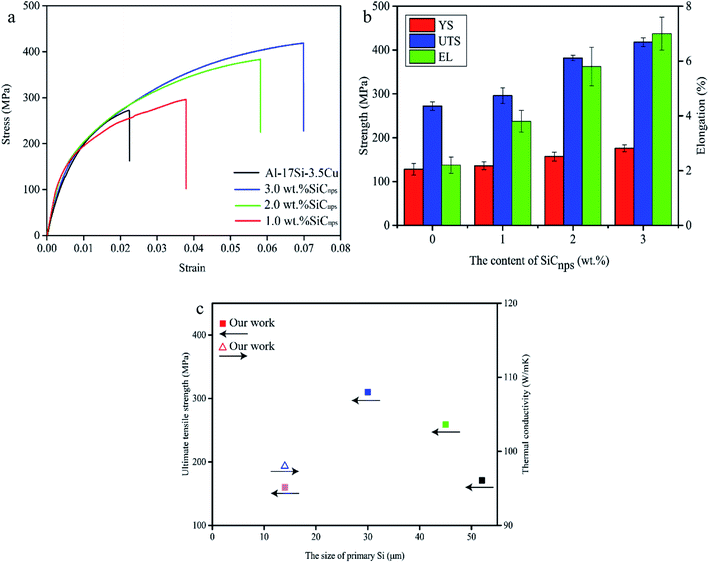 | ||
| Fig. 9 Engineering stress–strain curves and tensile properties of SiCnps/Al–17Si–3.5Cu and Al–17Si–3.5Cu: (a) engineering stress–strain curves, and (b) UTS, YS and elongation; and (c) comparison of UTS and TC with other reports of hypereutectic Al–Si alloys.12,27–30 | ||
4. Discussion
4.1 Analyses of thermal properties
The previous analysis indicates that an increase in TC of SiCnps/Al–17Si–3.5Cu occurs because the addition of SiCnps and the distribution of SiCnps at the interface between the primary Si and Al leads to refinement of the primary Si. Therefore, the SiCnps distribution is closely related to TC of the sample. To investigate the effect of SiCnps distribution at the interface between Si and Al on SiCnps/Al–17Si–3.5Cu TC, SiCnps distributed at the interface between Si and Al were assumed to be a SiCnps/Al nanocomposite layer. Fig. 10 shows that compared with the Al/Si interface in Al–17Si–3.5Cu, hypothetical interfacial nanocomposite layers were added to the Al/Si interface in SiCnps/Al–17Si–3.5Cu.To simplify the analysis, Si phases, including primary Si, eutectic Si and SiCnps, are regarded as spheres. CuAl2 and Al are regarded as a whole, that is, a matrix phase.
Interfacial scattering needs to be considered in nanocomposites in which the characteristic nanoparticle length is of the order of or smaller than the phonon mean free path (MFP). Because of boundary scattering of the energy carriers in the nanoparticles with the nanoparticle surface, the TC kp of the nanoparticles is given by:31
 | (1) |
We consider the scattering of energy carriers in the matrix with the nanoparticle surface, and the TC km of the matrix is as follows:31
 | (2) |
 | (3) |
By replacing kp and km in Nan's model with their corresponding modified values, given by eqn (1) and (2), the TC K of the matrix, considering of interfacial scattering and interfacial thermal resistance, is determined by:
 | (4) |
Compared with Al–17Si–3.5Cu, after SiCnps addition, the TC increment Δk* of the matrix phase is given by:
 | (5) |
where fm is the SiCnps content in the matrix and α is a dimensionless parameter that is determined from:
| α−1 = km/kp + ak/r | (6) |
However, due to the concentration of nanoparticles distributed at the interface being higher than that of nanoparticles in the matrix, the size distribution of the nanoparticles has a great influence on the interfacial nanocomposite layer. Nanoparticle size distribution obeys a log-normal distribution, and ln![[thin space (1/6-em)]](https://www.rsc.org/images/entities/char_2009.gif) μ and σ are the mean and standard deviation of the variable's natural logarithm, respectively. Considering the size distribution of the nanoparticles, the average TC of the nanoparticles and the matrix are expressed as follows, respectively:21
μ and σ are the mean and standard deviation of the variable's natural logarithm, respectively. Considering the size distribution of the nanoparticles, the average TC of the nanoparticles and the matrix are expressed as follows, respectively:21
 | (7) |
 | (8) |
 of the interfacial nanocomposites layer is determined as:
 | (9) |
Furthermore, to simplify the calculation, the SD of a log-normal distribution is as follows:
 | (10) |
The total interfacial thermal resistance R between Al and Si in SiCnps/Al–17Si–3.5Cu is expressed as:
| R = RSi–in + RAl–in + Rin | (11) |
 | (12) |
We assume that the relationship for diffuse scattering of the interfacial thermal resistance R from Chen33 can be used:
 | (13) |
The specific heat Cin of the interfacial nanocomposites layers is defined as:31
| Cin = (1 − f)CAl + fCSiC | (14) |
The combined phonon group velocity vin of the interfacial nanocomposites layers is determined as:34
 | (15) |
The effective TC  of Si is expressed as:
 | (16) |
The thermal resistance R between Al and Si in Al–17Si–3.5Cu is given by:
 | (17) |
Fig. 11 shows the effective TC of Si based on the parameters in Table 1 for SiCnps/Al–17Si–3.5Cu. Fig. 11(a) shows that compared with the effective TC of Si in Al–17Si–3.5Cu, the effective TC of Si is improved with a SiCnps addition, especially when the content of SiCnps is within a certain range (i.e. 0–0.5 for SD = 10); the Si size and SD have a significant effect on the effective TC of the Si. Fig. 11(b) shows that the interfacial thermal resistance between Si and Al increases with an increase in nanoparticle content at the interface between Si and Al, and decreases with an increase in SD in SiCnps/Al–17Si–3.5Cu. The rate of increase for the interfacial thermal resistance with SiCnps content in a certain range (i.e. 0–0.4 for SD = 30) is slow. Due to the small number of nanoparticles added, the number of nanoparticles at the interface is not very high. Hence, the number of nanoparticles at the interface has little effect on the thermal resistance between Si and Al. Moreover, many studies illustrate that Si can form a strong chemical bond with SiC.38,39 According to thermal boundary resistance, which decreases with increased bonding,22 the interfacial thermal resistance between SiC and Si is lower than that between Si and Al. The interfacial bonding between SiC and Al is similar to that between SiC and Si. Hence, the interfacial thermal resistance between Si and Al in SiCnps/Al–17Si–3.5Cu is consistently lower than in Al–17Si–3.5Cu, which indicates that nanoparticles can reduce the interfacial thermal resistance between Si and Al.
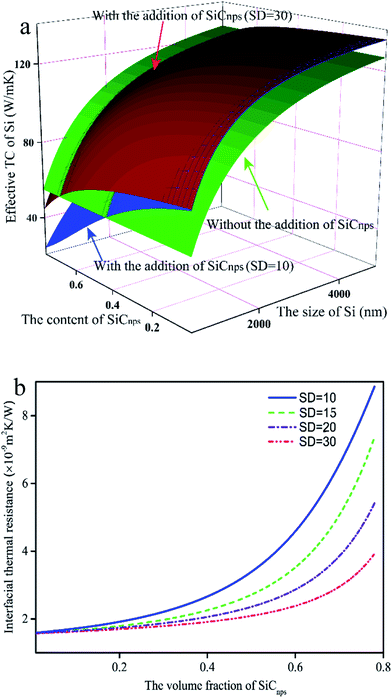 | ||
| Fig. 11 (a) Effective TC of Si vs. the size of Si, the standard deviation (SD) and the content of SiCnps, and (b) the interfacial thermal resistance vs. SD and the content of SiCnps. | ||
| Materials | TC (w m−1 K−1) | Density (g cm−3) | Specific heat (J g−1 K−1) | Phonon velocity (m s−1) | Young's moduli (GPa) | Shear moduli (GPa) |
|---|---|---|---|---|---|---|
| Al | 237 | 2.7 | 0.895 | 3595 | 68 | 26 |
| SiC | 248 | 3.21 | 0.29 | 11![[thin space (1/6-em)]](https://www.rsc.org/images/entities/char_2009.gif) 600 600 |
448 | 192 |
| Si | 148 | 2.33 | 0.7 | 5860 | — | — |
The key to analyze the influence of nanoparticles on the TC of SiCnps/Al–17Si–3.5Cu is to analyze the influence of nanoparticles on the TC of primary Si and eutectic Si.
Because nanoparticles lead to a refinement of primary Si, the TC increment Δk of primary Si in SiCnps/Al–17Si–3.5Cu with SiCnps addition is shown as:
 | (18) |
 and d are the interfacial thermal resistance between the primary Si and Al and the size of primary Si in SiCnps/Al–17Si–3.5Cu, respectively, and RAl–Si and d0 are the interfacial thermal resistance between the primary Si and Al and the size of primary Si in Al–17Si–3.5Cu, respectively.
Because the effect of nanoparticles on the size of eutectic Si is not as significant as that of primary Si, the size of eutectic Si can be considered to be unchanged. The TC increment Δk of eutectic Si in SiCnps/Al–17Si–3.5Cu with the addition of SiCnps is determined by:
 | (19) |
Fig. 12 shows the TC increment of primary Si, eutectic Si and the matrix in SiCnps/Al–17Si–3.5Cu. Fig. 12(a) shows that the effective TC of primary Si decreases with SiCnps addition, but is reduced less with an increase in SD. The increasing content of nanoparticles lead to an increase in the number of nanoparticles at the interface between the primary Si and Al, which in turn refined the primary Si. The refinement of primary Si and the high content of nanoparticles at the interface between primary Si and Al lead to the increase in interfacial thermal resistance. When the content of nanoparticles is high, the SD has a significant effect on the effective TC of the primary Si. The increase in SD leads to less of a reduction in the effective TC of primary Si. Therefore, compared with that of Al–17Si–3.5Cu, the effective TC of primary Si decreased. Fig. 12(b) shows that compared with Al–17Si–3.5Cu, the effective TC of the eutectic Si increased in SiCnps/Al–17Si–3.5Cu. Because fewer nanoparticles were present on the surface of eutectic Si compared with those on the surface of primary Si, the effect of nanoparticles on the size of the eutectic Si was less significant compared with the primary Si. Furthermore, compared with Al–17Si–3.5Cu, because of a small number of nanoparticles on the surface of eutectic Si, the interfacial thermal resistance between Al and eutectic Si was reduced considerably. When the size of the eutectic Si was smaller and the SD was large, the increase in the effective TC of the eutectic Si, which was caused by the nanoparticles, was more significant. Thus, the effective TC of the eutectic Si was improved with the SiCnps addition. Fig. 12(c) shows that the TC of the matrix decreases with an increase in SiCnps content. When 3 wt% nanoparticles were added to the alloys, the content of nanoparticles in the matrix was less than 3%, because a large number of nanoparticles were distributed at the Si/Al interface. Therefore, compared with that of the matrix in Al–17Si–3.5Cu, the TC of the matrix in 3 wt% SiCnps/Al–17Si–3.5Cu decreased by less than 3%. Because a small number of nanoparticles were added to the alloys, nanoparticles caused a limited decrease in the matrix TC. In addition, the above analysis shows that the TC of the alloys will decrease significantly when a large number of nanoparticles are added.
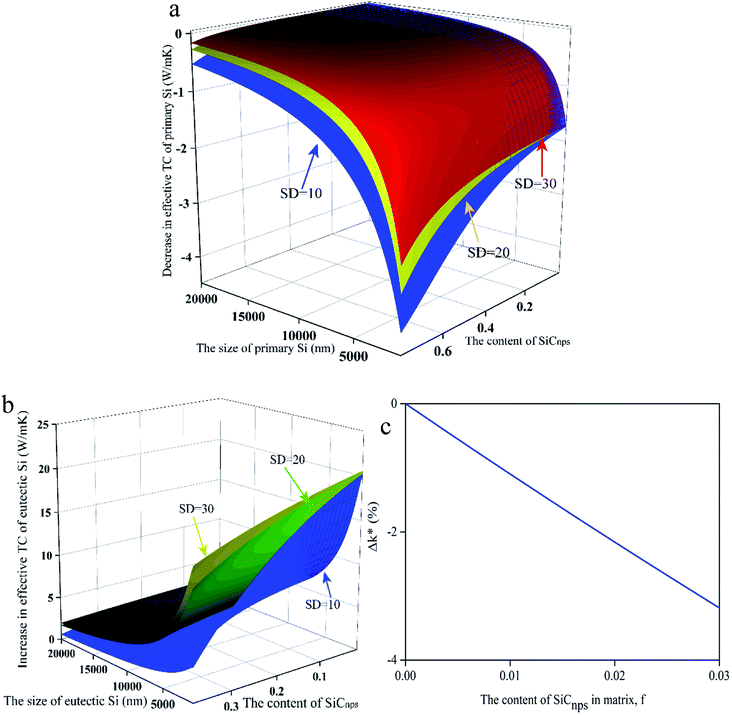 | ||
| Fig. 12 Compared with Al–17Si–3.5Cu, TC increment of primary Si (a), eutectic Si (b) and the matrix (c) in SiCnps/Al–17Si–3.5Cu respectively. | ||
The improvement in the TC of SiCnps/Al–17Si–3.5Cu resulted mainly from the eutectic Si. Compared with Al–17Si–3.5Cu, nanoparticles led to a decrease in the effective TC of primary Si and the matrix in SiCnps/Al–17Si–3.5Cu. However, due to the small interfacial thermal resistance between the eutectic Si and Al, the effective TC of the eutectic Si increased significantly.
4.2 Analyses of tensile properties
The significant improvement of YS, UTS and EL of SiCnps/Al–17Si–3.5Cu compared with Al–17Si–3.5Cu resulted because of: (i) the refinement of primary Si. Nanoparticles at the interface between primary Si and Al restrict the growth of the primary Si, which leads to a refinement of primary Si.2 Numerous investigations have illustrated that crack initiation originates easily from primary Si and eutectic Si.12,30 Furthermore, cracks may originate from and propagate along the interface between the primary Si and Al. The refinement of primary Si can reduce or eliminate premature crack initiation and fracture. The quantitative relationship of the intrinsic fracture stress (σf) on the primary Si is given by Griffith:30
 | (20) |
5. Conclusions
SiCnps/Al–17Si–3.5Cu, in conjunction with an addition of 1 wt%, 2 wt% and 3 wt% SiCnps, was prepared in this study, and the effect of SiCnps on the microstructures, TC and tensile properties of SiCnps/Al–17Si–3.5Cu was investigated.SiCnps addition leads to the refinement of primary Si. When SiCnps is 3 wt%, the primary Si is refined significantly. Nanoparticles at the interface between the Si and Al hinder the growth of the primary Si, which leads to the refinement of primary Si.
The TC of SiCnps/Al–17Si–3.5Cu increases with an increase in SiCnps content. Nanoparticles can reduce the interfacial thermal resistance between Si and Al and increase the effective TC of the Si. The improvement in the TC of SiCnps/Al–17Si–3.5Cu results mainly from eutectic Si.
The YS, UTS and EL of SiCnps/Al–17Si–3.5Cu increase with an increase in SiCnps content. When the SiCnps content is 3 wt%, the YS, UTS and EL of SiCnps/Al–17Si–3.5Cu are ∼176 MPa, 418 MPa, and 7%, respectively. Because of the refinement of the primary Si, the tensile strength of SiCnps/Al–17Si–3.5Cu is improved significantly.
Data availability
The raw data required to reproduce these findings are available to download from DOI: 10.17632/xgmh9x8yp8.2.Conflicts of interest
There are no conflicts to declare.Acknowledgements
This research did not receive any specific grant from funding agencies in the public, commercial or not-for-profit sectors.References
- J. C. Jie, Q. C. Zou, J. L. Sun, Y. P. Lu and T. J. Li, Acta Mater., 2014, 72, 57–66 CrossRef CAS.
- D. P. Jiang and J. K. Yu, J. Mater. Res. Technol., 2019, 8, 2930–2943 CrossRef CAS.
- C. Xue and J. K. Yu, Mater. Des., 2014, 53, 74–78 CrossRef CAS.
- G. R. Li and L. S. Wang, Appl. Surf. Sci., 2019, 483, 472–480 CrossRef CAS.
- H. Qiao, X. Z. Zhu, T. Gao, Y. Y. Wu and X. F. Liu, J. Mater. Sci. Technol., 2015, 31, 391–396 CrossRef CAS.
- T. Gu, Y. Pan, T. Lu, C. Li and J. Pi, Mater. Charact., 2018, 141, 115–119 CrossRef CAS.
- J. G. Jung, T. Y. Ahn, Y. H. Cho, S. H. Kim and J. M. Lee, Acta Mater., 2018, 144, 31–40 CrossRef CAS.
- M. Zuo, D. Zhao, X. Teng, H. Geng and Z. Zhang, Mater. Des., 2013, 47, 857–864 CrossRef CAS.
- T. Gao, X. Zhu, H. Qiao and X. F. Liu, J. Alloys Compd., 2014, 607, 11–15 CrossRef CAS.
- J. Nie, Y. Zhao, Y. Li and F. Wang, J. Alloys Compd., 2019, 777, 8–17 CrossRef CAS.
- J. Xiong, H. Yan, S. Zhong and M. Bi, Metals, 2019, 9, 108 CrossRef.
- Q. Li, T. Xia, Y. Lan, P. F. Li and L. Fan, Mater. Sci. Eng., A, 2013, 588, 97–102 CrossRef CAS.
- X. Chen, Y. Zhong, T. Zheng, Z. Shen, J. Wang, L. Fan, Y. Zhai, M. Peng, B. Zhou, W. Ren, Z. Lei, Z. Ren and Q. He, J. Alloys Compd., 2017, 714, 39–46 CrossRef CAS.
- J. Sun, L. Zhang, G. Wu, W. Liu, Z. Hu and A. Chen, J. Mater. Process. Technol., 2015, 225, 485–491 CrossRef CAS.
- H. Choi, H. Konishi and X. Li, Mater. Sci. Eng., A, 2012, 541, 159–165 CrossRef CAS.
- K. Wang, H. Y. Jiang, Y. X. Wang, Q. D. Wang, B. Ye and W. J. Bing, Mater. Des., 2016, 95, 545–554 CrossRef CAS.
- K. Hu, X. Ma, T. Gao, Q. F. Xu, Z. Qian, Y. Wu and X. F. Liu, J. Alloys Compd., 2018, 765, 113–120 CrossRef CAS.
- D. P. H. Hasselman and L. F. Johnson, J. Compos. Mater., 1987, 21, 508–515 CrossRef.
- C. W. Nan, R. Birringer, D. R. Clarke and H. Gleiter, J. Appl. Phys., 1997, 81, 6692–6699 CrossRef CAS.
- A. Minnich and G. Chen, Appl. Phys. Lett., 2007, 91, 073105 CrossRef.
- C. L. Huang, X. Qian and R. G. Yang, Europhys. Lett., 2017, 117, 24001 CrossRef.
- Z. Huang, C. L. Huang, D. X. Wu and Z. H. Rao, Comput. Mater. Sci., 2018, 149, 316–323 CrossRef CAS.
- X. Gao, H. Yue, E. Guo, H. Zhang, X. Lin, L. Yao and B. Wang, Powder Technol., 2016, 301, 601–607 CrossRef CAS.
- K. Chu, X. Wang, F. Wang, Y. Li, D. Huang, H. Li, W. Ma, F. Liu and H. Zhang, Carbon, 2018, 127, 102–112 CrossRef CAS.
- A. Miranda, N. Barekar and B. J. McKay, J. Alloys Compd., 2019, 774, 820–840 CrossRef CAS.
- D. P. Jiang and J. K. Yu, Metals, 2018, 8, 572 CrossRef.
- H. Choi and X. Li, J. Mater. Sci., 2012, 47, 3096–3102 CrossRef CAS.
- P. J. Ward, H. V. Atkinson, P. R. G. Anderson, L. G. Elias, B. Garcia, L. Kahlen and J.-M. Rodriguez-ibabe, Acta Mater., 1996, 44, 1717–1727 CrossRef CAS.
- K. Y. Sastry, L. Froyen, J. Vleugels, E. H. Bentefour and C. Glorieux, Int. J. Thermophys., 2004, 25, 1611–1622 CrossRef CAS.
- C. L. Xu, H. Y. Wang, Y. F. Yang and Q. C. Jiang, Mater. Sci. Eng., A, 2007, 452, 341–346 CrossRef.
- J. Ordonez-Miranda, R. G. Yang and J. J. Alvarado-Gil, Appl. Phys. Lett., 2011, 98, 233111 CrossRef.
- Y. Liu, Y. Dan, Y. Bian and Z. Han, J. Alloys Compd., 2019, 801, 136–141 CrossRef CAS.
- G. Chen, Phys. Rev. B, 1998, 57, 14958–14973 CrossRef CAS.
- S. J. Poon and K. Limtragool, J. Appl. Phys., 2011, 110, 114306 CrossRef.
- C. Wang, H. Bai, C. Xue, X. Tong, Y. Zhu and N. Jiang, RSC Adv., 2016, 6, 107483–107490 RSC.
- W. R. L. Lambrecht, B. Segall, M. Methfessel and M. van Schilfgaarde, Phys. Rev. B, 1991, 44, 3685–3694 CrossRef CAS.
- S. Tamura, Y. Tanaka and H. J. Maris, Phys. Rev. B, 1999, 60, 2627–2630 CrossRef CAS.
- X. S. Cong, P. Shen, Y. Wang and Q. C. Jiang, Appl. Surf. Sci., 2014, 317, 140–146 CrossRef CAS.
- G. W. Liu, M. L. Muolo, F. Valenza and A. Passerone, Ceram. Int., 2010, 36, 1177–1188 CrossRef CAS.
| This journal is © The Royal Society of Chemistry 2019 |

