 Open Access Article
The synthesis of a Cu(II) Schiff base complex using a bidentate N2O2 donor ligand: crystal structure, photophysical properties, and antibacterial activities†
Yaning Guo *,
Xiaobing Hu,
Xinli Zhang,
Xiaohua Pu and
Yue Wang
College of Chemistry and Chemical Engineering, Baoji University of Arts and Sciences, Shaanxi Province Key Laboratory of Phytochemistry, Baoji, Shaanxi 721013, P. R. China. E-mail: ggyn1997@163.com
First published on 17th December 2019
Abstract
In this paper, a new mononuclear Cu(II) complex was synthesized by using a bidentate N2O2 Schiff base ligand, (E)-2-bromo-4-chloro-6-[(2,6-dimethylphenylimino)methyl]phenol (HL), with a copper(II) salt in a methanol solvent. The structures of the HL ligand and the complex were characterized by Fourier transform infrared (FTIR) spectroscopy, single crystal X-ray diffraction (SCXD), and elemental analysis (EA). The Cu(II) center in the complex is four-coordinated by a bidentate N2O2 donor ligand, forming slightly distorted square planar geometry. The detailed studies of their photophysical properties such as UV-Vis and fluorescence were done and the X-ray diffraction (XRD) patterns were investigated in the powder forms. Density functional theory calculations were carried out on both the HL ligand and the Cu(II) complex to investigate the changes in the structural parameters and energies of the HOMO and LUMO. The results demonstrated that the HOMO and LUMO were effectively separated with the benzene ring of 2,6-dimethylbenzenamine as the donor unit and the benzene ring of 3-bromo-5-chlorosalicylaldehyde as well as the chelate ring as the acceptor unit. The effective HOMO–LUMO separation helps induce intramolecular charge transfer from the HOMO to the LUMO. The HOMO–LUMO energy gap become smaller when the Schiff base ligand coordinated with Cu(II) ions, which was most likely due to the Cu(II) perturbation effect. These theoretical calculations supported the experimentally observed results. The antibacterial activities of the HL ligand and the Cu(II) complex were studied on Staphylococcus aureus, Pseudomonas aeruginosa, and Escherichia coli. The obtained data confirmed their potent antimicrobial activity and the Cu(II) complex had the MIC value of 1.25 mmol L−1 against Escherichia coli.
1 Introduction
Schiff bases, as an important series of organic ligands, are capable of coordinating with metal ions to form stable chelates via the N atom of the azo-group and other donors such as –OH and –NH2. Benefiting from the facile synthetic pathways, excellent coordination ability, good biological activities, and photochemical properties, the application of Schiff bases involves not only pharmaceuticals such as antibiotics,1 antivirals,2,3 and anti-inflammatory4 drugs, but also photoelectric and dye materials.5,6 Furthermore, due to their preparative accessibility, structural variety, and potential properties, it is considered that metal complexes with Schiff base ligands are one of the most important stereochemical models in metal coordination chemistry.It is well-known that mono- and binuclear metal complexes with the d10 metal centre exhibit excellent photoluminescence that has great prospects in optoelectronic devices. In recent years, Schiff base complexes with d10 metals have been extensively explored.7–9 The copper ion has biological activity and it is an essential trace element in the human body; it plays critical and crucial roles in many biological processes and enzyme regulation as well as in the structural and functional enhancement of proteins. Copper complexes have medical applications, with some of them being used as model molecules for biological oxygen carrier systems10 and some having applications in the field of analytical chemistry.11 To date, many copper complexes with N, O-donor Schiff base ligands and related analogues have been reported owing to their effective biological activities and other functional properties. Asma A. Alothman et al. reported that the synthesized hexadentate N2O4 donor Schiff base ligands and their respective Co(II), Ni(II), and Cu(II) complexes have shown general antimicrobial ability by the agar well diffusion assay.12 I. Buta et al. studied the magnetic properties of the polynuclear copper(II) complexes of hexadentate N, O-donor Schiff base ligands and found that the central copper(II) ions in these complexes lie in a square planar or a square pyramidal environment.13 K. Sarmah et al. discovered some other unique properties of copper complexes from N, O-Schiff base ligands,14 such as gelation property. These studies indicate that copper complexes from N, O-Schiff base ligands have promising applications in various fields.15,16
With the exception of metal ions, the properties of compounds can be manipulated by intra- or intermolecular forces such as coordinate bond, hydrogen bond, π⋯π stacking, and the interaction of the electron transfer ECT. These interactions can incorporate Schiff bases and their metal complexes into discrete small molecules, oligomers, or polymers, leading to the influence on the self-assembly process in the supramolecular frameworks and some properties. Further, such incorporation can provide metal complexes derived from Schiff base ligands with some intriguing properties and have been widely applied in analytical,17 catalytic,18,19 luminescent,20,21 medicinal and functional molecular-based chemistry.22,23 Now, efforts have shifted towards exploring their application in photonic applications,24 especially in the field of luminescent Schiff bases complexes.25–29
Therefore, as an extension of the research on the structural characterization and properties of Schiff bases complexes with ligands containing O and N atoms, in this contribution, a bidentate N2O2 Schiff base ligand and its Cu(II) complex were synthesized and characterized by single crystal X-ray diffraction, elemental analysis and FTIR spectroscopy. The detailed study of their photophysical properties such as UV-Vis and fluorescence were done. Density functional calculations were carried out to investigate the changes in the structural parameters, and the energies of HOMO and LUMO. To further investigate the biological activity of the HL ligand and the Cu(II) complex, the antibacterial activities against Staphylococcus aureus, Pseudomonas aeruginosa, and Escherichia coli were evaluated.
2 Experimental
2.1 Materials and measurements
Elemental analyses were performed on a Vario EL-III analyzer. Fourier transform infrared (FTIR) spectra were obtained at room temperature using a PerkinElmer infrared spectrometer. 1H NMR spectra were recorded using a Varian 400 MHz NMR spectrometer with deuterated dimethyl sulfoxide (DMSO-d6) as the solvent and tetramethylsilane (TMS) as the internal reference. Crystal structures were determined on a Bruker APEX II CCD area diffractometer. Ultraviolet visible (UV-Vis) absorption spectra were recorded on a UV-2550 spectrometer with a wavelength range of 250–800 nm. Fluorescence spectra were recorded at room temperature using a Horiba Scientific Fluoromax-4 spectrofluorometer with spectroscopic grade DMSO as the solvent. The slit widths of excitation and emission measurement were both 5 nm. The fluorescence spectra of the solutions of the compounds and the reference solutions were optimized by subtracting the solvent peak that was part of the background. Density functional theory (DFT) computations were performed using the Gaussian 09 software package with the B3LYP functional and the 6-31G(d) basis set.3-Bromo-5-chlorosalicylaldehyde and 2,6-dimethylbenzenamine were purchased from J&K Chemical Ltd. All other chemicals were commercial products and used without further purification.
2.2 X-ray structure determination
Crystal structure determination of HL ligand and the Cu(II) complex was carried out on a Bruker APEX II CCD area diffractometer equipped with graphite-monochromatized MoKα (λ = 0.071073 nm) using φ–ω scan technique at different temperatures. The structures were solved by direct methods and refined on F2 by full-matrix least-squares methods using SHELX-97.30,31 All the non-hydrogen atoms were refined anisotropically. The hydrogen atoms were included at geometrically calculated positions and refined using a riding model. The crystal data, experimental details, refinement results, and details of structure determinations are shown in Table 1. The selected bond lengths and bond angles are shown in Table S1,† and the parameters of hydrogen bonds and halogen–halogen interaction for compounds are shown in Table S2.† ESI† for structures of HL and the Cu(II) complex have been deposited with the Cambridge Crystallographic Data Centre (no. 1040318 for HL and 1040317 for Cu(II) complex; E-mail: deposit@ccdc.cam.ac.uk; or http://www.ccdc.cam.ac.uk).| Parameter | Value | |
|---|---|---|
| HL | Cu(II) complex | |
| a Final weighting scheme: w = 1/[σ2(F02) + (0.0335P)2 + 0.0000P], where P = (F02 + 2Fc2)/3 for 1; w = 1/[σ2(F02) + (0.0328P)2 + 0.0000P], where P = (F02 + 2Fc2)/3 for 2. | ||
| Empirical formula | C15H13BrClNO | CuC30H24Br2Cl2N2O2 |
| Formula weight | 338.62 | 738.77 |
| Temperature/K | 133(2) | 153(2) |
| Crystal size/mm | 0.34 × 0.30 × 0.19 | 0.32 × 0.28 × 0.19 |
| Crystal system, space group | Monoclinic, P21/c | Monoclinic, C2/c |
| a, b, c/nm | 1.2621(5), 0.9092(3), 1.3389(5) | 1.0515(2), 1.8508(4), 1.5602(3) |
| α, β, γ/(°) | β = 116.556(4) | β = 106.547(9) |
| V nm−3 | 1.374(9) | 2.9105(10) |
| Dc/g cm−3, Z | 1.637, 4 | 1.686, 4 |
| μ/mm−1 | 3.176 | 3.711 |
| F(000) | 680 | 1468 |
| Index ranges (h, k, l) | −17 ≤ h ≤ 17, −12 ≤ k ≤ 12, −18 ≤ l ≤ 18 | −15 ≤ h ≤ 15, −25 ≤ k ≤ 27, −22 ≤ l ≤ 22 |
| θ range/(°) | 2.81 to 30.03 | 2.95 to 31.51 |
| Reflections collected/unique | 10![[thin space (1/6-em)]](https://www.rsc.org/images/entities/char_2009.gif) 049/3954 049/3954 |
18![[thin space (1/6-em)]](https://www.rsc.org/images/entities/char_2009.gif) 540/4821 540/4821 |
| Absorption correction | Semi-empirical from equivalents | Semi-empirical from equivalents |
| Max. and min. transmission | 0.5911 and 0.4115 | 0.5391 and 0.3831 |
| R, wR [I ≥ 2σ (I)] | 0.0337, 0.0698 | 0.0336, 0.0710 |
| R, wR [all data] | 0.0529, 0.0740 | 0.0422, 0.0751 |
| GOF on F2 | 0.999 | 0.99 |
| (Δρ)max, (Δρ)min/(e·nm−3) | 1143, −645 | 652, −633 |
2.3 Computational details
Density functional theory (DFT) computations were carried out using the Gaussian 09 software package with the B3LYP functional and the 6-31G(d) basis set.32 In the DFT calculations, the geometry of both the HL ligand and the Cu(II) complex were fully optimized in the gas phase without any symmetry constraints using the non-local hybrid density functional B3LYP.333 Results and discussions
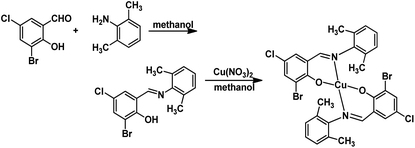
The HL ligand was synthesized in absolute methanol in good yields (82%) and the Cu(II) complex was prepared by reaction of HL ligand with cupric nitrate in methanol, in accordance with the following synthetic procedure. HL ligand is yellow but the Cu(II) complex is black. Note that both the HL ligand and the Cu(II) complex are stable in air at room temperature and soluble in common polar organic solvents such as DMSO, methanol, and ethanol. The elemental analyses are in good agreement with the chemical formulas proposed for them (Scheme 1).3.1 Crystal structure descriptions
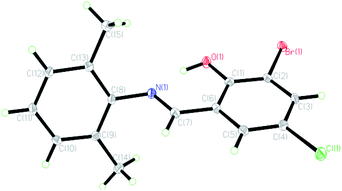
The crystal structures of the HL ligand and the Cu(II) complex with the atomic marks are presented in Fig. 1 and 2, respectively. The HL ligand presents the typical Schiff base molecule features and the complex reveals a mononuclear nature with Cu(II) ion coordinated at the center of two Schiff base species, where all the bond lengths and angles are in normal ranges. On the basis of the crystal data, E configuration with respect to the azomethine –CH![[double bond, length as m-dash]](https://www.rsc.org/images/entities/char_e001.gif) N– bond is exhibited in both the raw ligand and the complex. The distance of C(7)
N– bond is exhibited in both the raw ligand and the complex. The distance of C(7)![[double bond, length as m-dash]](https://www.rsc.org/images/entities/char_e001.gif) N(1) in the Cu(II) complex (0.1292(2) nm) is a little longer than that of the HL ligand (0.1276(3) nm). The dihedral angle of two phenyl rings (ring A, C(1)–C(6); ring B, C(8)–C(13)) of the Cu(II) complex is 89.40(5)°, which is much larger than that of the HL ligand (62.40(6)°). It can be interpreted in the coordination effect and steric effects. Moreover, the whole molecule of the HL ligand is not coplanar with the dihedral angles of 62.40(6)° (A and B) due to the steric effect of two methyl groups.
N(1) in the Cu(II) complex (0.1292(2) nm) is a little longer than that of the HL ligand (0.1276(3) nm). The dihedral angle of two phenyl rings (ring A, C(1)–C(6); ring B, C(8)–C(13)) of the Cu(II) complex is 89.40(5)°, which is much larger than that of the HL ligand (62.40(6)°). It can be interpreted in the coordination effect and steric effects. Moreover, the whole molecule of the HL ligand is not coplanar with the dihedral angles of 62.40(6)° (A and B) due to the steric effect of two methyl groups.
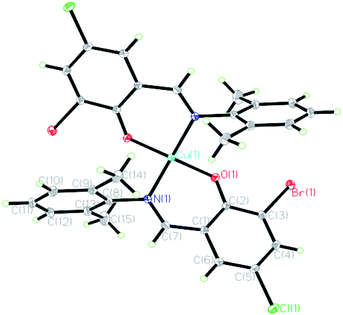 | ||
| Fig. 2 Molecular structure of the Cu(II) complex. Displacement ellipsoids are drawn at the 30% probability level and the hydrogen atoms are omitted for clarity. Symmetry code: #1 −x + 1, y, −z + 1/2. | ||
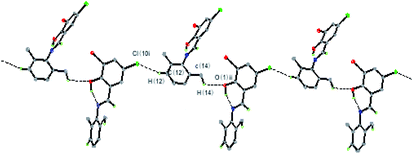
In the crystal structure of the HL ligand, the intermolecular interactions of C–H⋯O and C–H⋯Cl hydrogen bonds appear along the lateral direction. The discrete monomeric molecule is fettered by intermolecular hydrogen bonds C(14)–H(14c)⋯O(1) and C(12)–H(12)⋯Cl(1), leading to a 1D zig-zag chain along the c-axis (Fig. 3, Table S2†). Also, the molecules are further connected to form a 3D network structure by C–H⋯π and C(12)–H(12)⋯Cl (1) interactions (Fig. S3, Table S2†).
In the crystal structure of the Cu(II) complex, the Cu(II) centre is four-coordinated in a square planar geometry, with two phenolate O and two imine N atoms of a Schiff base ligand. Each ligand acts as a bidentate ligand. The geometry around Cu(II) in the complex is in a slightly distorted square planar environment, where the dihedral angle between the two coordination planes defined by O(1)Cu(1)N(1) and O(1)#1Cu(1)N(1)#1 (symmetry: #1: −x + 1, y, −z + 1/2) is 42.6°, which is ascribed to the slight steric effect of the substituent group in the aromatic ring. Bond angles O(1)–Cu(1)–N(1), N(1)–Cu(1)–N(1)#1, and O(1)–Cu(1)–O(1)#1 are 93.13(6), 150.41(9), and 156.81(8)°, respectively, which are also consistent with the observation of the geometry. The dihedral angles A and B are 89.40(6)°, and the phenyl ring plane (ring B) and the chelate ring (O(1)/Cu(1)/N(1)/C(1)/C(2)/C(7), rms deviation of fitted atoms 0.0891) are nearly perpendicular with a dihedral angle of 83.88(5)°, which is interpreted by conjugation effect and large steric hindrance of two adjacent methyl groups on ring A. By contrast, the phenyl ring plane (ring A) and the chelate ring are nearly coplanar with a dihedral angle of 5.91(7)° due to the coordination and conjugation effects. The fact is that the corresponding planes are generated by symmetry. The Cu–O and Cu–N bond distances in the complex are 0.18841(12) and 0.19772(15) nm, respectively, and also have normal values as compared with other similar copper complexes.34,35
In the structure of the Cu(II) complex, discrete monomeric molecules are held together by C–Cl⋯H and weak C–H⋯π interactions (distance H10⋯centroid of ring C1–C6: 0.2826 nm; angle between C(10)-H(10)⋯Cg: 125.4°; distance C(10)⋯Cg: 0.3470 nm) to form a 1D sheet structure (Fig. 4). The hydrogen bonding data are summarized in Table S2.† The results reveal that these interactions not only play an important role in the formation, stability, and crystallization of the Cu(II) complex but also extend molecules into a 1D supramolecular chain.
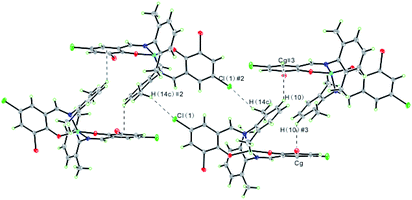 | ||
| Fig. 4 A view of 1D sheet structure in the Cu(II) complex formed through C–H⋯Cl and C–H⋯π interactions. Symmetry code: #2 −x + 1/2, −y + 1/2, −z + 1; #3 x − 1/2, −y + 1/2, z − 1/2. | ||
3.2 FTIR analysis
The FTIR spectrum of the HL ligand showed weak bands in the 3503 cm−1 region, which are assigned to the νOH vibration from the phenolic groups. The absence of the phenolic group bands in the Cu(II) complex indicates that the hydroxyl groups are deprotonated during coordination. The ν(C![[double bond, length as m-dash]](https://www.rsc.org/images/entities/char_e001.gif) N) stretching vibration in the Cu(II) complex (1606 cm−1) is shifted by 12 cm−1 towards lower frequencies compared to the raw Schiff base ligand, implying the coordination of the imine nitrogen atom to the copper ion. The intense band at 1289 cm−1 assigned to phenolic C–O linkage shifts towards higher wave numbers of 1322 cm−1 for the Cu(II) complex, further confirming the involvement of deprotonated phenolic groups in bond formation with the copper atom. The FTIR spectra of the HL ligand and the Cu(II) complex are shown in Fig. S4.†
N) stretching vibration in the Cu(II) complex (1606 cm−1) is shifted by 12 cm−1 towards lower frequencies compared to the raw Schiff base ligand, implying the coordination of the imine nitrogen atom to the copper ion. The intense band at 1289 cm−1 assigned to phenolic C–O linkage shifts towards higher wave numbers of 1322 cm−1 for the Cu(II) complex, further confirming the involvement of deprotonated phenolic groups in bond formation with the copper atom. The FTIR spectra of the HL ligand and the Cu(II) complex are shown in Fig. S4.†
3.3 Thermal analysis
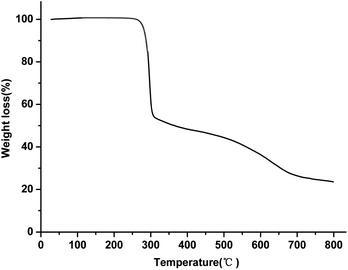
The thermal properties of the Cu(II) complex were investigated under nitrogen atmosphere with a heating rate of 5°C min−1; the temperature range was from RT to 800 °C. As shown in Fig. 5, the Cu(II) complex has a high thermal stability up to 272 °C. The thermograms show two weight-loss steps. The first step is from 272 °C to 308 °C, which is ascribed to the partial loss of the ligand in the Cu(II) complex with a weight loss of 46%. In the second step, a gradual weight loss appeared over a temperature range of 308–800 °C, which may be assigned to the complete decomposition of the ligand around the copper ion. The residue at 800 °C should be due to copper oxide and a small amount of carbon.3.4 Photophysical properties
The UV-Vis spectra of the HL ligand and the Cu(II) complex in DMSO are shown in Fig. 6. The ligand HL displayed two distinct absorption peaks at 262 nm and 340 nm, which were red shifted to 265 nm and 381 nm, respectively, in the Cu(II) complex. This can be attributed to the rigidity, which was enhanced after the ligand coordinated with Cu(II) ion and so, the energy required for electron transition from the ground state to the excited state is reduced. Consequently, the absorption of HL ligand is red shifted after coordination with Cu(II) ion.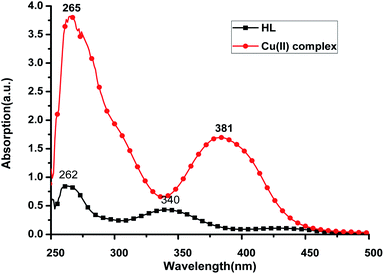 | ||
| Fig. 6 UV-Vis spectra of HL (28.7 μg mL−1) and Cu(II) complex (28.7 μg mL−1) in DMSO at room temperature. | ||
The compounds, regardless of the metal ion, show a lower energy band around 340 nm for HL ligand and 381 nm for the Cu(II) complex, which is due to π → π* transition36,37 that is an intramolecular charge transfer (CT transition) involving the whole molecule and within the azomethine (CH![[double bond, length as m-dash]](https://www.rsc.org/images/entities/char_e001.gif) N) chromophore ground, a band around 262 for the HL ligand and 265 nm for the Cu(II) complex due to n → π* transitions.
N) chromophore ground, a band around 262 for the HL ligand and 265 nm for the Cu(II) complex due to n → π* transitions.
The optical band gaps (Eoptg) were calculated according to the onset of the absorption spectrum, and the values are 2.59 eV and 2.81 eV for HL ligand and the Cu(II) complex, respectively (see Table 2). This indicates that the electron transition of the Cu(II) complex is easier than that of HL ligand. These results are in accordance with the theoretical calculations (Table 2).
| Samples (in DMSO) | λabs (nm) | λex (nm) | λem (nm) | Stokes shifta (nm eV−1) | Eoptg/Eg b(eV) | Calculated c | Electrochemical d | ||
|---|---|---|---|---|---|---|---|---|---|
| HOMO (eV) | LUMO (eV) | HOMO (eV) | LUMO (eV) | ||||||
a Stokes shift in energy (ΔEStokes) is calculated using:  b The optical energy gap (Eoptg) was calculated from the onset of the UV-Vis absorption spectra as Eoptg = 1240/λonset.c The HOMO, LUMO, and energy gaps of the two compounds are calculated using the Gaussian 09 software package at the B3LYP/6-31G(d) level of theory.d The HOMO energy level can be estimated from the onset oxidation potential (Eonset) and Eferrocene as follows: HOMO = −[(Eonset – Eferrocene) + 4.80] (eV) and LUMO = Eoptg + HOMO. b The optical energy gap (Eoptg) was calculated from the onset of the UV-Vis absorption spectra as Eoptg = 1240/λonset.c The HOMO, LUMO, and energy gaps of the two compounds are calculated using the Gaussian 09 software package at the B3LYP/6-31G(d) level of theory.d The HOMO energy level can be estimated from the onset oxidation potential (Eonset) and Eferrocene as follows: HOMO = −[(Eonset – Eferrocene) + 4.80] (eV) and LUMO = Eoptg + HOMO. |
|||||||||
| HL | 262![[thin space (1/6-em)]](https://www.rsc.org/images/entities/char_2009.gif) 340 340 |
450 | 568 | 118/0.57 | 3.20/3.95 | −5.7413 | −1.7875 | −5.61 | −2.41 |
| Cu(II) complex | 265![[thin space (1/6-em)]](https://www.rsc.org/images/entities/char_2009.gif) 384 384 |
460 | 515 | 55/0.29 | 2.81/3.67 | −5.7196 | −2.5552 | −5.65 | −2.84 |
The emission spectra of the HL ligand and the Cu(II) complex were measured in DMSO at room temperature and are shown in Fig. 7. The corresponding optimal excitation wavelength (λex) is about 450 nm for the HL ligand and 460 nm for the Cu(II) complex. The excitation occurs at the lowest energy absorption band in each case. However, it is interesting to note that the highest emission band for the ligand is observed at 568 nm, whereas the emission band maxima for the Cu(II) complex is shifted to lower wavelength of about 515 nm with a blue shift of about 53 nm. These blue shifts suggest the complexation of the Cu(II) complex and the solvent molecules' effect. The Stokes shifts for the HL ligand and the Cu(II) complex in DMSO are 118 nm (0.57 eV) and 55 nm (0.29 eV), respectively (see Table 2). The fluorescence intensity of the Cu(II) complex becomes weaker than that of the HL ligand. The observed quenching is predicted to be due to the metal atom perturbation effect, which can explain the increment in energy dissipation caused by atom perturbation through non-radiative mode, consequently, resulting in the decrease in fluorescence intensity.
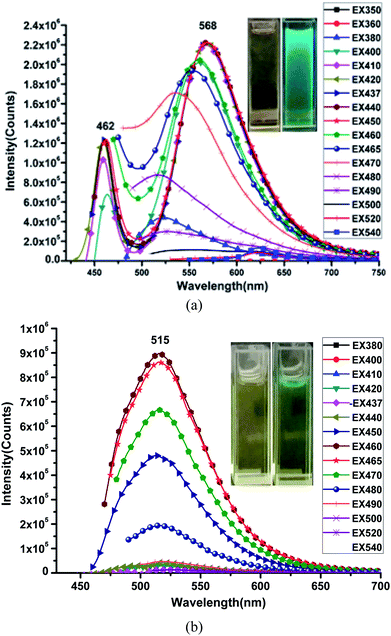 | ||
| Fig. 7 Fluorescence spectra of HL (a) and the Cu(II) complex (b) in DMSO at room temperature. Insets are the optical and fluorescent photographs of HL and the Cu(II) complex in DMSO. | ||
DFT computations (B3LYP/6-31G) were carried out to understand the electronic structures of the HL ligand and the Cu(II) complex; their HOMO and LUMO populations, and their energies on a relative scale are shown in Fig. 8. In case of the HL ligand, in the ground state, the electron density at the HOMO orbitals mainly resides on the π-orbital of the benzene ring in the 2,6-dimethylbenzenamine moieties, while a considerable contribution comes from the π-orbital of the benzene ring of 3-bromo-5-chlorosalicylaldehyde moiety at LUMO. The energy gap between the HOMO and LUMO is 3.95 eV for the HL ligand. In case of the Cu(II) complex, the electron density on the HOMO orbital comes mainly from the ligand π orbitals, which are for the 2,6-dimethylbenzenamine moieties. But the electron density at the LUMO orbitals mainly resides on the ligand π-orbitals of the benzene ring in the 3-bromo-5-chlorosalicylaldehyde moiety. The energy gap between the HOMO and LUMO is 3.16 eV in the Cu(II) complex. Thus, reverse intersystem crossing is achieved by harvesting environmental thermal energy. As a consequence, these molecules can harness both singlet and triplet excitons for light emission via fluorescence decay channels, and this leads to high external electroluminescence efficiency. The HOMO and LUMO energy levels and the energy gap of the Cu(II) complex are lower than those of the HL ligand, indicating that the corresponding electron transition from the HOMO to the LUMO for the Cu(II) complex is easier than that for the HL ligand. These contributions are helpful in understanding the nature of transition as well as the absorption spectra of both the ligand and the complex.
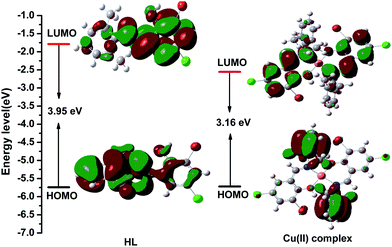 | ||
| Fig. 8 Visualization of the HOMOs, LUMOs, and energy gaps of the HL ligand and the Cu(II) complex calculated using the Gaussian 09 software package. | ||
3.5 Electrochemical characteristics
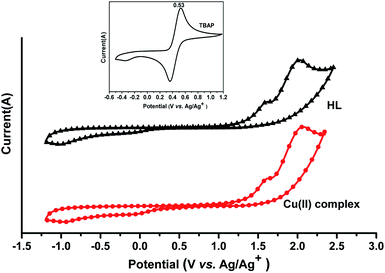
The cyclic voltammograms of the HL ligand and the Cu(II) complex were recorded in acetonitrile using 0.1 MTBAP as the supporting electrolyte with a scan rate of 100 mV s−1 at room temperature. An ITO glass substrate coated with a thin synthesized compound film was used as the working electrode. An Ag/AgCl electrode was used as the reference electrode and the ferrocene/ferrocenium (Fe/Fe+) redox couple was used as the external standard (Fig. 9). The HOMO and LUMO energy levels of the HL ligand and the Cu(II) complex can be estimated from the onset oxidation potential (Eonset) and Eferrocene as follows:38–40| HOMO = −[(Eonset – Eferrocene) + 4.80] (eV) |
| LUMO = Eoptg + HOMO |
For the HL ligand, Eonset = 1.34 V and Eferrocene = 0.53 V; thus, HOMO = −5.61 eV and LUMO = −2.41 eV.
For the Cu(II) complex, Eonset = 1.35 V and Eferrocene = 0.53 V; thus, HOMO = −5.65 eV and LUMO = −2.84 eV.
The results are listed in Table 2. The HOMO and LUMO energy levels and the energy gap of the Cu(II) complex are lower than those of the HL ligand, and this indicates that the corresponding electron transition from HOMO to LUMO for the Cu(II) complex is easier than that for the HL ligand.
The HOMO energy levels of the HL ligand and the Cu(II) complex were calculated using Gaussian 09 software and are relatively low, and the calculated LUMO energy levels of the HL ligand and the Cu(II) complex are relatively high compared to the results from the electrochemical study. Thus, the band gaps between the HOMO and LUMO (Eg), as calculated by the Gaussian 09 software, are higher than the optical band gaps (Eoptg). The discrepancies between the theoretical calculations and the experimental studies (photophysical and electrochemical) might be due to the fact that the calculations have been performed for a single molecule in the gaseous state, contrary to the experimental values recorded in the presence of intermolecular interactions in the solvent.
3.6 X-ray powder diffraction
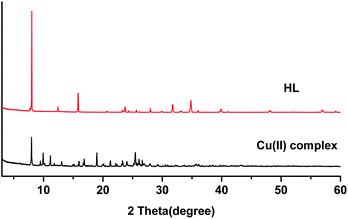
The powder X-ray diffraction (XRD) spectra of the HL ligand and its Cu(II) complex are shown in Fig. 10. The diffraction patterns were recorded in the range of 2θ = 2–60°. Each of them exhibits sharp peaks, indicating their crystalline nature. The X-ray diffraction peaks of the ligand and the Cu(II) complex were different. The HL ligand show peaks at 2θ = 8°, 16°, 24°, 32°, and 35°, and the complex displays peaks at 2θ = 8°, 10°, 11°, 17°, 19°, 21°, and 25°. The peaks at 2θ = 16°, 32°, and 35° of the HL ligand disappear in the complex and new peaks appear at 2θ = 10°, 11°, 17°, 19°, and 21°. This could be attributed to the formation of the complex. The detailed structures have been described in the single crystal X-ray diffraction results.3.7 Antibacterial activity
The HL ligand and the Cu(II) complex were screened for antibacterial activity against Staphylococcus aureus, Escherichia coli, and Pseudomonas aeruginosa by the TTC (2,3,5-triphenyltetrazolium chloride) method. The minimum inhibitory concentrations (MICs) of the compounds against the bacteria are presented in Table 3. Penicillin was used as the reference. The results revealed that the HL ligand and the Cu(II) complex exhibited significant antibacterial activity against Staphylococcus aureus, Pseudomonas aeruginosa, and Escherichia coli. It should be noted that the Cu(II) complex has the MIC value of 1.25 mmol L−1 against Escherichia coli, which is much lower than that of the reference drug.| Compounds | Staphylococcus aureus | Escherichia coli | Pseudomonas aeruginosa |
|---|---|---|---|
| HL ligand | 2.5 | 5 | 2.5 |
| Cu(II) complex | 2.5 | 1.25 | 2.5 |
| Penicillin | 10 | 10 | 2.5 |
4 Conclusions
The HL ligand and its mononuclear Cu(II) complex were synthesized. Both of them were characterized by elemental analysis, FTIR spectroscopy, and X-ray diffraction analysis. The HL ligand and its Cu(II) complex show excellent fluorescence property in DMSO solution and the maximum emission band is observed at 568 nm for the HL ligand and at 515 nm for the Cu(II) complex. The DFT calculations demonstrated that the HOMO and LUMO are effectively separated with the benzene ring of 2,6-dimethylbenzenamine as the donor unit, and the benzene ring of 3-bromo-5-chlorosalicylaldehyde and chelate ring as the acceptor unit. The effective HOMO–LUMO separation helps to induce an intramolecular charge transfer transition from the HOMO to the LUMO. This leads to a relatively small value for ΔE1–3. As a consequence, these are expected to harness both the singlet and triplet excitons for light emission via fluorescence decay channels, and this leads to high external electroluminescence efficiency. The HOMO–LUMO energy gap became smaller when the HL ligand coordinated with Cu(II), most likely due to Cu(II) perturbation effect. These theoretical calculations support the experimentally observed results. The biological assay revealed that both the HL ligand and the Cu(II) complex have different antimicrobial activities, and the Cu(II) complex has the MIC value of 1.25 mmol L−1 against Escherichia coli.Conflicts of interest
The authors declare no competing financial interest.Acknowledgements
The authors thank the financial supports from research project of the Phytochemistry Key Laboratory of Shaanxi Province (grant no. 19JS008), the Key Project Foundation of Baoji University of Arts and Sciences (grant no. ZK15085), and the doctoral research start-up project fund of Baoji University of Arts and Sciences (grant no. ZK2017032). The authors thank Pro Kaibei Yu at the Scientific Instrument Center of Beijing Institute of Technology for help with the single-crystal X-ray diffraction data collection and reduction.References
- X. L Zhang, Synth. React. Inorg., Met.-Org., Nano-Met. Chem., 2016, 46, 1848–1853 CrossRef.
- A. W. Tai, E. J. Lien, M. M. C. Lai and T. A. Khwaja, J. Med. Chem., 1984, 27, 236–238 CrossRef CAS PubMed.
- P. H. Wang, J. G. Keck, E. J. Lien and M. M. C. Lai, J. Med. Chem., 1990, 33, 608–614 CrossRef CAS PubMed.
- G. Turan-Zitouni, Z. A. Kaplancikli, A. Özdemir, P. Chevallet, H. B. Kandilci and B. Gümüsel, Arch. Pharm. Chem. Life Sci., 2007, 340, 586–590 CrossRef CAS PubMed.
- Y. W. Dong, R. Q. Fan, P. Wang, L. G. Wei, X. M. Wang, H. J. Zhang, S. Gao, Y. L. Yang and Y. L. Wang, Dalton Trans., 2015, 44, 5306–5322 RSC.
- K. M. Abuamer, A. A. Maihub, M. M. El-Ajaily, A. M. Etorki, M. A. Abou-Krisha and M. A. Almagani, Int. J. Org. Chem., 2014, 4, 7–15 CrossRef.
- M. Fuchs, S. Schmitz, P. M. Schäfer, T. Secker, A. Metz, A. N. Ksiazkiewicz, A. Pich, P. Kögerler, K. Y. Monakhov and S. Herres-Pawlis, Eur. Polym. J., 2019 DOI:10.1016/j.eurpolymj.2019.109302.
- S. Asadizadeh, M. Amirnasr, F. F. Tirani, A. Mansouri and K. Schenk, Inorg. Chim. Acta, 2018, 483, 310–320 CrossRef CAS.
- V. W. Yam, V. K. Au and S. Y. Leung, Chem. Rev., 2015, 115, 7589–7728 CrossRef CAS PubMed.
- M. Badea, L. Calu, M. C. Chifiriuc, C. Bleotu, A. Marin, S. Ion, G. Ioniţă, N. Stanică, L. Maăruţescu, V. Lazăr, D. Marinescu and R. Olar, J. Therm. Anal. Calorim., 2014, 118, 1145 CrossRef CAS.
- M. M. H. Khalil, E. H. Ismail, G. G. Mohamed, E. M. Zayed and A. Badr, Open J. Inorg. Chem., 2012, 2, 13 CrossRef CAS.
- A. A. Alothman, E. S. Al-Farraj, W. A. Al-Onazi, Z. M. Almarhoon and A. M. Al-Mohaimeed, Arabian J. Chem., 2019 DOI:10.1016/j.arabjc.2019.02.003.
- I. Buta, L. Cseh, C. Cretu, D. Aparaschivei, C. Maxim, E. H.-H. N. Stanica, E. Ohler, E. Rentschler, M. Andruh and O. Costisor, Inorg. Chim. Acta, 2018, 475, 133–141 CrossRef CAS.
- K. Sarmah, G. Pandit, A. B. Das, B. Sarma and S. ratihar, Cryst. Growth Des., 2017, 17, 368–380 CrossRef CAS.
- W. H. Mahmoud, R. g. Deghadi, M. M. I. Desssouky and G. G. Mohamed, Appl. Organomet. Chem., 2018, e4556 Search PubMed.
- S. M. Emam, S. A. Abouel-Enein and E. M. Abdel-Satar, Appl. Organomet. Chem., 2019, e4847 CrossRef.
- H. Tian, X. Qiao, Z. L. Zhang, C. Z. Xie, Q. Z. Li and J. Y. Xu, Spectrochim. Acta, Part A, 2018, 207, 31–38 CrossRef PubMed.
- R. Nandhini, G. Venkatachalam, M. D. Kumar and M. Jaccob, Polyhedron, 2019, 158, 183–192 CrossRef CAS.
- N. Beyazit, S. Çobanoğlu and C. Demetgül, Bulg. Chem. Commun., 2017, 49, 115–121 Search PubMed.
- S. Ramezani, M. Pordel and A. Davoodnia, Inorg. Chim. Acta, 2019, 484, 450–456 CrossRef CAS.
- S. Chakraborty, D. D. Purkayastha, G. Das, C. R. Bhattacharjee, P. Mondal, S. K. Prasad and D. S. Rao, Polyhedron, 2016, 105, 150–158 CrossRef CAS.
- A. M. Abu-Dief and I. M. A. Mohamed, Beni-Suef Univ. J. Basic Appl. Sci., 2015, 4, 119–133 CrossRef.
- C. W. Dikio, B. J. Okoli and F. M. Mtunzi, Cogent Chem., 2017, 3, 1–14 Search PubMed.
- A. W. Jeevadason, K. K. Murugavel and M. A. Neelakantan, Renewable Sustainable Energy Rev., 2014, 36, 220–227 CrossRef.
- E. Hadjoudis and I. M. Mavridis, Chem. Soc. Rev., 2004, 33, 579–588 CAS.
- Y. W. Dong, P. Wang, R. Q. Fan, W. Chen, A. N. Wang and Y. L. Yang, J. Coord. Chem., 2017, 70, 1953–1972 CrossRef CAS.
- I. Majumder, P. Chakraborty, S. Dasgupta, C. Massera, D. Escudero and D. Das, Inorg. Chem., 2017, 56, 12893–12901 CrossRef CAS PubMed.
- S. Biswasa, M. Dolaia, A. Duttaa and M. Alia, J. Mol. Struct., 2016, 1125, 688–695 CrossRef.
- K. Li, G. S. M. Tong, Q. Wan, G. Cheng, W. Y. Tong, W. H. Ang, W. L. Kwong and C. M. Che, Chem. Sci., 2016, 7, 1653–1673 RSC.
- G. M. Sheldrick, SHELXTL, Version 5.1, Software Reference Manual, Madison (WI, USA), Bruker AXS Inc., 1997 Search PubMed.
- G. M. Sheldrick, SHELXL-97, Program for Crystal Structure Refinement, University of Gōttingen, Germany, 1997 Search PubMed.
- M. J. Frisch, Gaussian 09, Revision A.1, Gaussian, Inc., Wallingford, CT, 2009 Search PubMed.
- P. Geerlings, F. D. Proft and W. Langenaeker, Chem. Rev., 2003, 103, 1793–1874 CrossRef CAS PubMed.
- X. L. Zhang, Inorg. Nano-Met. Chem., 2017, 44, 105–109 CrossRef.
- X. L. Zhang, Synth. React. Inorg. Met.-Org. Chem., 2016, 46, 1848–1853 CrossRef CAS.
- D. Tomczyk, L. Nowak, W. Bukowski, K. Bester, P. Urbaniak, G. Andrijewski and B. Olejniczak, Electrochim. Acta, 2014, 121, 64–67 CrossRef CAS.
- A. Ourari, I. Bougossa, S. Bouacida, D. Aggoun, R. Ruiz-Rosas, E. Morallon and H. Merazig, J. Iran. Chem. Soc., 2017, 14, 703–715 CrossRef CAS.
- X. B. Hu, Y. N. Guo, D. M. Wang, X. H. Pu and Q. Chen, J. Polym. Res., 2018, 25, 67–74 CrossRef.
- Y. Song, H. Y. Yao, H. W. Tan, S. Y. Zhu, B. Dong and S. W. Guan, Dyes Pigm., 2017, 139, 730–736 CrossRef CAS.
- M. K. Ghosh, S. Pathak and T. K. Ghorai, ACS Omega, 2019, 4(14), 16068–16079 CrossRef CAS PubMed.
Footnote |
| † Electronic supplementary information (ESI) available. CCDC 1040318 and 1040317. For ESI and crystallographic data in CIF or other electronic format see DOI: 10.1039/c9ra07298e |
| This journal is © The Royal Society of Chemistry 2019 |

