 Open Access Article
Local atomic order of the amorphous TaOx thin films in relation to their chemical resistivity
Krystyna Lawniczak-Jablonska *a,
Anna Wolska
 a,
Piotr Kuzmiuka,
Pawel Rejmak
 a and
Kamil Kosiel
 b
b
aInstitute of Physics, Polish Academy of Sciences, Al. Lotników 32/46, 02-668 Warsaw, Poland. E-mail: jablo@ifpan.edu.pl
bŁukasiewicz Research Network – Institute of Electron Technology, Al. Lotników 32/46, 02-668 Warsaw, Poland
First published on 4th November 2019
Abstract
The experimental and theoretical studies of the local atomic order and chemical binding in tantalum oxide amorphous films are presented. The experimental studies were performed on thin films deposited at the temperature of 100 °C by atomic layer deposition on silicon (100) and glass substrates. Thin films of amorphous tantalum oxide are known to exhibit an extremely large extent of oxygen nonstoichiometry. Performed X-ray absorption and photoelectron studies indicated the oxygen over-stoichiometric composition in the considered films. Surplus oxygen atoms have 1s electron level with binding energy about 1 eV higher than these in reference Ta2O5 oxide. The density functional theory was applied to find the possible location of additional oxygen atoms. Performed calculation indicated that additional atoms may form the dumbbell defects, which accumulate the dangling oxygen bonds in orthorhombic structure and lead to increase of oxygen 1s level binding energy. The presence of this kind of oxygen–oxygen bonding may be responsible for increase of amorphous film chemical resistivity which is very important in many applications.
Introduction
Thin films of tantalum oxide (TaOx) are considered to be promising materials for many applications from microelectronics,1–5 nano-coatings6 to the biotechnology.7 Thanks to the large values of dielectric constant, electrical resistance and outstanding tolerance to the high voltage breakdown, they have been applied as dielectrics in metal-insulator-metal memory devices, thin film capacitors for radiofrequency applications, or metal-oxide-semiconductor transistors. Amorphous TaOx (a-TaOx) may form non-stoichiometric materials, including sub-oxides, as well as oxygen over-stoichiometric compositions.The study performed in the presented paper aimed to elaborate technology of applying films of a-TaOx in a regenerable optical fiber biosensor.8–10 The required material should be resistant to environmental threats or even play a role of protective coating. TaOx seems to be a good candidate for oxide nanocoating of high chemical stability.6,9 To be chemically robust, the material should be amorphous rather than in Ta2O5 crystalline form.9,11 Moreover, the chemically robust TaOx films used for the mentioned above fiber sensor already proved to be oxygen over-stoichiometric.8
Recently, also oxide-based resistance switching devices have attracted considerable attention. They exhibit high scalability, fast switching speed and low power consumption. Therefore, they have high potential in applications in the next-generation resistive random access memory (RRAM) devices.12,13 The amorphous TaOx (x < 2.5) based resistance switches have been widely reported in the literature (e.g., Pt/TaOx/TaOy/Pt14–16) and have shown high switching speed, long endurance and low operation bias voltage, compared to RRAM devices using other materials. It is believed that the switching mechanism of resistance switches based on O-deficient materials can be ascribed to the diffusion of O ions or vacancies. This issue was comprehensively discussed theoretically [e.g. ref. 17 and 18]. The electrical, optical and chemical properties of the materials critically depend on their local composition and structure. The direct relation of leakage current in TaOx capacitors to their amorphous structure and increase in number of oxygen atoms in the first shell has been demonstrated.11 Therefore, most of the applications and discussion in the literature concentrate on sub-oxides and the role of O vacancies or other defects to explain the observed properties in O-deficient materials.14–19 A tentative assumption of the formation of virtual oxygen vacancy has been commonly introduced for qualitative explanation of the observed sub-oxides but it cannot explain over-oxides.11,20 There is not much work devoted to the studies of a-TaOx materials with the excess of oxygen (x > 2.5). The effort to explain broad oxygen non-stoichiometry by the variation of coordination number (CN) of oxide ions (O2−) in polyhedra around Ta have been reported.21 Authors present extended X-ray absorption fine structure (EXAFS), X-ray photoelectron spectroscopy (XPS), Raman scattering and Rutherford back scattering studies. The simple network structure of corner-sharing considered usually in Ta2O5 was modified in this work by adding the edge-sharing, or plane-sharing possibility. This approach resulted in the variation of the type and the density of dangling bonds or double bonds to complete the polyhedra network to minimize the electronic defects. The authors postulated that large non-stoichiometry was attained by the formation of lower than TaO7 coordinated polyhedra.21
In order to understand and make use of chemical resistivity of a-TaOx based materials, an investigation into the origins of these phenomena is necessary. Therefore, in the presented studies we are looking for the possible explanation of outstanding chemical resistivity of the over-stoichiometric a-TaOx films. Two a-TaOx films of different thickness, grown at low temperature on different substrates in the same technological process and showing high resistance in alkaline environments, were investigated in relation to crystalline Ta2O5 reference to explain their chemical resistivity. There is still controversy about crystal structure of Ta2O5 [e.g. ref. 22–26]. However, the significance of local Ta2O5 structure rather than long-range order and crystal symmetry, for the properties of this material was postulated.26 The best experimental method to estimate the atomic local structure is EXAFS. Below we present the results of detailed analysis of the EXAFS spectra of reference stoichiometric Ta2O5 and a-TaOx films. Knowing that the Ta–O bonds in the considered materials are strongly asymmetric we present the EXAFS results up to third coordination shell taking into account this anisotropy (in contrast to the results presented in ref. 21 where only average distance and average number of atoms in the first shell were presented).
The chemical binding of elements and stoichiometry of films surface was studied by XPS. For the applications at the ambient condition the surface of as received films (exposed to the air already in technological process) is important, therefore, no surface cleaning was performed.
Most of the reported theoretical works is dealing with the O-deficient materials and consider the possible location of O-vacancies. The a-TaOx films with excess of oxygen atoms are studied in our paper and presented DFT simulations indicate the possible location and binding of the redundant oxygen.
Experimental
Thin films were deposited at the temperature of 100 °C by atomic layer deposition (ALD) in the same process on silicon (100) and glass. The details of the ALD process are described in ref. 9. For each substrate, layers with two thicknesses (62 nm and 202 nm) were prepared. The crystalline commercial Ta2O5 powder delivered by Johnson Matthey (offered as a spectroscopic-quality standard) was used as XAS and XPS stoichiometric standard supporting quantitative analysis of films.X-ray absorption spectra for films were collected at BL8 beamline NSRC (Thailand) using Ge(220) monochromator27 and for reference powder at XAFS Elletra (Italy) beamline (11.1R) using Si(111) monochromator. The reference powder was measured in transmission mode, while films in fluorescence mode. The XRD studies confirmed that deposited films were amorphous.8
XPS measurements were done using a Scienta R4000 hemispherical analyser. The X-ray source was Scienta MX650 monochromator with a power of 300 W and Al Kα radiation (1486.7 eV). The full width at half maximum (FWHM) of the 4f7/2 Au line measured at the same experimental condition was 0.64 eV. The energy scale was calibrated by setting the C 1s line at the position 285.0 eV. To avoid significant sample charging, the neutralization gun was used. Samples were measured as received.
Theoretical
The density functional theory (DFT) calculations with periodic boundary conditions were performed for Ta2O5 orthorhombic structure28 Both stoichiometric and the one with single O add-atom per unit cell (i.e. Ta2O5.5 formula) were considered. Gradient PBE functional was employed in all DFT calculations.29 Geometry optimization was performed with plane wave-pseudopotential DFT code QUANTUM ESPRESSO.30 Ultrasoft pseudopotentials (downloaded from http://www.quantum-espresso.org) were applied,31 plane-wave energy cutoff was set to 40 Ry. Both atomic positions and cell parameters were optimized, with convergence threshold for gradient norm and energy set 10−4 and 10−6 in atomic units, respectively. Brillouin zone was sampled with 2 × 4 × 2 k-point mesh. Consequently, in order to get insight into energies of core O 1s states, single point all electron calculations were achieved with CRYSTAL code,32 which employs Gaussian basis set (pob-DZVP basis set for O is attached with code, for Ta valence electron basis set, with effective core potential, were taken from CRYSTAL website http://www.crystal.unito.it/Basis_Sets).Results and discussion
X-ray absorption spectra
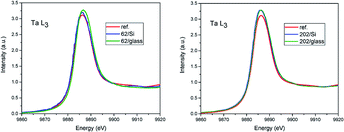
The comparison of X-ray absorption near edge structure (XANES) of Ta L3 spectra is shown in Fig. 1. The only difference seen is the increase of the first resonance amplitude in films as compared to the reference (red curve). It can be related to the over-stoichiometry and additional unoccupied states formed in the films. In the case of 62 nm film on glass the small shift (0.3 eV) in direction of higher energy of the spectrum edge is observed. Due to the fact that Ta metal was not simultaneously measured it can be in the error of energy scale calibration.The EXAFS analysis of the Ta L3 edges was performed to examine the local atomic order around Ta in the films as compared to the reference Ta2O5 powder. The coordination spheres with O and Ta atoms up to 5.0 Å for reference powder and over 4.0 Å for films, respectively, were considered, depending on the quality of experimental spectra. The fittings were performed using Athena and Artemis packets33 in R space simultaneously with k2 and k3 weights. The data were Fourier transformed in the range from 3.3 to 9.3 for films with 62 nm thickness and from 3.0 to 10.2 for 202 nm films with Hanning window.
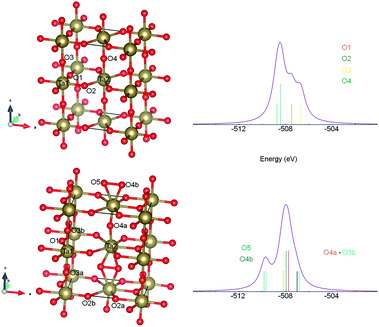
There is still ongoing discussion about the crystal structure of stoichiometric Ta2O5.21–25,28 To generate the scattering paths for EXAFS analysis in FEFF6 program we have considered several structures and the best agreement with experiment was obtained for the orthorhombic one, referred in literature as βA,24,28 after optimization at DFT level. This result is somewhat intriguing, as βA phase was predicted to be the least stable Ta2O5 polymorph in DFT calculation.21 However, one should be aware that EXAFS technique see the local environment of the central atom (within about 5 Å in the studied case), not the long range ordering of the sample. Therefore, as we do not claim that our reference powder sample is built of βA-Ta2O5 crystallites, it is clear that at least the local neighbourhood of Ta atoms in the samples resemble this of orthorhombic βA phase. Moreover, it is believed now that the long range order is not so important for understanding physical properties of this material like the short range order.17 Within βA structure Ta atoms occupy two non-equivalent positions, one inside only corner sharing TaO6 octahedra, and the other within both corners and edge sharing octahedral units (see Fig. 7).
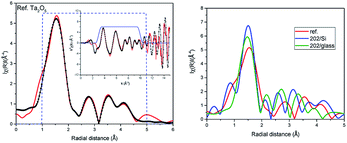
To generate the proper scattering paths we have used the aggregate procedure available in the Artemis.33 In the fitting only single scattering paths listed in Table 1 were used. In the best fit shown in Fig. 2 the number of atoms in each scattering paths was kept as generated in FEFF6 program for orthorhombic structure and So2 factor was set to 1. Nevertheless, the distances of atoms differ from the crystallographic ones more than the estimated errors of fitting given in the parentheses in Table 1. All experimental paths are shorter than theoretical ones, except the last three paths of second oxygen shell (no. 12–14) which are slightly longer but the fitting uncertainties are larger here than for other paths. The small disorder (Debye–Waller) parameters σ2 indicate low chemical disorder in the reference powder. Despite the fact that distances of some subshell resulted from FEFF6 calculations do not differ much we decided to use all of them because they differ in scattering strengths (from 100% to 12%). The EXAFS fitting reported in ref. 34 for Ta2O5 shows 3 oxygen scattering paths, where path no. 1 has negligible contribution to the fit with the σ2 well above reasonable physical value (0.173). Comparing to our fit we have got more asymmetric bonds length with first oxygen atom close to Ta and similar distances for paths no. 2. The path no. 3 is shorter than in our fitting. Authors of ref. 34 did not consider further scattering paths. Our detailed XAS studies confirmed that short range order of atoms in the orthorhombic structure optimized at DFT level provides very good fit to the EXAFS spectra. This is the first experimental confirmation that the short range order existing in Ta2O5 resembles that foreseen in orthorhombic phase. We also have performed EXAFS analysis using other proposed Ta2O5 structures, including γ-Ta2O5 phase predicted to be more stable at DFT level.24 For the βA structure the obtained bond lengths were consistently shorter in respect to the theoretical model (except for the farthest paths). While for the γ structure some bonds were shorter and some were longer even within the same coordination shell introducing high distortions into the model. Moreover, in case of the βA structure these changes were smaller, staying closer to the initial model and the resulted R factor, used to measure the quality of fit, was smaller. Therefore, the βA structure was used in the further studies. The analysis of stoichiometric Ta2O5 was the starting point to analyse the amorphous films.
| No. | Model | Exp. | No. | Model | Exp. | No. | Model | Exp. | |||
|---|---|---|---|---|---|---|---|---|---|---|---|
| O | CN | R (Å) | R (Å) | Ta | CN | R (Å) | R (Å) | O | CN | R (Å) | R (Å) |
| 1 | 1 | 1.85 | 1.80(1) | 6 | 2 | 3.70 | 3.47(1) | 9 | 4 | 4.18 | 4.13(1) |
| 2 | 2 | 1.94 | 1.89(1) | 7 | 4 | 3.74 | 3.64(1) | 10 | 10 | 4.22 | 4.18(1) |
| 3 | 1 | 2.09 | 2.01(2) | 8 | 2 | 3.89 | 3.84(2) | 11 | 2 | 4.30 | 4.26(1) |
| 4 | 2 | 2.19 | 2.04(1) | 12 | 3 | 4.41 | 4.48(6) | ||||
| 5 | 1 | 3.25 | 2.98(1) | 13 | 4 | 4.46 | 4.48(6) | ||||
| 14 | 2 | 4.92 | 4.93(6) | ||||||||
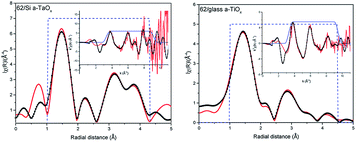
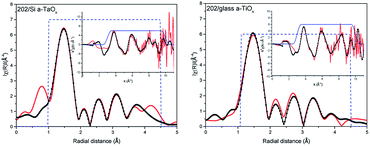
The comparison of the Fourier transforms of the reference and films spectra is shown in Fig. 2 (right). The amplitude of the first coordination shell in films is higher than in reference, indicating the possible over-stoichiometry and the distances of shells are different. The results of the best fits to EXAFS spectra of amorphous films are collected in Table 2 and presented in Fig. 3 and 4 for films with thickness 62 and 202, respectively.
| Structural model (DFT) | 62 nm/Si | 62 nm/glass | 202 nm/Si | 202 nm/glass | |||||||||||
|---|---|---|---|---|---|---|---|---|---|---|---|---|---|---|---|
| No. | SA | R (Å) | CN | R (Å) | CN | σ2 | R (Å) | CN | σ2 | R (Å) | CN | σ2 | R (Å) | CN | σ2 |
| 1 | O | 1.85 | 1 | 1.81 (1) | 1.6 (1) | 0.003 (1) | 1.83 (1) | 2.6 (1) | 0.005 (1) | ||||||
| 2 | O | 1.94 | 2 | 1.98 (1) | 5.0 (1) | 2.01 (1) | 4.1 (1) | 1.94 (04) | 5.5 (4) | 0.009 (1) | 1.94 (03) | 5.5 (3) | 0.009 (1) | ||
| 3 | O | 2.09 | 1 | ||||||||||||
| 4 | O | 2.19 | 2 | 2.25 (1) | 2.6 (1) | 2.23 (1) | 1.5 (2) | 2.19 (2) | 1.7 (3) | 2.21 (1) | 2.0 (3) | ||||
| 5 | O | 3.25 | 1 | 3.14 (4) | 1.2 (5) | 3.01 (1) | 1.7 (3) | 2.94 (1) | 3.2 (6) | 3.52 (3) | 2.1 (7) | ||||
| Sum O | 7 | 10.4 | 9.9 | 10.4 | 9.6 | ||||||||||
| 6 | Ta | 3.70 | 2 | 3.72 (1) | 5.0 (5) | 0.005 (1) | 3.74 (1) | 3.6 (2) | 0.003 (2) | 3.32 (2) | 2 | 0.009 (1) | 3.18 (1) | 3.5 (5) | 0.007 (1) |
| 7 | Ta | 3.74 | 4 | 3.74 (1) | 4.0 (4) | 3.60 (1) | 2.0 (4) | 3.43 (2) | 2 | 3.43 (1) | 4 | ||||
| 8 | Ta | 3.89 | 2 | 3.89 (1) | 3.3 (4) | 3.67 (3) | 4 | 3.77 (2) | 2 | ||||||
| Sum Ta | 8 | 9 | 8.9 | 8 | 9.5 | ||||||||||
| 9 | O | 4.18 | 4 | 4.21 (4) | 4 | 0.015 (3) | 3.99 (3) | 4 | 0.015 (7) | 4.20 (2) | 4 | 0.013 (2) | 4.23 (1) | 4 | 0.019 (3) |
| 10 | O | 4.22 | 10 | 4.26 (4) | 10 | 4.23 (2) | 10 | 4.25 (2) | 10 | 4.28 (1) | 10 | ||||
| 11 | O | 4.30 | 2 | 4.38 (3) | 2 | 4.30 (5) | 2 | 4.33 (2) | 2 | 4.37 (1) | 2 | ||||
| 12 | O | 4.41 | 3 | 4.49 (5) | 3 | 4.41 (5) | 3 | 4.57 (8) | 3 | 4.57 (1) | 3 | ||||
| 13 | O | 4.46 | 4 | 4.53 (5) | 4 | 4.52 (5) | 4 | 4.57 (6) | 4 | 4.57 (4) | 4 | ||||
| Sum O | 23 | 23 | 23 | 23 | 23 | ||||||||||
| E0 = 5.6 eV | E0 = 5.6 eV | E0 = 6.0 eV | E0 = 6.0 eV | ||||||||||||
Analysing parameters obtained from EXAFS data fitting the considerable increase of the number of oxygen atoms in the first oxygen shell with respect to reference Ta2O5 can be noticed. These atoms are located in four sub-shells (without path no. 3) for 62 nm films and only in three sub-shells for 202 nm films (without paths no. 1 and 3). Slightly more atoms were found in those films grown on Si than on glass. In the case of the amorphous structure static displacement (chemical disorder) has considerable contribution to the Debye–Waller disorder factor and in the EXAFS fitting the estimated CN can have large error, what leads to the higher CN value than the actual one.11 To deal with this correlation we kept one disorder parameter for each path in a given shell. The effort to introduce lower CN leads to not acceptable low disorder parameter. Moreover, further shells were also considered. The EXAFS analysis is usually more accurate for the nearest shells. Therefore, subsequent way of setting the parameters was adopted: (1) in the first oxygen shell and Ta shell the CN were used as fitting parameters, (2) for the further oxygen shells, the CN was set to the numbers given by the crystallographic model. In this case changes in the CN are hidden in the disorder parameter. During the fitting several different parameter configurations were considered. Here, we had described the approach that gave good results for the simplest model.
Summarizing, within a-TaOx films, in the first oxygen shell more oxygen atoms are located than in crystalline phase. Moreover, this number is slightly lower for films grown on glass. For Ta shell the number of atoms was increased by ∼1 atom (what is in the limit of fitting uncertainties) but in different distances (sub-shells) and with different occupancy of the sub-shells than in the model. For the second oxygen shell the distances of subshell mostly differ for path no. 9. It is worth noting that error in estimation of CN and distances increases with distance from absorbing atoms. The disorder parameters are higher for 202 nm films as compared to 62 nm films. Judging from the number of detected paths in O shell and value of disorder parameters the 202 nm films have the higher level of amorphisation than those of 62 nm. The oxygen–tantalum bonds differ in the length more than fitting uncertainties indicating that the formed polyhedrons are not regular. Moreover, CN in each path is changing in the films. It may be realized by different number of polyhedrons forming the network of the corner-sharing, the edge-sharing or the plane-sharing what leads to different average number of oxygen atoms around Ta.
Comparing our results with these reported in ref. 21 for a-TaOx film with wide range of x we will focus only on relation to the samples with x > 2.5. The XANES spectra of L3 Ta edge, similarly as in our spectra, show only slight increase in amplitude of first resonant indicating the increase of the density of Ta 5d unoccupied states. In the EXAFS analysis, the authors of ref. 21 have shown radial distribution function together with the resulted average CN and Ta–O bond lengths only for the first shell without details of performed analysis. They observed increase of CN with increase of x which saturated at x = 2.45 at the level of 6.75. In crystalline βA Ta2O5 the CN is 6, if one takes into account the oxygen at the distance up to 2.5 Å, therefore they observed also the increase of CN in over oxidised films. Regarding the average Ta–O bond, in contrast to their observation, we do not find the considerable shrinking of the bond with the increase of CN even after averaging the all sub-shells (e.g. 2.03 Å in reference and 2.01 Å in 202 on glass film).
X-ray photoelectron spectroscopy
The described above short range order in a-TaOx realized by different polyhedral network leads to the variation of the type and the density of dangling bonds needed to minimize the electronic defects. To examine the chemical bonding of oxygen and tantalum atoms in these amorphous films with excess of oxygen the analysis of XPS spectra was performed using CASA program.35 Due to the fact that the studied films are applied for covering the sensors working in the normal atmospheric conditions we examined them as received without cleaning. The shape of spectra was simulated by applying Gaussian–Lorentzian functional – GL(30) after Shirley background subtracting. For the reference sample O 1s line two components were necessary to fit the spectrum (Fig. 5 left), whereas in all films to get a good fit the third component has to be added (Fig. 5 right) as can be seen e.g. for 202 nm on glass film. The three components of O 1s in tantalum oxide nano-coating have been observed before in amorphous films.6 The observed shift by about +1 eV was related to C–O bond and not discussed.6 The carbon surface contamination in reference powder was at the same level as for films and such component was not observed. Moreover, the shift of O 1s line in metal oxide by about +1 eV is assigned to a change in oxide chemistry [e.g. p. 715 ref. 36], but O bond to C usually has energy shift higher than 2 eV [e.g. p. 674 ref. 36]. The numerical results of the XPS spectra fitting are collected in Table 3. Adding third component to the reference does not improve the spectrum fitting. The main component of O 1s has binding energy (BE) 530.4 ± 0.1 eV in agreement with Handbook of XPS Monochromatic spectra36 for Ta2O5. The third component shifted by about 2 eV from main line was attributed to OH and CO groups absorbed at the surface36 and was present in all samples. The second component was present only in films and was shifted from the main line by 1.1 eV in all films spectra. The content of this line was at the level of 15 to 17% of O 1s line area. The part related to surface contamination was at the level of ∼10% and was not changing much with the time of films exposition to the air. In the case of reference powder after 48 hour exposition to the air the surface contamination increases from 10 to 35%. This evidences the chemical resistance of amorphous films. The reference powder was measured immediately after 3 hours drying in the furnace at 700 °C.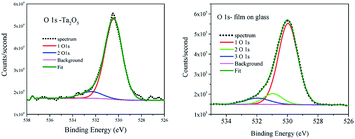 | ||
| Fig. 5 XPS of O 1s for reference Ta2O5 powder (left) and for 202 nm on glass amorphous film (right). | ||
| Line | Sample | |||||||||||
|---|---|---|---|---|---|---|---|---|---|---|---|---|
| 62 nm/Si | 62 nm/glass | 202 nm/Si | 202 nm/glass | |||||||||
| % | FWHM, eV | BE, eV | % | FWHM, eV | BE, eV | % | FWHM, eV | BE, eV | % | FWHM, eV | BE, eV | |
| 1-O 1s | 74.4 | 1.30 | 530.4 | 70.0 | 1.28 | 530.5 | 72.2 | 1.33 | 530.3 | 72.5 | 1.39 | 530.3 |
| 2-O 1s | 15.4 | 1.30 | 531.5 | 15.6 | 1.28 | 531.6 | 17.1 | 1.33 | 531.4 | 16.5 | 1.39 | 531.4 |
| 3-O 1s | 10.2 | 1.60 | 532.7 | 14.3 | 1.8 | 532.7 | 10.7 | 1.5 | 532.7 | 11.0 | 1.80 | 532.8 |
| Line | Sample | |||||||||||
|---|---|---|---|---|---|---|---|---|---|---|---|---|
| 62 nm/Si | 62 nm/glass | 202 nm/Si | 202 nm/glass | |||||||||
| O 1s | Ta 4f | O/4f | O 1s | Ta 4f | O/4f | O 1s | Ta 4f | O/4f | O 1s | Ta 4f | O/4f | |
| O/4f Ta | 66.8 | 33.2 | 2.0 | 72.5 | 27.5 | 2.6 | 73.3 | 26.7 | 2.7 | 75.1 | 24.9 | 3.0 |
| 1 + 2/4f Ta | 60.0 | 33.2 | 1.8 | 67.9 | 27.5 | ![[thin space (1/6-em)]](https://www.rsc.org/images/entities/char_2009.gif) 2.5 2.5 |
65.4 | 26.7 | 2.5 | 66.8 | ![[thin space (1/6-em)]](https://www.rsc.org/images/entities/char_2009.gif) 24.9 24.9 |
![[thin space (1/6-em)]](https://www.rsc.org/images/entities/char_2009.gif) 2.7 2.7 |
From the analysis of the surface composition of as received films, the ratio O![[thin space (1/6-em)]](https://www.rsc.org/images/entities/char_2009.gif) :
:![[thin space (1/6-em)]](https://www.rsc.org/images/entities/char_2009.gif) Ta was estimated (Table 3) in reference powder and films. Taking into consideration the full area of O 1s and Ta 4f lines, this ratio was equal to 1.85 for the reference, 2.0 and 2.6 for 62 nm film, and 2.7 and 3.0 for 202 nm on Si and glass, respectively. Considering only parts without surface contamination these relations were 1.7 for reference, 1.8 and 2.5 for 62 nm and 2.5 and 2.7 for 202 nm films on Si and glass, respectively. The ratio resulting from chemical formula should be 2.5. Therefore, for reference sample it is smaller. This can be related to the presence of oxygen defects in the Ta2O5 powder, what is postulated in several papers [ref. 11, 22 and 25 and references therein] and related to the high leakage current observed for this material. The relative sensitivity factor (RSF) used in CASA program may also be different than in our spectrometer. Nevertheless, the possible error related to RSF is the same in case of the reference and films. The observed experimentally increase of O
Ta was estimated (Table 3) in reference powder and films. Taking into consideration the full area of O 1s and Ta 4f lines, this ratio was equal to 1.85 for the reference, 2.0 and 2.6 for 62 nm film, and 2.7 and 3.0 for 202 nm on Si and glass, respectively. Considering only parts without surface contamination these relations were 1.7 for reference, 1.8 and 2.5 for 62 nm and 2.5 and 2.7 for 202 nm films on Si and glass, respectively. The ratio resulting from chemical formula should be 2.5. Therefore, for reference sample it is smaller. This can be related to the presence of oxygen defects in the Ta2O5 powder, what is postulated in several papers [ref. 11, 22 and 25 and references therein] and related to the high leakage current observed for this material. The relative sensitivity factor (RSF) used in CASA program may also be different than in our spectrometer. Nevertheless, the possible error related to RSF is the same in case of the reference and films. The observed experimentally increase of O![[thin space (1/6-em)]](https://www.rsc.org/images/entities/char_2009.gif) :
:![[thin space (1/6-em)]](https://www.rsc.org/images/entities/char_2009.gif) Ta ratio comparing to reference, indicates considerable enrichment of the surface in oxygen, i.e. over-stoichiometry of the films. This confirms the results of Rutherford backscattering spectroscopy reported for the same films8 and is in agreement with XAS finding.
Ta ratio comparing to reference, indicates considerable enrichment of the surface in oxygen, i.e. over-stoichiometry of the films. This confirms the results of Rutherford backscattering spectroscopy reported for the same films8 and is in agreement with XAS finding.
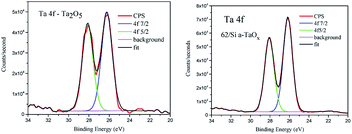
To analyse the chemical binding of the tantalum the Ta 4f lines were considered. We did not find pronounced differences between chemistry of these lines in reference and films (Fig. 6). The shift between spin–orbit doublet was 1.88 eV in agreement with reference data for Ta2O5.36 No low energy components were detected. The tantalum stoichiometric oxides comprise compounds of tantalum with various oxidation states between +2 and +5, like TaO, Ta2O3, TaO2 and Ta2O5.37 The most thermodynamically stable state of tantalum in oxides is 5+ (ref. 38 and 39) and this ionic state was found in the analysed films. The only difference in 4f lines was slightly bigger FWHM of the doublet lines in the case of reference (1.2 eV and 1.1 in films) and small change in the ratio of 4f7/2 to 4f5/2 area, which was 1.16 and 1.27, respectively.
Theoretical
In order to get qualitative understanding of the physical origin of observed additional component in O 1s line of films, the DFT calculations were performed for optimized βA orthorhombic structure28 without and with half additional oxygen atom per formula. We checked the orbital energies of O 1s states, relaying on the assumption that negative orbital energy approximates electron binding energy. The results are presented in Fig. 7. The O 1s states for crystallographic O sites 2 and 4 have, in the stoichiometric Ta2O5, similar orbital energies and O in sites 1 and 3 have lower BE (Fig. 7 upper panel). Upon the insertion of additional O atom, formation of dumbbell defect was predicted by realization of oxygen bonds between site 5 and 4b (Fig. 7 bottom panel). It results in additional feature at the higher BE and more localized main peak. This is in agreement with experimental XPS spectrum. The FWHM for reference main O 1s line was 1.8 eV and for films 1.3 eV (Table 3). Nevertheless, the line was not that much asymmetric in reference as it results from calculations (Fig. 5). It should be stressed that similar DFT results were obtained for a few other Ta2O5 polymorphs (e.g. for γ-Ta2O5 phase predicted to be more stable at DFT level,24 but gives less convincing fits to EXAFS data), i.e. DFT predicted that O add-atom insertion leads to the formation of dumbbell defect and that O 1s binding energies for dumbbell atoms are shifted by 1–2 eV toward higher values. Therefore, we believe that the explanation of the origin of second XPS peak in Ta2O5+x samples proposed here is plausible.Conclusions
XAS and XPS studies performed for amorphous TaOx films confirmed the oxygen over-stoichiometric composition as well in bulk (XAS) as at the surface (XPS). Several crystal structures, considered in the literature for Ta2O5, were investigated as a reference in performed studies. The orthorhombic structure gives very good agreement with experimental EXAFS Ta L3 data up to 5 Å from Ta absorbing atoms with the smallest distortion of the starting model. The FEFF6 calculation distinguished 5 single scattering paths in the first oxygen shell in this structure with 7 oxygen atoms, Ta shell has 8 scattering atoms and the second oxygen shell up to 23 atoms. To fit the experimental data only the distances of the atoms have to be modified. They, as usually in EXAFS, appear shorter than these resulting from crystallographic data. The XAS analysis of films indicated the increase of the number of oxygen atoms in the first Ta coordination sphere from 7 up to 10.4, differently in each film. This can be realized by change of the level of oxygen sharing which is somehow ordered in crystalline form but may be much less ordered in amorphous films. The absence of Ta–O–Ta bending and Ta–Ta vibration in over-stoichiometric films, observed in Raman spectra, supports this conclusion.21 Moreover, the anisotropy of Ta–O bonds and number of scattering paths is decreased in the films. These changes have no influence on Ta 4f line binding energy but additional component of O 1s line was detected in XPS studies which was interpreted on the base of DFT calculation as resulting from additional oxygen atoms forming dumbbell defect. The presence of this oxygen–oxygen bonding may be responsible for increased chemical resistivity of amorphous films in comparison with crystalline forms.Conflicts of interest
Authors state that there are no conflicts to declare.Acknowledgements
This work was partially supported by the EAgLE European project (FP7-REGPOT-2013-1, Project No. 316014), Polish Ministry of Science and Higher Education, Grant Agreement 2819/7.PR/2013/2, PL-Grid infrastructure (ACK Cyfronet) and as statutory activities at the Łukasiewicz Research Network – Institute of Electron Technology and Institute of Physics PAS. The authors would like to thanks Dr W. Klysubun, Synchrotron Light Research Institute, Thailand and Prof. Dr Josef Hormes, Louisiana State University (LSU) for offering the beamtime at BL8 NSRC, Thailand, and Diana Kalinowska and Marcin Klepka for help in XAS measurements.References
- M. T. Brumbach, P. R. Mickel, A. J. Lohn, A. J. Mirabal, M. A. Kalan, J. E. Stevens and M. J. Marinella, J. Vac. Sci. Technol., A, 2014, 32, 051403 CrossRef.
- M. Yu, Y. Cai, Z. Wang, Y. Fang, Y. Liu, Z. Yu, Y. Pan, Z. Zhang, J. Y. T. Tan, X. Yang, M. Li and R. C. C. Huang, Sci. Rep., 2016, 6, 21020 CrossRef CAS PubMed.
- P. Jain and E. J. Rymaszewski, Thin-Film Capacitors for Packaged Electronics, Kluwer Academic Publishers, 2004 Search PubMed.
- G. Carchon, K. Vaesen, S. Brebels, W. De Raedt, E. Beyne and B. Nauwelaers, IEEE Trans. Compon. Packag. Technol., 2001, 24, 510 CrossRef.
- G. D. Wilk, R. M. Wallace and J. M. Anthony, J. Appl. Phys., 2001, 89, 5243 CrossRef CAS.
- B. Díaz, J. Światowska, V. Maurice, A. Seyeux, E. Härkönen, M. Ritala, S. Tervakangas, J. Kolehmainen and P. Marcus, Electrochim. Acta, 2013, 90, 232–245 CrossRef.
- N. Donkov, A. Zykova, V. Safonov, R. Rogowska, J. Smolik and V. Lukyanchenko, Probl. At. Sci. Technol., Ser.: Plasma Phys., 2011, 131–133 CAS.
- K. Kosiel, K. Pągowska, M. Kozubal, M. Guziewicz, K. Lawniczak-Jablonska, R. Jakieła, Y. Syryanyy, T. Gabler and M. Smietana, J. Vac. Sci. Technol., A, 2018, 36, 031505 CrossRef.
- K. Kosiel, M. Dominik, I. Scislewska, M. Kalisz, M. Guziewicz, K. Gołaszewska, J. Niedziółka-Jonsson, W. J. Bock and M. Śmietana, Nanotechnology, 2018, 29, 135602 CrossRef CAS.
- M. Piestrzyńska, M. Dominik, K. Kosiel, M. Janczuk-Richter, K. Szot-Karpińska, E. Brzozowska, L. Shao, J. Niedziółka-Jonsson, W. J. Bock and M. Śmietana, Biosens. Bioelectron., 2019, 133, 223 CrossRef.
- H. Kimura, J. Mizuki, S. Kamiyama and H. Suzuki, Appl. Phys. Lett., 1995, 66, 2209 CrossRef CAS.
- J. J. Yang, M. D. Pickett, X. Li, D. A. A. Ohlberg, D. R. Stewart and R. S. Williams, Nat. Nanotechnol., 2008, 3, 429–433 CrossRef CAS PubMed.
- R. Waser, R. Dittmann, G. Staikov and K. Szot, Adv. Mater., 2009, 21, 2632–2663 CrossRef CAS.
- G. S. Park, Y. B. Kim, S. Y. Park, X. S. Li, S. Heo, M. J. Lee, M. Chang, J. H. Kwon, M. Kim, U. I. Chung, R. Dittmann, R. Waser and K. Kim, Nat. Commun., 2013, 4, 2382 CrossRef.
- S. Kim, S. Choi and W. Lu, ACS Nano, 2014, 8, 2369–2376 CrossRef CAS.
- F. Miao, W. Yi, I. Goldfarb, J. J. Yang, M. X. Zhang, M. D. Pickett, J. P. Strachan, G. Medeiros-Ribeiro and R. S. Williams, ACS Nano, 2012, 6, 2312–2318 CrossRef CAS.
- R. J. Bondi, M. P. Desjarlais, A. P. Thompson, G. L. Brennecka and M. J. Marinella, J. Appl. Phys., 2013, 114, 203701 CrossRef.
- B. Xiao and S. Watanabe, Nanoscale, 2014, 6, 10169 RSC.
- R. Ramprasad, J. Appl. Phys., 2004, 95, 954 CrossRef CAS.
- D. L-Hecht and R. Frahm, J. Synchrotron Radiat., 2001, 8, 478 CrossRef PubMed.
- T. Tsuchiya, H. Imai, S. Miyoshi, P.-A. Glans, J. Guo and S. Yamaguchia, Phys. Chem. Chem. Phys., 2011, 13, 17013 RSC.
- S. Perez-Walton, C. Valencia-Balvin, A. C. M. Padilha and G. M. Dalpin, J. Phys.: Condens. Matter, 2016, 28, 035801 CrossRef CAS.
- I. P. Zibrov, V. P. Filonenko, M. Sundberg and P. E. Werner, Acta Crystallogr., Sect. B: Struct. Sci., 2000, 56, 659 CrossRef CAS.
- Y. Yang and Y. Kawazoe, Phys. Rev. Mater., 2018, 2, 034602 CrossRef CAS.
- R. Hollerweger, D. Holec, J. Paulitsch, M. Bartosik, R. Daniel, R. Rachbauer, P. Polcik, J. Keckes, C. Krywka, H. Euchner and P. H. Mayrhofera, Acta Mater., 2015, 83, 276 CrossRef CAS PubMed.
- R. Nashed, W. M. I. Hassan, Y. Ismail and N. K. Allam, Phys. Chem. Chem. Phys., 2013, 15, 1352 RSC.
- W. Klysubun, P. Sombunchoo, W. Deenan and C. Kongmark, J. Synchrotron Radiat., 2012, 19, 930 CrossRef CAS.
- L. A. Aleshina and S. V. Loginova, Crystallogr. Rep., 2002, 47, 415 CrossRef CAS.
- J. P. Perdew, K. Burke and M. Ernzerhof, Phys. Rev. Lett., 1996, 77, 3865 CrossRef CAS.
- P. Giannozzi, S. Baroni, N. Bonini, M. Calandra, R. Car, C. Cavazzoni, D. Ceresoli, G. L. Chiarotti, M. Cococcioni and I. Dabo, et al., QUANTUM ESPRESSO, J. Phys.: Condens. Matter, 2009, 21, 395502 CrossRef PubMed.
- D. Vanderbilt, Phys. Rev. B: Condens. Matter Mater. Phys., 1990, 41, 7892–7895 CrossRef.
- R. Dovesi, A. Erba, R. Orlando, C. M. Zicovich-Wilson, B. Civalleri, L. Maschio, M. Rérat, S. Casassa, J. Baima, S. Salustro and B. Kirtman, Wiley Interdiscip. Rev.: Comput. Mol. Sci., 2018, 8, e1360 Search PubMed.
- B. Ravel and M. Newville, J. Synchrotron Radiat., 2005, 12, 537 CrossRef CAS.
- J. Ribeiro, G. Tremiliosi-Filho, P. Olivi and A. R. de Andrade, Mater. Chem. Phys., 2011, 125, 449 CrossRef CAS.
- F. Neal, Casa Software Ltd version 2.3.17.
- B. V. Crist, Handbooks of Monochromatic XPS Spectra, XPS International LLC, 2005, vol. 2, p. 698 Search PubMed.
- Y. R. Denny, T. Firmansyah, S. K. Oh, H. J. Kang, D.-S. Yang, S. Heo, J. G. Chung and J. Ch. Lee, Mater. Res. Bull., 2016, 82, 1 CrossRef CAS.
- R. S. Namur, K. M. Reyes and C. E. B. Marino, Mater. Res., 2015, 18, 91 CrossRef CAS.
- E. Atanassova, G. Aygun, R. Turan and T. Babeva, J. Vac. Sci. Technol., A, 2006, 24, 206 CrossRef CAS.
| This journal is © The Royal Society of Chemistry 2019 |

